2003 Annual Report - Enerflex
2003 Annual Report - Enerflex
2003 Annual Report - Enerflex

You also want an ePaper? Increase the reach of your titles
YUMPU automatically turns print PDFs into web optimized ePapers that Google loves.
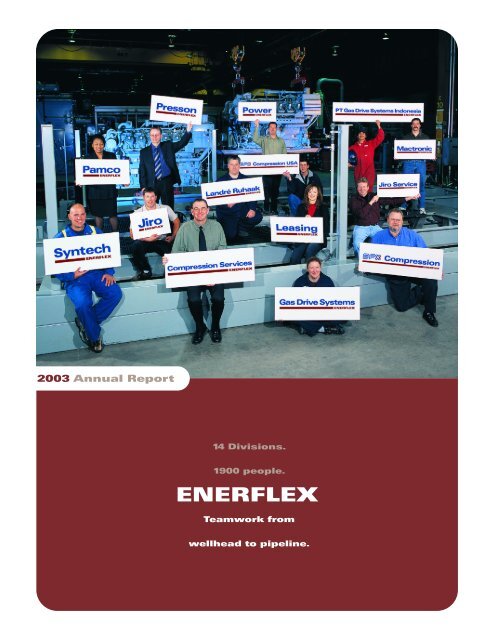
<strong>2003</strong> <strong>Annual</strong> <strong>Report</strong>14 Divisions.1900 people.Teamwork fromwellhead to pipeline.
Clint MarshallProposal TechnicianJiro<strong>Enerflex</strong> <strong>2003</strong> <strong>Annual</strong> <strong>Report</strong>Teamworkfrom wellheadto pipeline.
The Gen III A Series Gas Compressor PackageDesigned, engineered and manufactured by <strong>Enerflex</strong> Systems Ltd.2
The Total<strong>Enerflex</strong> SolutionToday’s oil and gas producers are looking for complete solutions,with best-in-class products and services. <strong>Enerflex</strong> meets thesechallenges. Over the years, <strong>Enerflex</strong> has grown by both product segmentand geography, adding new businesses through organic growth andacquisition.Jim DegenhardtResident PartsmanPamcoPowerMechanicalServiceCompressionThe Compression operating unit is a world-classpackager of natural gas compressionThisequipment, engineering and fabricating aoperating unitcomplete line of reciprocating andprovides ascrew compression packagesThe Power operating unitcomprehensive range ofthroughout the 5 to 6,000designs and fabricates powerelectrical, instrumentationhorsepower range.generation systems as stand-aloneand control technologies productsequipment packages or on a turnkey,and services to the petrochemical,installed basis. Their expertise includesenergy, forestry, pulp and paper, mining,co-generation facilities, turbine, dieseland agriculture industries worldwide.and gas reciprocating units.CUSTOMERLeasingElectrical,Instrumentation& ControlsProduction& ProcessingThe divisions of the Mechanical Serviceoperating unit provide field maintenanceservices, equipment and parts to the oil and gasindustry. With over 350 highly trainedpersonnel, the <strong>Enerflex</strong> MechanicalService unit operates in Canada,The Leasing operatingunit offers customersflexible and innovativeThis operating unit builds turnkey, integratedoil and gas production and processing facilitiesto meet the needs of the crude oil and naturalgas industry around the world. Thisincludes engineering, transportationand field services, productionthe United States, the UnitedKingdom, the Netherlands,Germany, Australia,and Indonesia.financing through which companiescan acquire the use of a broad range ofgas compression, power generation andprocess equipment. Leasing options includeequipment rentals andflare systems.short-term rentals, long-term capital and operatingleases and full-service contract operations.<strong>Enerflex</strong> <strong>2003</strong> <strong>Annual</strong> <strong>Report</strong>4
divisionsat a glanceStructurally, <strong>Enerflex</strong> is organized into three business segments:Service, Fabrication and Leasing. Together they allow <strong>Enerflex</strong>to provide a complete suite of services.These services are delivered through six operating units:Compression, Power, Mechanical Service, Production & Processing,Leasing, and Electrical, Instrumentation & Controls.Charlie BurgesonVessel Pipe SupervisorEFX CompressionWithin these units are the divisions, each a leading specialist in theirsector of the industry. Their expertise and experience providecustomers with stand-alone solutions to their needs or can be broughtto bear in concert with each other to create powerfully integratedteamwork – a total <strong>Enerflex</strong> solution, anywhere in the world.CompressionEFX CompressionAt the heart of <strong>Enerflex</strong> is our EFX Compression division headquartered in Calgary, Alberta. With more than 20 yearsof packaging experience, EFX Compression has become a global market leader in the custom engineering,fabrication and installation of modular compression facilities for the natural gas industry. The pioneer of thestandardized modular compressor package concept that revolutionized the industry, EFX Compression’s leadershipcontinues with the development of the new Gen III A Series compressor package and the cost-efficient BTB (Back-To-Basics) line-up of standardized compressor packages.JiroFrom its 82,000 sq. ft. (7,625 sq. m.) facility in Stettler, Alberta, Jiro is Canada’s leading provider of premium portablescrew gas compression solutions for applications under 400 horsepower. With its comprehensive line-up ofstandardized package modules, Jiro provides flexible, high performance and economical packages designed to befit-for-purpose with accessories pre-selected for simplicity and reliability.Compression ServicesPreviously known as Re-engineered Solutions, Compression Services is the dominant specialist in the reapplication,refurbishing and modification of natural gas compressor packages, creating substantial savings for the energyindustry while maximizing the life of existing equipment. Compression Services even offers its Phoenix Seriesline-up of standardized, reconditioned compression packages, further expanding the available choice ofcompression solutions.EFX Compression USALocated in Odessa, Texas, EFX Compression USA custom fabricates gas compressor packages for a variety ofapplications including acid gas, fuel gas boosters, gas chillers/refrigeration, gas gathering, landfill gas, R-22refrigeration, re-injection, vapor recovery, and wellhead applications.<strong>Enerflex</strong> <strong>2003</strong> <strong>Annual</strong> <strong>Report</strong>5
PowerPower<strong>Enerflex</strong> Power provides custom and standardized sub 10-megawatt reciprocating andturbine power generation packages worldwide. <strong>Enerflex</strong>’s power solutions bring thehighest standards of design, production and innovation to every project, whether in the formof a turnkey-solution, a custom-built package or a cost-effective standard package.Mechanical ServicePamcoPamco is the Canadian energy industry’s largest parts and service resource, the leaderin field maintenance, overhaul, parts and service of gas compression and powergeneration packages. Pamco maintains a $19 million parts inventory supported bymanufacturer warranties from the industry’s best suppliers. Pamco is the onlyauthorized Waukesha Engine distributor for Canada. Combined with its extensivenetwork of branch locations and the most factory-certified service technicians in thebusiness, Pamco’s reputation for reliability, technical knowledge and first-class serviceis unparalleled.Jiro ServiceJiro, the leading provider of portable gas compression solutions, also provides theleading field maintenance, parts and overhaul service for small horsepower portablescrew compressor packages in western Canada. With over 45 service technicians and25 fully equipped vehicles, Jiro Service is available to customers 24/7, for repair,preventive maintenance and package optimization, allowing production downtime to beminimized.Landré RuhaakLocated in Vianen, the Netherlands, Landré Ruhaak is the pre-eminent supplier tothe European energy industry of field maintenance and overhaul service, equipmentand parts for compression and power generation and complete co-generation packages.Landré Ruhaak is the only authorized Waukesha Engine distributor for the Netherlands,Portugal and Spain.Gas Drive SystemsGas Drive Systems provides after sales support and service for gas compression,power generation and co-generation equipment to Australia, the South Pacific andSoutheast Asia. To cover these areas effectively, branches are located in Sydney andPerth, allowing Gas Drive Systems to deliver their expertise where and when it’sneeded. Gas Drive Systems is the only authorized Waukesha Engine distributor forAustralia, Papua New Guinea and Indonesia.PT Gas Drive Systems IndonesiaPT Gas Drive Systems Indonesia brings the integrated offerings of <strong>Enerflex</strong> toIndonesia. This includes large and small application compression solutions, productionand processing design and commissioning, and equipment, parts and service forcompression and power generation packages. PT Gas Drive Systems Indonesia is theonly authorized Waukesha Engine distributor in its region.<strong>Enerflex</strong> <strong>2003</strong> <strong>Annual</strong> <strong>Report</strong>6
Today’s oil and gas producers are looking forcomplete solutions, with best-in-class productsand services. <strong>Enerflex</strong> meets these challenges.Production & ProcessingPressonWith over 24 years of experience, Presson is a global leader in the design and manufacture of oil and natural gasproduction and processing equipment. Located in Edmonton, Alberta, Presson is an integrated engineering, designand fabrication company. Presson offers a full range of products and services – from providing a single componentof an oil and natural gas operation, to creating a comprehensive service package that includes design through tocommissioning and operator training.MactronicBased in Red Deer, Mactronic is the industry leader in engineered flare systems. Mactronic invented andpatented the “Mac Ignitor” flare ignition technology system in the early 1980s. Today, Mactronic continues tolead the world in flare ignition technology and in the manufacturing of flare stacks, flare burners, flare knock-outdrums, and combustion systems.LeasingLeasing<strong>Enerflex</strong> Leasing offers financial options and solutions including short-term rentals, long-term capital and operatingleases and full-service contract options. <strong>Enerflex</strong> Leasing helps customers free up their capital to focus on otherbusiness issues, earning them a greater return and giving them maximum flexibility. <strong>Enerflex</strong> Leasing makes iteasier to have the right equipment for the right job at the right time.Electrical, Instrumentation & ControlsSyntechSyntech is the largest electrical and instrumentation open shop contractor in western Canada. Syntech provides acomprehensive range of electrical, instrumentation and control technologies products and services to thepetrochemical, energy, forestry, pulp and paper, mining and agriculture industries worldwide. Syntech not onlyfollows standards, but sets them when it comes to experience, quality workmanship and customer service.Syntech is the industry leader bringing systems to life.<strong>Enerflex</strong> <strong>2003</strong> <strong>Annual</strong> <strong>Report</strong>7
<strong>Enerflex</strong>at a glance($ millions, except per share data and ratios) <strong>2003</strong> 2002 2001Jacqui BlunsumReceptionistGas Drive SystemsRESULTSRevenue 515.5 326.7 375.0EBITDA (1) 51.2 30.0 47.8Income before income taxes 31.2 14.3 36.5Net income 20.4 9.2 22.5Per common share – basic 0.92 0.51 1.51Cash from operations before changesin non-cash working capital 34.9 22.7 30.0Capital expenditures, netRental equipment 3.7 8.5 10.0Property, plant and equipment 2.8 2.2 2.5Dividends per common share 0.40 0.40 0.40FINANCIAL POSITIONWorking capital 82.8 68.7 62.1Total assets 457.7 451.2 222.1Long-term debt 68.4 69.0 30.0Shareholders’ equity 274.5 260.9 118.5KEY RATIOSGross margin as a percentage of revenue 20.2 21.4 19.5Pre-tax income as a percentage of revenue 6.1 4.4 9.7Return on average equity (2) (%) 7.6 4.9 20.2(1) Earnings before interest, taxes, depreciation and amortization (EBITDA) is a non-GAAP(Generally Accepted Accounting Principles) earnings measure that does not have a standardizedmeaning prescribed by GAAP and therefore is unlikely to be comparable to similar measurespresented by other issuers.(2) Return on average equity is calculated as net income divided by the simple average ofshareholders’ equity at the beginning and end of the year.This document contains forward-looking statements, which are subject to certain risks,uncertainties and assumptions. Should one or more of these factors materialize, or shouldassumptions prove incorrect, actual results may vary significantly from those expected.<strong>Enerflex</strong> <strong>2003</strong> <strong>Annual</strong> <strong>Report</strong>8
financialhighlightsMichiel SapService EngineerLandré Ruhaakrevenue$ millions217 223 246 336 315 257 286 375 327 516international revenue$ millions13 32 59 71 53 62 37 97 92 12994 95 96 97 98 99 00 01 02 0394 95 96 97 98 99 00 01 02 03net income$ millionsebitda$ millions34 32 32 47 42 29 29 48 30 5194 95 96 97 98 99 00 01 02 03<strong>Enerflex</strong> <strong>2003</strong> <strong>Annual</strong> <strong>Report</strong>9
P. John Aldred Chairman, President and CEOJ. Blair Goertzen Executive Vice-President and COO10
People!Talented people.Skilled people.Motivated people.letterto shareholdersFeroze AnsariProposal TechnicianPower<strong>Annual</strong> reports are largely about numbers and we are pleasedto share the improvements in our financial results with you inthis report.Our results for <strong>2003</strong> were a substantial improvement over a challenging2002 for our industry and for <strong>Enerflex</strong>. A complete discussion of ourfinancial results is contained in the Management’s Discussion and Analysis of this<strong>Annual</strong> <strong>Report</strong>. Highlights for <strong>2003</strong>, which includes a full year of operations fromthe former EnSource businesses, acquired on July 18, 2002, include a:• 121% increase in net income to $20.4 million ($0.91 per diluted share)compared with $9.2 million ($0.51 per diluted share) in 2002.• 58% increase in revenue to $515.5 million compared with $326.7 millionin the prior year.• $19.9 million reduction of short and long-term bank debt, net of cash,from $109.2 million at the end of 2002 to $89.3 million on December 31,<strong>Enerflex</strong> hasbeen profitablein every yearsince it becamepublicly tradedin 1993.<strong>2003</strong>. Following the EnSource acquisition, the Company’s debt peaked atover $130 million.We are proud of our achievements over the course of the past year, butrecognize that there remain significant opportunities to improve in the future. Thepeople of <strong>Enerflex</strong> are confident that our restructuring in <strong>2003</strong> will deliver strongresults in 2004 and beyond.<strong>Enerflex</strong> is not just about numbers – it’s about the people who strive to satisfyour customers every minute of every day in every country that we serve. Our<strong>2003</strong> <strong>Annual</strong> <strong>Report</strong> is dedicated to our employees. Their commitment to customerservice creates value for our shareholders, which is reflected in our results.<strong>Enerflex</strong> <strong>2003</strong> <strong>Annual</strong> <strong>Report</strong>11
<strong>Enerflex</strong> has been profitable in every year since it became publicly traded in 1993.Financial markets, and the markets for the products and services that <strong>Enerflex</strong> provides,have had good years and lean years, but your Company has been consistently profitable.Throughout the past decade, through commodity price cycles, oil and gas industryconsolidation, technological advancements, and changes to the competitive landscape,our people have enabled <strong>Enerflex</strong> to adapt to new environments.In response to changes in our markets, <strong>Enerflex</strong> completed the strategic acquisition ofEnSource Energy Services Inc. in July of 2002. This business combination more thandoubled our staff complement, and we now have over 1,900 employees in Canada, theUnited States, the United Kingdom, the Netherlands, Germany, Australia, and Indonesia.An acquisition of this magnitude creates not only opportunities, but challenges, as anew culture and corporate identity evolve. To address changing circumstances, yourBoard of Directors acted decisively in <strong>2003</strong> to strengthen management. I returned to<strong>Enerflex</strong> as President and Chief Executive Officer to use my experience as founder toenhance the Company’s relationships with employees, customers, suppliers andshareholders and, in so doing, strengthen shareholder value. I remain in my role asChairman and a significant shareholder of our Company.In August, Blair Goertzen joined <strong>Enerflex</strong> as Executive Vice-President and ChiefOperating Officer. Blair brings 15 years of executive level experience in the energyservices sector and is playing a critical role in creating a lean, practical corporatestructure, with accountable leadership and empowered employees.I returned to <strong>Enerflex</strong> as President and CEO to use myexperience as founder to enhance the Company’s relationshipswith employees, customers, suppliers and shareholders.<strong>Enerflex</strong> <strong>2003</strong> <strong>Annual</strong> <strong>Report</strong>12
<strong>Enerflex</strong> is not just about numbers – it’s about the people whostrive to satisfy our customers every minute of every day inevery country that we serve.In <strong>2003</strong>, your Company renewed its focus on people. There have been a number of important leadership additionsto <strong>Enerflex</strong> during the past year, including:• Rachel Moore as Manager, Human Resources. Rachel’s mandate includes standardizing best practices inhuman resource management across our businesses and implementing compensation policies thatencourage and reward excellence.• Tom Gamble as Vice-President of our U.S. subsidiary. Based in Houston, Tom is responsible for ourcompression sales, fabrication and service businesses in the United States. Tom brings a strongunderstanding of U.S. markets and has 30 years of worldwide compression packaging experience.• Jagi Singh as Vice-President, Sales for EFX Compression. Jagi helped build our Company’s reputation forcustomer service from its inception into the 1990s and has returned to <strong>Enerflex</strong> following a number of yearswith a competitor.• Bill Moore, who built our Australian subsidiary Gas Drive Systems into the market leader, has accepted apromotion to Vice-President, Mechanical Service, with responsibility for mechanical service throughout theworld. Bill and his family have relocated to Calgary, Canada.• Yves Tremblay as Vice-President, Syntech. Yves was Vice-President, <strong>Enerflex</strong> Power, and previously managedthe service work of a large electrical utility in Alberta.• Earl Connors as Vice-President and General Manager, EFX Compression. Earl previously worked with<strong>Enerflex</strong> in the mid-1990s, when he assembled a talented engineering team and helped build our reputationas the pre-eminent compressor package manufacturer.These key leaders have helped bring a renewed vitality to <strong>Enerflex</strong>. But they are just part of the reason that weare most optimistic about the future prospects for your Company. All of our employees, who share this optimism,are working to build the Company’s success. Throughout this <strong>Annual</strong> <strong>Report</strong> you will see a few of the many peoplewho take pride in strengthening our business.<strong>Enerflex</strong> <strong>2003</strong> <strong>Annual</strong> <strong>Report</strong>13
All of our brands are being revitalized, as shown throughoutthis <strong>Annual</strong> <strong>Report</strong>. We have assembled the individual strengthsof our businesses into one strong <strong>Enerflex</strong> team.Business processes and structures are not particularly interesting topics, but if they arenot sound, even good people struggle to perform to their fullest capabilities. Importantchanges have been made to our business structure to enhance performance:• Each of our businesses now has its own vice-president or general manager.In <strong>2003</strong>, responsibility for our Service business segment was split to sharpen ourfocus on customers, suppliers and employees. Our Syntech electrical,instrumentation and controls business and our Mechanical Service businessnow operate under their own leadership. Each of these two businessesgenerates annual sales well in excess of $120 million and has uniquecharacteristics that require focused, specific attention.• Over the past 20 years, our businesses have earned strong reputations forquality and service under various brand names. Not only are the distinct brandnames well known and respected by customers, but our employees take greatpride in their business unit’s first class reputations. All of our brands – Syntech,Pamco, Gas Drive Systems, Landré Ruhaak, Presson, Mactronic, EFXCompression, Compression Services, Jiro, Jiro Service, Power, and Leasing – arebeing revitalized, as shown throughout this <strong>Annual</strong> <strong>Report</strong>. We have assembledthe individual strengths of our businesses into one strong <strong>Enerflex</strong> team.• A key philosophy at <strong>Enerflex</strong> is that each of our businesses should haveresponsibility for pre-tax earnings and have control over the factors that driveearnings. As part of our restructuring, certain functions that had been directedfrom the corporate office, such as marketing, have been distributed to operatingunits to increase their control and to reinforce the concept that each businessunit is accountable for its own performance.<strong>Enerflex</strong> <strong>2003</strong> <strong>Annual</strong> <strong>Report</strong>14
<strong>Enerflex</strong> operates in a very competitive business environment. To be successful, the Company must deliver qualityproducts and services while remaining price competitive. We are committed to streamlining processes in the office,on the shop floor and in the field to continuously improve efficiency while enhancing financial and operationalcontrols. We are also committed to developing improved products, like EFX Compression’s Gen III compressorpackage and Syntech’s proprietary control technology, which provide benefits to our customers and createcompetitive advantages for your Company.Management and our employees would like to thank our Board of Directors and shareholders for the direction andencouragement that have been offered over the past year. Your support for our initiatives to strengthen theCompany’s foundation and build for the future is gratefully appreciated.Yours sincerely,(signed)P. John AldredChairman, Presidentand Chief Executive OfficerFebruary 2, 2004<strong>Enerflex</strong> <strong>2003</strong> <strong>Annual</strong> <strong>Report</strong>15
The right people in the right places.<strong>Enerflex</strong> is one of the pre-eminent employers of westernCanada's large pool of skilled tradespeople.<strong>Enerflex</strong> <strong>2003</strong> <strong>Annual</strong> <strong>Report</strong>16
<strong>Enerflex</strong> Systems Ltd. is a leading provider of products and services to theglobal oil and gas production industry. The Company is headquartered inCalgary, Canada, with operations in Canada, the United States, the UnitedKingdom, the Netherlands, Germany, Australia, and Indonesia.review ofoperations<strong>Enerflex</strong> is organized into three business segments: Service, Fabrication and Leasing.Together, they allow <strong>Enerflex</strong> to provide a complete suite of products and services fromwellhead to pipeline.These products and services are delivered through six operating units, each focused onmeeting a specific area of customer need: Compression, Power, Mechanical Service, Production& Processing, Leasing, and Electrical, Instrumentation & Controls.Cecil WoodQA/QC, HSE SupervisorEFX Compression USAThe six operating units are comprised of 14 divisions, each of which offers unique expertise andknowledge to customers either on a stand-alone basis, or as a powerfully integrated team solution.Management Realignment Brings Re-energizedEntrepreneurial Spirit and Customer FocusAs <strong>2003</strong> began, <strong>Enerflex</strong> concentrated on integrating the operations of its 2002 acquisition ofEnSource Energy Services Inc. The assets, products and services, customers and people gainedfrom EnSource were key to the vision of a Company that can offer complete, turnkey natural gasand oil equipment and services anywhere in the world. As the year progressed, the integrationof these operations and the re-alignment of the management structure was reflected in improvedperformance.A series of key changes in management approach over the course of the year sent well-receivedsignals to customers about the Company’s re-energized entrepreneurial spirit. This began in May<strong>2003</strong> with the return of John Aldred, <strong>Enerflex</strong>’s founder, as President and Chief Executive Officerand primary steward of the Company. The returning CEO emphasized a back-to-basics,<strong>Enerflex</strong> <strong>2003</strong> <strong>Annual</strong> <strong>Report</strong>17
customer-focused philosophy in all areas of the Company. He further set about re-aligning the leadership to reflect afocus on “the right people in the right places.” This included the August appointment of industry veteran BlairGoertzen as Executive Vice-President and Chief Operating Officer and changes to senior management within theoperating units.In the latter half of the year, the rebuilding process began to show results. Bookings in the EFX Compression facilityin Calgary doubled from the second to the third quarter. This was a key indicator of success, as optimalutilization of this world-class fabrication facility is critical to Company profitability.Another important reflection of the renewed entrepreneurial approach was a move to capitalize upon the legacystrengths and brand names of the fourteen divisions of <strong>Enerflex</strong>. Recognizing the unique marketing strengths andreputation of each division within its market and among its customers is creating an increased sense ofaccountability within the divisions. It is also encouraging cross-divisional teamwork and one-stop solutions forcustomers.In October, the Company restructured its Service business segment, with Syntech and Mechanical Servicebecoming independent units. Senior managers were appointed for each. This move recognized the need to properlyfocus upon the unique strategic and operational needs of each of these businesses.The vision of a global wellhead-to-pipeline Company was realized successfully in <strong>2003</strong>, with several majorcross-divisional projects. One such project was a compression-dehydration facility for Centurion PetroleumCorporation in Egypt that included products and services from Presson, EFX Compression, Syntech, Power,Mactronic, and Pamco.<strong>Enerflex</strong> also supplied a liquefied petroleum gas (LPG) plant to PT Wahana Insannugraha in Indonesia. PT WahanaInsannugraha is the builder-operator-owner at Cemera gas plant for Pertamina, Indonesia’s state-owned oil and gascompany. Presson engineered, designed, manufactured, and commissioned a complete natural gas process facilityfor the extraction of LPG and condensate. Syntech provided electrical and instrumentation hardware for the plant.Four gas compressor packages were designed and fabricated by EFX Compression and Pamco assisted withstart-up and commissioning.<strong>Enerflex</strong> <strong>2003</strong> <strong>Annual</strong> <strong>Report</strong>18
Operating Structure<strong>Enerflex</strong> has six operating units. The following section reviews <strong>2003</strong> operations foreach and provides outlooks for 2004.COMPRESSIONThe Compression operating unit is a world-class packager of natural gascompression equipment, engineering and fabricating a complete line ofreciprocating and screw compression packages throughout the five to 6,000horsepower range. In addition, we operate the only stand-alone compressorrefurbishing facility in the industry.<strong>2003</strong> Operational Highlights• Compression completed and shipped 230 compressor packages in <strong>2003</strong>,almost double the number shipped in 2002.• EFX Compression introduced the innovative Gen III A Series compressorpackage, featuring state-of-the-art vibration and force dampening features.36 units were sold by year end.• Management restructuring and the return of key leaders, includingEarl Connors as Vice-President and General Manager and Jagi Singh asVice-President, Sales, to EFX Compression sent strong signals to themarketplace regarding technical excellence and customer service.• Bookings in the EFX Compression facility (in Calgary) doubled from thesecond to the third quarter.• EFX Compression received an order for two of the largest modular (skidmounted)compressor packages ever to be built in North America.• Compression Services (formerly Re-engineered Solutions), an operationwhich focuses on refurbishment of compressor packages, was renamed inthe fall to restore its brand recognition.• Jiro’s revenue for <strong>2003</strong> exceeded expectations, and included entry intointernational markets, with the shipment of a compressor package toPakistan.• EFX Compression USA appointed new, experienced leadership, andexpanded its market reach, winning two major South American projects inthe face of entrenched local competition, and delivering eight compressorpackages, fabricated in the Calgary facility, for a Mexican hydrocarbonproduction facility.<strong>Enerflex</strong> <strong>2003</strong> <strong>Annual</strong> <strong>Report</strong>19
The strengthening of demand for Compression’sproducts and services experienced in the latter halfof <strong>2003</strong> is expected to continue throughout 2004.2004 OutlookThe strengthening demand for Compression’s products and services experienced in the latter half of <strong>2003</strong> isexpected to continue throughout 2004. Perhaps more than other divisions, EFX Compression and CompressionServices are seeing results from the re-alignment of management and the return of an entrepreneurial spirit to theCompany’s activities. Throughout all divisions, 2004 will see a focus upon employee retention and recruitment.Facility utilization remains the key driver for Compression, with signs being positive from both domestic andinternational markets.EFX Compression will re-introduce its BTB “Back-to-Basics” line of standardized products. Combined withcontinuing success with the Gen III A Series, EFX Compression is regaining its industry dominance.Compression Services is implementing a gas plant and compressor optimization program for customers, as wellas for the <strong>Enerflex</strong> lease fleet, that will enhance production, gain efficiencies and reduce operating costs.Compression Services will be reintroducing the Phoenix line of completely refurbished compressor packagescarrying full warranty.The Jiro division will expand its line of standardized screw compressor packages in an effort to consolidate its sub-400horsepower customer base in the Western Canadian Sedimentary Basin and to further penetrate foreign markets.EFX Compression USA will be looking to significantly increase its bookings in 2004. Key markets for sales activitiesinclude specialty and high specification compressor packages in the United States and Latin America. LatinAmerica will yield improved results with the appointment of a dedicated sales representative and key agencyagreements signed with customers in the region.<strong>Enerflex</strong> <strong>2003</strong> <strong>Annual</strong> <strong>Report</strong>20
POWERThe Power operating unit designs and fabricates power generation systems as stand-alone equipment packagesor on a turnkey, installed basis. Our expertise includes co-generation facilities, turbine, Diesel, and gas reciprocatingunits.<strong>2003</strong> Operational Highlights• <strong>Enerflex</strong> Power completed and shipped 18 power generation packages in <strong>2003</strong>.• An exclusive alliance was formed with Dunlop Standard Energy for turbine power plant and co-generationsolutions.• We were selected to provide a 3.3 megawatt turbine for ATCO Electric in Jasper, Alberta.• An 800 kilowatt flare gas-fuelled generator package was installed in central Alberta.• Power was awarded a $2.2 million project involving four generator packages for Tanzania.2004 OutlookAs 2004 begins, Power is implementing reduction in costs to address competitive margin issues in the reciprocatingunit market. With customers’ capital spending anticipated to maintain a steady pace from the last half of <strong>2003</strong>,revenues are expected to be similar in 2004. Presson’s joint venture operation in Pakistan will provide an impetusfor increased penetration in that market.MECHANICAL SERVICEMechanical Service provides field maintenance services, equipment and parts to the oil and gas industry. With over350 highly trained personnel, Mechanical Service operates in Canada as Pamco and Jiro Service, in the UnitedStates as EFX Compression USA, in the Netherlands and Germany as Landré Ruhaak, in Australia as Gas DriveSystems, and in Indonesia at PT Gas Drive Systems Indonesia.<strong>2003</strong> Operational Highlights• Mechanical Service completed 42,829 service assignments, compared to 41,985 in 2002.• Margins were maintained despite reduced demand for parts and preventative maintenance.• Mechanical Service became a distinct operating unit with the appointment of a Vice-President withworldwide responsibility.• Pamco renewed its Waukesha Engine Dresser Inc. distributorship in Canada.• Our international market reach was extended through the establishment of PT Gas Drive Systems Indonesiaand the opening of a new facility in Jakarta.• PT Gas Drive Systems Indonesia benefited from the total <strong>Enerflex</strong> solution approach, assisting with startupand commissioning of the PT Wahana Insannugraha gas plant at Cemera, Indonesia.• Landré Ruhaak gained recognition as full-service provider for co-generation packages through a contract forthe management and maintenance of 285 packages in the Netherlands.<strong>Enerflex</strong> <strong>2003</strong> <strong>Annual</strong> <strong>Report</strong>21
• Jiro Service <strong>2003</strong> revenue increased 25% over 2002, with screwcompressor refurbishment work emerging as an important new source ofrevenue.• Mechanical Service gained a foothold in the United States, with fivemechanics and trucks operating out of Odessa, Texas, supporting equipmentin the Texas - New Mexico region.2004 OutlookMarket conditions are expected to improve. It is anticipated that internationalmarkets, particularly in the Asian Pacific region, will be stronger than those inNorth America. Trends toward reduced maintenance spending, increasedcompetition, and challenges to Waukesha’s market dominance are expected tocontinue.For 2004, the Mechanical Service unit will seek to enhance revenue and marginsby building upon and diversifying supplier relationships to secure competitivedistribution and pricing advantages and to secure new product opportunities.Dedicated sales teams will be focused upon key customers and the unit will lookto expand its international business.Accountability at the division and branch levels of the unit will increase withindividual revenue, cost and operational goals for the year. To combat competitiveencroachment, and in keeping with the overall <strong>Enerflex</strong> philosophy of the “the rightpeople in the right places,” a renewed focus on employee retention and recruitmentwill be a priority for managers.An aggressive Pamco pricing structure is being introduced to our customers in2004 to help mitigate reduced customer spending in the North American marketand to retain and grow market share.Landré Ruhaak will look to capitalize upon its success with full service cogenerationmaintenance to expand the number of units under its care in 2004. Thedivision has plans to expand its reach through Europe, and to further leveragecross-divisional expertise to gain new contracts.Though facing increased competition in its market, Jiro Service anticipatescontinued growth in overhaul and refurbishment work, as demand for lowhorsepower screw compression grows.<strong>Enerflex</strong> <strong>2003</strong> <strong>Annual</strong> <strong>Report</strong>22
Gas Drive Systems will continue to expand its Australian operations in 2004 to better serve its growing customerbase, while focusing on the development of its Indonesian operations. Opportunities for new products that addvalue to our existing offerings will be key in 2004.PRODUCTION & PROCESSINGThis operating unit builds integrated oil and gas production and processing facilities to meet the needs of the crudeoil and natural gas industry around the world. This includes engineering, transportation and field services and flaresystems.<strong>2003</strong> Operational Highlights• Presson maintained its strong brand name for excellence in Canada, where sales were stronger thanexpected.• Our progress in international markets continued with outstanding results in Pakistan and Indonesia. ThroughPresson Descon International Ltd., Presson completed a 12 million standard cubic feet per day sour gasprocessing plant in Pakistan.• Presson established a presence in the Indonesian market with its first LPG (propane/butane mix) plant inthat country.• Mactronic supplied its first major flare systems to the United Arab Emirates and China, and gained significantcontracts in Mexico and Oman.• At year’s end, Presson promoted a talented senior manager to the position of general manager to improveoperational focus.2004 OutlookProduction & Processing growth opportunities on the international scene continue with Presson’s excellent prospectsin Pakistan, its development of a growth plan for Indonesia and continued global diversification. Mactronic is wellpositioned for more contracts in Mexico and the Middle East.The coming year will require a focus on people and expertise to support both domestic and internationalgrowth. There will be significant programs targeted at attracting talent, staff development and training, andemployee retention.<strong>Enerflex</strong> <strong>2003</strong> <strong>Annual</strong> <strong>Report</strong>23
Growth in the lease fleet isexpected to be the largestinvestment opportunity for theCompany in 2004.LEASINGThe <strong>Enerflex</strong> Leasing operating unit offers customers flexible and innovative financing through which companiescan acquire the use of a broad range of gas compression, power generation and process equipment. Leasingoptions include short-term rentals, long-term capital and operating leases and full-service contract operations.<strong>2003</strong> Operational Highlights• Leasing’s performance exceeded plan, with a year-to-year revenue increase of 39%.• 71 units were added to its fleet, closing the year with approximately 300 compressor and power generationunits, totalling 78,000 horsepower.• 55 compression units were sold from its fleet.• Inroads were made into the United States with a 24-month rental arrangement of two compressor units toa major Texas producer.• Rental fleet maintenance and operations were centralized with Jiro Service in Stettler, Alberta to improveoperational efficiency and customer service.2004 Outlook<strong>Enerflex</strong> Leasing expects continued growth in demand for its products in Canada, and plans expansion into theUnited States in markets where lease rates allow for reasonable margin. Growth in the lease fleet is expected tobe the largest investment opportunity for the Company in 2004. Key customer strategies include maintainingequipment in superior ready-to-run condition and developing standardized contracts.ELECTRICAL, INSTRUMENTATION & CONTROLSSyntech provides a comprehensive range of electrical, instrumentation and control technologies, products andservices to the petrochemical, energy, forestry, pulp and paper, mining, and agriculture industries, with over 650staff throughout western Canada.<strong>2003</strong> Operational Highlights• Syntech completed 71,810 service assignments in <strong>2003</strong> and maintained its position as the largest open-shopelectrical, instrumentation and controls contractor in the Western Canadian Sedimentary Basin.• Syntech became a distinct operating unit with the appointment of a Vice-President with worldwideresponsibility.<strong>Enerflex</strong> <strong>2003</strong> <strong>Annual</strong> <strong>Report</strong>24
• Syntech’s Northwest region in northern Alberta and British Columbiadelivered strong performance, with the completion of two large projects forDuke Energy and Blackrock Ventures. Syntech also had solid performancein its Central Alberta and Southern Alberta and Saskatchewan regions.• Syntech was a key player in the PT Wahana Insannugraha gas plant atCemera, Indonesia and a compression-dehydration facility for CenturionPetroleum Corporation in Egypt.• An Original Equipment Manufacturer agreement was signed with Altronic,Inc. to assemble and market Altronic and Exacta-based controls in Canada.• Our cost structure was reduced through the elimination of unprofitableproduct lines, selling our interest in a United Arab Emirates joint venture,closing of our United States branch and relocating several Canadianbranches.2004 OutlookFor 2004, Syntech anticipates commodity prices and drilling activity will remainclose to <strong>2003</strong> levels, resulting in moderate growth in customer spending. This willresult in modest revenue growth. The unit will therefore focus on enhancing itscompetitiveness and significantly increasing operating margins by reducing costs.Initiatives include working with suppliers to reduce material purchasing costs, bettermanagement of inventory and vehicle fleet optimization. Syntech also plans toreduce location costs and increase cross-selling opportunities by co-locating itshead office in <strong>Enerflex</strong>’s Calgary head office building in mid-2004. In addition,Syntech will enhance its industry leadership with the introduction of new andinnovative digitally integrated control panel systems and other automation solutions.<strong>Enerflex</strong> <strong>2003</strong> <strong>Annual</strong> <strong>Report</strong>25
Partnering with the best.Through its various divisions, <strong>Enerflex</strong> is the authorized distributorof Waukesha engines and parts in many regions of the world.<strong>Enerflex</strong> <strong>2003</strong> <strong>Annual</strong> <strong>Report</strong>26
Today’s oil and gas producers are lookingfor complete solutions, with best-in-classproducts and services. <strong>Enerflex</strong> meets thischallenge.Through our ability to provide a full suiteof products and services in an integratedmanner, <strong>Enerflex</strong> offers customers a uniquevalue proposition — the total <strong>Enerflex</strong>solution, anywhere in the world.Teamworkfrom wellhead to pipeline.In <strong>2003</strong>, Centurion Petroleum Corporationentered into a contract with <strong>Enerflex</strong> toprovide a gas processing plant for theSouth El Manzala Development in Egypt.This project is an example of how thedivisions of <strong>Enerflex</strong> work together tomeet customer needs.Rennyarto ChandraSales DirectorPT Gas Drive Systems Indonesia<strong>Enerflex</strong> <strong>2003</strong> <strong>Annual</strong> <strong>Report</strong>27
Centurion Petroleum ProjectCenturion Petroleum Corporation, EgyptDesigned and quarterbacked by the Pressondivision, the Centurion Petroleum project inEgypt’s Nile delta region just south of theMediterranean Sea, brought together theservices of <strong>Enerflex</strong> divisions Presson, EFXCompression, Syntech and Pamco, to build agas processing plant in two phases over aperiod of just 22 weeks. The plant wasdesigned to manifold 40 million standardcubic feet per day of natural gas, atapproximately 1200 psig (pounds per squareinch gauge) from the wells to separationunits. Compression, dehydration and sitemetering were also required before sendingthe gas offsite to the pipeline.<strong>Enerflex</strong> <strong>2003</strong> <strong>Annual</strong> <strong>Report</strong>28
By working together, the <strong>Enerflex</strong> group ofcompanies is able to offer our clientscompletely integrated solutions to fit theiroil and gas production needs.Compression-Dehydration Facility• Presson was responsible for coordinating the design of the site plot plan, pipe racks andinterconnecting piping and equipment foundation design.• In the first phase, Presson designed and supervised installation of all of the necessary equipment fortreatment of the gas to meet sales requirements.• Presson fabricated and supplied all process vessels, piping and valves.• All components for the plant were built as individual packages that could be connected when deliveredto the plant site.• The compressor package was designed by EFX Compression in Calgary. It consists of an Ariel modelJGK/4 reciprocating compressor driven by a Waukesha L7042GSI turbocharged, 12 cylinder natural gasfueledengine, delivering 1,478 horsepower. The components are mounted on a single-piece steel skidand controlled by a model RC2000 control system. The skid-mounted control system was designedand supplied by our Syntech division.• The Syntech division supplied a fully furnished, multi-room modular trailer housing a motor controlcenter, automatic power transfer switch, uninterruptible power supply (UPS) system, programmablelogic controller (PLC) system, and two computer workstations for human-machine interface.• A high pressure vent stack with integral knockout drum utilizing a water seal and manual CO 2 snuffingsystem was fabricated by the Mactronic division at its facility in Red Deer, Alberta.<strong>Enerflex</strong> <strong>2003</strong> <strong>Annual</strong> <strong>Report</strong>33
From wellhead to pipeline, our customers’production is our passion.It is the talent, commitment and passion of the over 1,900 <strong>Enerflex</strong> employees worldwidewho make it possible for <strong>Enerflex</strong> to bring a total solution to projects likethe Centurion Petroleum gas processing plant in Egypt.Our hats off to the <strong>Enerflex</strong> employees who make our customers’ projects successful.They truly create teamwork from wellhead to pipeline.<strong>Enerflex</strong> <strong>2003</strong> <strong>Annual</strong> <strong>Report</strong>34
2930
31 32
Management’sDiscussion &AnalysisDean JonesLeasing Coordinator – Process EquipmentLeasing<strong>Enerflex</strong> <strong>2003</strong> <strong>Annual</strong> <strong>Report</strong>35
The crude oil and natural gas service sector inCanada, where <strong>Enerflex</strong>’s operations are currentlyconcentrated, generally recorded sequentiallystronger results in each quarter of <strong>2003</strong>.management’sdiscussion and analysis<strong>Enerflex</strong> Systems Ltd. is a leading supplier of products and services to the global oil and gas production industry.Our core expertise lies between the wellhead and the pipeline. <strong>Enerflex</strong> provides natural gas compression, powergeneration, and process equipment for either sale or lease, hydrocarbon production and processing facilities,electrical, instrumentation and control services, and a comprehensive package of field maintenance and contractingcapabilities. Through our ability to provide these products and services in an integrated manner, or as stand-aloneofferings, <strong>Enerflex</strong> offers its customers a unique value proposition.Headquartered in Calgary, Canada, the Company has approximately 1,900 employees and operations in Canada,the United States, the United Kingdom, the Netherlands, Germany, Australia, and Indonesia. The Company’scommon shares trade on the Toronto Stock Exchange under the symbol “EFX”.results of operationsThe following discussion and analysis highlights key business results and statistics for <strong>2003</strong> and 2002 and shouldbe read in conjunction with the audited consolidated financial statements and accompanying notes on pages 53to 68 of this <strong>Annual</strong> <strong>Report</strong>. Additional information relating to the Company, including the Company’s <strong>Annual</strong>Information Form, is available on SEDAR at www.sedar.com.Management’s Discussion and Analysis (MD&A) is reviewed and approved by the Company’s Audit Committee atthe end of each quarter. At year-end, the Board of Directors also reviews and approves the MD&A and the auditedconsolidated financial statements.The MD&A contains forward looking statements which are subject to risks,uncertainties and assumptions that are more fully described throughout this MD&A. Actual results may varysignificantly from those expected.The crude oil and natural gas service sector in Canada, where <strong>Enerflex</strong>’s operations are currently concentrated,generally recorded sequentially stronger results in each quarter of <strong>2003</strong> as a result of increased spending by oil andgas producers in a period of high commodity prices. Results in 2002 were weaker as customer spending wasdepressed, particularly in comparison to a very strong 2001.<strong>Enerflex</strong> <strong>2003</strong> <strong>Annual</strong> <strong>Report</strong>36
<strong>2003</strong> revenue$515.5 million2002 revenue$326.7 millionLeasing 4%Leasing 5%Fabrication 37%Fabrication 46%Service 50%Service 58%Consolidated resultsIn 2001 and 2002 <strong>Enerflex</strong> made three acquisitions, the largest of which was EnSource Energy Services Inc.(“EnSource”). Results for <strong>2003</strong> include the operations of EnSource for the entire year, whereas results for 2002include EnSource operations for five and one-half months commencing the date of acquisition, July 18, 2002. In<strong>2003</strong> <strong>Enerflex</strong> concentrated on strengthening the management of each of its businesses and the integration ofEnSource operations. The re-organization of management was substantially complete by the end of the year. In2004, the Company will continue to evaluate and improve its key business processes to ensure that operations areboth efficient and well-controlled.Summary <strong>Annual</strong> Statistics(Thousands, except per share amounts) <strong>2003</strong> 2002 2001Revenue $ 515,528 $ 326,706 $ 375,040Net income 20,383 9,232 22,454Per common share – basic 0.92 0.51 1.51– diluted 0.91 0.51 1.49Cash dividends per common share 0.40 0.40 0.40Total assets 457,674 451,211 222,146Total long-term liabilities $ 63,561 $ 63,458 $ 35,879Summary Quarterly Statistics<strong>2003</strong> 2002(Thousands, except per share amounts) Q4 Q3 Q2 Q1 Q4 Q3 Q2 Q1Revenue $ 144,185 $ 124,153 $ 115,311 $ 131,879 $110,720 $112,046 $ 54,257 $ 49,683Net income 7,217 5,429 3,309 4,428 3,040 2,948 3,214 30Per common share – basic 0.33 0.24 0.15 0.20 0.14 0.14 0.22 0.00– diluted $ 0.32 $ 0.24 $ 0.15 $ 0.20 $ 0.14 $ 0.14 $ 0.22 $ 0.00<strong>Enerflex</strong> <strong>2003</strong> <strong>Annual</strong> <strong>Report</strong>37
Consolidated revenue in <strong>2003</strong> increased by $188.8 million, or 57.8%, compared with 2002 and $140.5 million, or37.5%, compared with 2001. The revenue growth in <strong>2003</strong> resulted principally from the inclusion of a full year ofoperations from EnSource businesses and from an increase in compressor package sales. In 2001, compressionpackage sales were the highest in the Company’s history. Compressor package sales in 2002 were sharply loweras a consequence of lower natural gas production infrastructure spending and a loss of market share. In <strong>2003</strong>,particularly in the second half of the year, revenues rose both as a result of increased capital spending by oil andgas producers and improvement in the Company’s market share.Net income for <strong>2003</strong> increased by 121% to $20.4 million compared with 2002, but was 9.2% lower than in 2001.On a per share basis, <strong>2003</strong> net income increased by 80.4% compared with 2002, and decreased 39.1% comparedwith 2001. Earnings per share reflect the impact of issuing 7.4 million common shares in mid-2002 to effect theEnSource acquisition. Gross margins were 20.2% in <strong>2003</strong>, 21.4% in 2002, and 19.5% in 2001. The movement ingross margins occurs principally because of changing proportions of revenue from fabrication, which tends to havelower margins, and service. Fabrication produced 46.0% of the Company’s revenue in <strong>2003</strong>, 36.7% of revenue in2002 and 62.2% in 2001.Selling, general and administrative (“SG&A”) expensesSG&A expenses were $72.5 million in <strong>2003</strong>, compared with $53.3 million in 2002 and $35.2 million in 2001. Totalcosts have risen over the past two years due to the EnSource acquisition and the addition of internationaloperations. SG&A as a percentage of revenue was 14.1% in <strong>2003</strong>, 16.3% in 2002 and 9.4% in 2001. The Servicebusiness unit generally has higher SG&A as a percent of revenue than the Fabrication business unit due to theservice branch infrastructure. A lower proportion of Fabrication revenues and a higher proportion of Servicerevenues causes SG&A as a percentage of revenue to increase. There was improvement in this ratio in <strong>2003</strong>, butmanagement is focused on reducing the ratio to below 12%. SG&A as a percentage of revenue was 12.6% in thefourth quarter of <strong>2003</strong>. Costs in <strong>2003</strong> include $2.2 million for restructuring of management and head officefunctions, and a $1.2 million provision for a loss on a legacy international contract that is subject to arbitration.A significant portion of management remuneration is at risk based on pre-tax earnings and return on capitalemployed (ROCE). ROCE is a non-GAAP measure that is calculated by dividing the sum of pre-tax earnings plusinterest expense by the sum of total interest-bearing debt plus shareholders’ equity. Management bonus andemployee profit sharing is 10% of pre-tax income when pre-tax ROCE is below 22.5%, and escalates by 0.5% foreach 1% increase in ROCE. A maximum of 15% of pre-tax income is reached when ROCE is 32.5% or higher. Thisplan encourages management to increase earnings while prudently managing capital requirements. In <strong>2003</strong>,ROCE improved to 10.0% compared with 6.9% in 2002. Management bonus and profit sharing included in SG&Awas $3.2 million in <strong>2003</strong> compared with $1.6 million in 2002.<strong>Enerflex</strong> <strong>2003</strong> <strong>Annual</strong> <strong>Report</strong>38
In the last half of <strong>2003</strong>, both industry spending and <strong>Enerflex</strong>market share increased, leading to improved financial results.Fabrication revenue increased by 97.8% in <strong>2003</strong>.Foreign exchangeMost international fabrication work is quoted in U.S. dollars. As the U.S. dollar depreciates, the Company’s Canadiandollar revenue falls. The U.S. dollar depreciated by 18.2% against the Canadian dollar during <strong>2003</strong>. In the first halfof <strong>2003</strong>, <strong>Enerflex</strong> estimates that its fabrication margins were reduced by $1.2 million due to this issue.In mid-<strong>2003</strong>, <strong>Enerflex</strong> initiated a program to mitigate the impact of exchange rate fluctuations by matching expectedfuture U.S. dollar denominated cash inflows with U.S. dollar liabilities, principally bank debt and accounts payable.For example, when <strong>Enerflex</strong> is awarded a U.S.$1 million contract, it converts an equivalent amount of its bank debtfrom Canadian to U.S. dollars. The foreign debt is repaid when <strong>Enerflex</strong> receives payment from its customer. Theresult is that any gain or loss in margins resulting from exchange fluctuations is offset by gains or losses on U.S.dollar liabilities. In <strong>2003</strong>, foreign currency gains were $2.0 million, compared with a nominal loss in 2002. AtDecember 31, <strong>2003</strong>, the Company’s bank debt included U.S.$30.7 million of bank overdrafts and LIBOR loans.<strong>Enerflex</strong> does not hedge its exposure to investments in foreign subsidiaries, which are largely self-sustaining.Exchange gains/losses on net investments in foreign subsidiaries are accumulated in Shareholders’ Equity as a“Cumulative translation adjustment.” The cumulative translation adjustment credit increased from $0.6 million atthe end of 2002 to $1.5 million at the end of <strong>2003</strong> as appreciation in the value of our European and Australiansubsidiaries was partially offset by a reduction in our U.S. subsidiary.Interest costs increased to $5.3 million in <strong>2003</strong>, compared with $3.6 million in 2002 as a result of debt assumedand costs incurred for the acquisition of EnSource. <strong>Enerflex</strong> has benefited from low interest rates as its bank debtis subject to floating rates. However, wider corporate credit spreads in the market, combined with the greaterleverage <strong>Enerflex</strong> carried following the EnSource acquisition, increased the Company’s borrowing margin byapproximately 1.25% in late 2002. The Company pays its lenders a margin over the Canadian bankers’ acceptancerate, or the U.S. LIBOR rate, which varies depending on the ratio of debt to earnings before interest, taxes,depreciation and amortization (EBITDA) for the trailing twelve months. Over the past year, <strong>Enerflex</strong> has substantiallyreduced its debt while increasing EBITDA. As a result, effective September 1, <strong>2003</strong> the margin was reduced by0.5%, to 1.5% on the operating loan and 2.0% on the term loan, and will decline by a further 0.5% when the debtto EBITDA ratio is less than 1.<strong>Enerflex</strong> <strong>2003</strong> <strong>Annual</strong> <strong>Report</strong>39
Income tax expense was $10.8 million in <strong>2003</strong> compared with $5.0 million in the prior year. The increase in taxexpense is a result of higher pre-tax earnings in the current year. The effective rate of income tax in <strong>2003</strong> was34.7%, compared to 35.3% in 2002. Contributing to the change in the effective tax rate was a change in taxestimate relating to the timing of realizing future tax assets and liabilities, which were partially offset by an increasein capital taxes payable in <strong>2003</strong>. The Company expects the effective tax rate in 2004 will continue to be less than 35%with a larger relative proportion being current tax. The utilization of losses in <strong>2003</strong> arising from the EnSource EnergyServices Inc. acquisition in 2002 resulted in a reduction in current taxes otherwise payable for the current year.<strong>2003</strong> income$36.5 million before interest and taxes2002 income$17.9 million before interest and taxesLeasing 35% Fabrication 21%Leasing 35%Service 65%Service 44%(Fabrication income was negative,therefore excluded from above2002 income total.)Segmented resultsFollowing the business combination with EnSource, <strong>Enerflex</strong> established three business segments: Service,Fabrication and Leasing. The business segments are comprised of the following operating units:ServiceSyntech’s electrical, instrumentation and controls business in Canada; and,Mechanical Service businesses in the United States, Canada (Pamco and Jiro), the Netherlands (Landré Ruhaak),Germany (S&L Energie), Australia and Indonesia (Gas Drive Systems);FabricationCompression – <strong>Enerflex</strong> Compression, including manufacturing facilities in Calgary, Alberta and Odessa, Texas, andthe Jiro low-horsepower screw compressor manufacturing facility in Stettler, Alberta;Production & Processing – Presson’s modular natural gas processing facilities manufacturing in Nisku, Alberta,and Mactronic’s waste gas systems design and manufacturing in Red Deer, Alberta;<strong>Enerflex</strong> <strong>2003</strong> <strong>Annual</strong> <strong>Report</strong>40
Compression Services (formerly known as Re-engineered Solutions) – re-engineering and refurbishment ofexisting compression equipment both in a Calgary facility and at customer field locations; and,Power – power generation equipment fabrication in our main Calgary manufacturing facility;LeasingCompression, power generation, and natural gas processing equipment rentals, primarily in Canada.ServiceThe Service business segment provides a complete line of mechanical, and electrical, instrumentation and control(“EI&C”) services to the oil and gas industry through an extensive branch network in Canada, as well as operationsin the United States, the United Kingdom, the Netherlands, Germany, Australia, and Indonesia. Responsibility forCompression Services was transferred to Fabrication in the third quarter of <strong>2003</strong> and comparative figures have beenreclassified. Service is the Company’s largest business segment, employing 55% of our staff and generating halfof the Company’s revenue. Key performance metrics include labour utilization, top line revenue, gross marginpercentages, and general and administrative costs as a percentage of revenue.Through its various divisions, <strong>Enerflex</strong> is the authorized distributor for Waukesha engines and parts in Canada,Australia, Indonesia, Papua New Guinea, the Netherlands,Germany, and Spain. Mechanical Service revenues tend to befairly stable as equipment maintenance is required regardlessof the commodity price cycle.return onaverage equitypercent52.3 33.9 27.6 32.9 24.1 11.9 10.9 20.2 4.9 7.6Mike McKintyOperations ManagerMactronic94 95 96 97 98 99 00 01 02 03<strong>Enerflex</strong> <strong>2003</strong> <strong>Annual</strong> <strong>Report</strong>41
Service revenue was $256.4 million in <strong>2003</strong>, compared with$191.0 million in 2002. Mechanical Service and Syntech eachcontributed approximately half of the revenue generated by ourService business segment in <strong>2003</strong>.Syntech’s revenues are more cyclical as revenue is generated from both maintenance spending and from newinfrastructure investment.(Thousands) <strong>2003</strong> 2002Segment revenue $ 269,036 $ 193,578Intersegment revenue (12,618) (2,570)External revenue $ 256,418 $ 191,008Income before interest and taxes $ 15,882 $ 14,527Service revenue was $256.4 million in <strong>2003</strong>, compared with $191.0 million in 2002. Mechanical Service andSyntech each contributed approximately half of the revenue generated by our Service business segment in <strong>2003</strong>.However, approximately 70% of income before interest and taxes was earned by Mechanical Service. While thetwo operating units share common characteristics, the Company determined that separate management isrequired to properly address the strategic and operating matters that are unique to each business. The change inmanagement structure took effect on October 1, <strong>2003</strong> and had a positive impact on results in the fourth quarterof the year.Mechanical Service revenues for <strong>2003</strong> were consistent with the prior year. In North America, which accounted for69.6% of revenue, sales decreased by 1.1% from 2002. Activity levels were low at the beginning of the year, butincreased as the year progressed. Customers are tending to increase the number of hours their equipmentoperates before performing maintenance, which has reduced demand for both parts and service. <strong>Enerflex</strong> has offseta reduction of sales in its historical markets with the addition of Jiro Service in mid-2002, as part of the EnSourceacquisition, the initiation of service operations in the United States, and the acquisition in late 2001 of LandréRuhaak in the Netherlands. Gross margins for Mechanical Service were equivalent to the prior year, but increasedSG&A associated with new operations reduced income before interest and taxes by $1.6 million. Mechanicalservice is focused on increasing income before interest and taxes as a percentage of revenue through enhancedcustomer relationships and vigilant cost control.The Syntech operating unit realized improved results in the last half of <strong>2003</strong>. Syntech generated revenue of $124.3million in <strong>2003</strong> compared with $68.2 million in the five and one-half months of 2002 following the EnSourceacquisition. This business is highly competitive. Low margins, compared with Mechanical Service, and the cost of<strong>Enerflex</strong> <strong>2003</strong> <strong>Annual</strong> <strong>Report</strong>42
maintaining a branch infrastructure throughout Alberta, Saskatchewan and northeast British Columbia resulted inlow earnings before interest and taxes in both 2002 and <strong>2003</strong>. Syntech has worked to strengthen its business by:• Eliminating a number of unprofitable lines of business at the end of the first quarter of <strong>2003</strong>;• Relocating several Canadian branches, and closing a small U.S. branch;• Selling its interest in a United Arab Emirates joint venture in the third quarter for proceeds of $1.6 millionand a gain on sale of $0.2 million; and,• Building a Syntech management team that is focused solely on building a profitable electrical,instrumentation and controls business in western Canada.Syntech plans to cut costs and increase cross-selling opportunities by co-locating its head office in <strong>Enerflex</strong>’s headoffice building in Calgary in the second quarter of 2004.FabricationThe Fabrication business segment engineers and assembles standard and custom-designed compressionpackages, production and processing equipment and facilities, and power generation systems. The key performancedrivers for this business segment are market share and plant utilization. Plant overhead costs, which are chargedto jobs at a fixed rate per labour hour, are over-absorbed and credited to cost of sales in periods of high activity,and under-absorbed and charged to cost of sales in periods of low activity. This has a significant impact on marginsover the course of a business cycle.(Thousands) <strong>2003</strong> 2002Segment revenue $ 259,715 $ 136,901Intersegment revenue (22,801) (17,140)External revenue $ 236,914 $ 119,761Income before interest and taxes $ 7,758 $ (4,325)The Fabrication business tends to have more volatility in revenue and income before interest and taxes than<strong>Enerflex</strong>’s other business segments. Revenues are derived primarily from infrastructure investment by natural gasproducers. Capital spending was high in 2001, but dropped sharply in 2002 and early <strong>2003</strong>. The impact of thedecrease in industry investment was magnified by a loss of compressor package market share.In the last half of <strong>2003</strong>, both industry spending and <strong>Enerflex</strong> market share increased, leading to improved financialresults. Fabrication revenue increased by 97.8% in <strong>2003</strong> as a result of increased compression sales and theinclusion of a full year of operations of Presson, Mactronic and Jiro. While definitive market share data is difficultto obtain, <strong>Enerflex</strong> estimates that its Canadian large horsepower compressor package market share doubled in thelast half of the year compared to early <strong>2003</strong>. This was largely due to the introduction of a significantly improvedproduct, the Gen III compressor package, which resulted in sales of $47 million for 36 units, including 4 units sold<strong>Enerflex</strong> <strong>2003</strong> <strong>Annual</strong> <strong>Report</strong>43
Fabrication revenue increased by 97.8% in <strong>2003</strong> as a resultof increased compression sales and the inclusion of a full yearof operations of Presson, Mactronic and Jiro.to the Company’s Leasing business for $4.2 million. The compression operating unit’s goal in 2004 is to extend thissuccess into its other reciprocating and screw compressor products.Notwithstanding continued strong competition in our markets, Fabrication gross margins improved in <strong>2003</strong>as higher shop utilization enabled the Company to fully apply overheads to projects. Revenues and margins onU.S. dollar-denominated jobs were reduced by approximately $3 million in <strong>2003</strong> as a result of the 18.2% declinein the U.S. dollar over the course of the year. This has been partially offset by exchange gains on U.S. debt,as more fully described in the foreign exchange section of this report. Income before interest and taxes in <strong>2003</strong>was also reduced by approximately $2 million of bad debt and warranty provisions for two projects completedin prior years. The resolution of such legacy issues, combined with management’s commitment to improve projectexecution, from proposal through delivery and start-up, provide the opportunity for continued improvements inearnings in 2004.In prior years, the Compression and Power operating units followed the policy of recording revenue upon substantialtechnical completion of a project (the “completed project” method), while the Production and Processing operatingunit followed the percentage of completion method. The completed project method can result in large fluctuationsin earnings when large projects are being undertaken, because revenue and cost of sales are not recognized in thestatement of income until the project is substantially complete. As the Company expects that large, turnkeyprojects will provide an increasing proportion of revenue, the percentage of completion method of revenuerecognition was adopted throughout our Fabrication business segment in <strong>2003</strong>. This change in accounting policyis described in Note 1 to the financial statements.<strong>Enerflex</strong> <strong>2003</strong> <strong>Annual</strong> <strong>Report</strong>44
LeasingOur Leasing business segment provides a variety of leasing and rental alternatives for gas compression, powergeneration and natural gas processing equipment. At the end of <strong>2003</strong> the <strong>Enerflex</strong> lease fleet was comprised ofapproximately 300 compressor and power generation units, with 78,000 horsepower. The key performance driversin this business are the fleet utilization and rental rates. The Company’s lease fleet is located principally in westernCanada. Expansion into the United States is planned, but is being done on a selective basis as lease rates forstandard equipment in that market are low.(Thousands) <strong>2003</strong> 2002Segment revenue $ 22,281 $ 15,943Intersegment revenue (85) (6)External revenue $ 22,196 $ 15,937Income before interest and taxes $ 12,864 $ 7,717Capital expenditures, net of proceeds on disposal $ 9,888 $ 7,297Revenue in <strong>2003</strong> increased by 39.3% to $22.2 million compared with $15.9 million in the prior year. The increaseresults from including a full year of Jiro compressor rentals, and higher equipment utilization rates. Historically,utilization rates approximated 85%, while in the last half of 2002 utilization fell below 80% and remained near 80%through the first half of <strong>2003</strong>. Over the last half of <strong>2003</strong> utilization rates improved steadily to exit the year above 85%.In <strong>2003</strong>, Leasing sold 55 compression units from its fleet, for gross proceeds of $11.0 million and a gain on saleof $2.0 million. The sale of units generally occurs when customers exercise their contractual option to purchasethe equipment. Gains on sale in <strong>2003</strong> were larger than usual, particularly in the first quarter of the year, and arenot expected to continue at that level in 2004. To satisfy growing demand for leased compression, <strong>Enerflex</strong> added71 units to its fleet in <strong>2003</strong>, mainly in the last half of the year, for an investment of $22.5 million. This turnover ofassets renews the fleet, resulting in an average fleet age of less than five years.Leasing expects continued growth in demand for its products in Canada, and has targeted specific geographicregions for expansion in the United States. Leasing does not increase the capital invested in its fleet unless it has leasecontracts. Growth in the lease fleet is expected to be the largest investment opportunity for the Company in 2004.The leasing business is a significant contributor to earnings, despite its low proportion of overall company revenue.In addition, <strong>Enerflex</strong> Leasing makes our other business segments stronger. Leasing is a significant customer of ourcompression fabrication business, as almost all of its equipment is purchased from Fabrication. Service alsobenefits because the majority of Leasing customers use Pamco and Jiro to perform routine maintenance over thelease term.<strong>Enerflex</strong> <strong>2003</strong> <strong>Annual</strong> <strong>Report</strong>45
Accounting practices in the compression leasing business vary significantly from company to company. Keyaccounting policies followed by our equipment leasing business are as follows:• All equipment and related debt are recorded on the balance sheet. No equipment is in special purposeentities. There is no “off-balance sheet” debt.• Compression equipment is depreciated over its useful life, which has been estimated to be approximately14 years. Depreciation expense is recorded regardless of whether the equipment is in service or idle.• When, under the terms of a rental contract, the Company is responsible for maintenance and overhauls, theexpense is accrued monthly to match maintenance expense with the related revenue. Maintenance andoverhaul costs incurred are charged to the accrued maintenance liability and are not capitalized.Financial condition and liquidity<strong>Enerflex</strong> generated cash flow from operations, before changes in non-cash working capital, of $34.9 million in <strong>2003</strong>,compared with $22.7 million in 2002. After changes in non-cash working capital, cash flow from operations was$34.1 million in <strong>2003</strong> and $36.3 million in 2002. Cash generated funded a reduction in debt, net of cash, of $19.9million, $3.7 million of net additions to rental assets and dividends to our shareholders of $8.9 million. In 2002operating cash flow was favorably impacted by a $13.6 million reduction of non-cash working capital. In <strong>2003</strong>, noncashworking capital from operations increased by $0.8 million as a result of a $31.1 million increase in accountsreceivable, offset by a $25.3 million decrease in inventory, income taxes receivable and assets held for sale, andan $8.1 million increase in accounts payable. The increase in receivables reflects a combination of stronger salesin <strong>2003</strong> and the impact of our accommodating customer requests to defer payments for compression equipmentinto 2004. <strong>Enerflex</strong> expects to reduce its working capital requirements in 2004.cash flow from operations$ millions14 12 16 30 2 5 16 29 36 3450quarterly revenue$ millions54112 111 132 115 124 14494 95 96 97 98 99 00 01 02 03Q1 Q2 Q3 Q4 Q1 Q2 Q3 Q42002 <strong>2003</strong><strong>Enerflex</strong> <strong>2003</strong> <strong>Annual</strong> <strong>Report</strong>46
In the first half of 2002 the Company purchased 71,600 common shares for a total cost of $1.4 million pursuantto its Normal Course Issuer Bid. In the last half of 2002 and in <strong>2003</strong> <strong>Enerflex</strong> did not purchase common shares andthe issuer bid terminated in July <strong>2003</strong>. Subsequent to the acquisition of EnSource, <strong>Enerflex</strong> has directed themajority of cash generated from operations and asset sales to repay debt. On February 2, 2004 the Company had22,227,188 common shares outstanding.The acquisition of EnSource in July of 2002 was effected by issuing 7.4 million <strong>Enerflex</strong> common shares and theassumption of EnSource debt, as shown in Note 2 to the financial statements. Following the acquisition of EnSource,the Company established new bank credit facilities. The Credit Agreement provides for a $100 million revolvingoperating facility and a $75 million extendible revolving term loan facility. The availability of the operating facility issubject to a monthly borrowing base calculation which considers eligible accounts receivable and inventories.Under the term loan facility <strong>Enerflex</strong> has drawn $68.4 million. If the term loan is not extended at the end of its term,which is extendible at the banks’ option on June 30 of each year, it will be repayable in 24 equal consecutive monthlyprincipal installments. The loans are secured by a first floating charge over all of the assets of the Company, andrequire the Company to meet certain covenants, including a limitation on the debt to EBITDA ratio. <strong>Enerflex</strong> was infull compliance with these covenants at December 31, <strong>2003</strong>. These credit facilities provide the financing requiredto support our operating requirements, as well as the flexibility to pursue growth opportunities.On January 31, <strong>2003</strong>, <strong>Enerflex</strong> sold the assets of its surface drilling equipment rental business, Canadian SelectEnergy West. This business did not align with the Company’s core expertise of delivering products and servicesbetween the wellhead and major pipeline transportation systems. Proceeds from the divestiture of approximately$6.0 million, including working capital, were applied to reduce bank indebtedness.Contractual obligations and committed capital investmentThe Company’s contractual obligations at December 31, <strong>2003</strong>, assuming that the extendible revolving term loanfacility is renewed on June 30, 2004, were as follows:Contractual ObligationsPayments due by period(Thousands) Less than one year 1- 3 years 4-5 years Thereafter TotalLeases $ 7,079 $ 10,194 $ 2,524 $ 4,868 $ 24,665Purchase obligations 1,243 692 – – 1,935Total $ 8,322 $ 10,886 $ 2,524 $ 4,868 $ 26,600<strong>Enerflex</strong> <strong>2003</strong> <strong>Annual</strong> <strong>Report</strong>47
The majority of the Company’s lease commitments are operating leases for Service vehicles.The majority of the Company’s purchase commitments relate to long term information technology andcommunications contracts entered into in order to reduce the overall costs of services received.In addition to the contractual obligations above, the Company is committed to capital investment of $2.3 million in2004. Of that, $1.0 million relates to the construction of a larger facility in Syntech’s northwestern Albertaoperations; $0.7 million for the expansion of office space at the Company’s Nisku operation, due to increasingbusiness volumes and $0.3 million relates to software investments.Other accounting mattersGoodwillThe Company acquired three businesses in 2001 and 2002, in accordance with its strategic objectives of expandinginternationally and into complementary lines of business. <strong>Enerflex</strong> allocated the excess of the purchase priceover the value attributed to net tangible and intangible assets to goodwill. The book value of goodwill atDecember 31, <strong>2003</strong> is $112.5 million, of which $104.9 million arose from the EnSource acquisition, and has beenallocated to each of the Company’s three business segments. Goodwill is assessed for impairment at least annually.It has been determined that there is no impairment in the value of goodwill in any of our business segments.Stock Options<strong>Enerflex</strong> has a practice of granting options to management and directors once per year at market prices. Stockoptions are a long-term incentive and employees benefit only if shareholders also realize appreciation in the valueof their investment. <strong>Enerflex</strong> measures compensation cost based on the intrinsic value of the award on the datethe options are granted. Accordingly, as the exercise price and the market price on the grant date are equal, no stockoption compensation cost has been recognized. In 2004, <strong>Enerflex</strong> will adopt the fair value method of accountingfor stock options. Had the new accounting policy been in place in <strong>2003</strong>, net income would have been reduced by$0.2 million. Adoption of the policy will result in a reduction of retained earnings of $0.7 million on January 1, 2004.The Company estimates that stock option expense will approximate $0.6 million in 2004. Details concerning ouraccounting policy and assumptions are shown in the notes to our financial statements.Asset Retirement ObligationsThe Canadian Institute of Chartered Accountants has issued new recommendations for accounting for AssetRetirement Obligations. The recommendations, which become effective in 2004, are not expected to have asignificant impact on the Company’s financial statements.<strong>Enerflex</strong> <strong>2003</strong> <strong>Annual</strong> <strong>Report</strong>48
<strong>Enerflex</strong> is a market leader in Canada and maintains anextensive branch network, as proximity to customer locationsis key to earning business.Outlook for markets and competitionAs a Canadian-based provider of equipment and services to the global oil and gas industry, <strong>Enerflex</strong>’s businessprospects are influenced by several market factors. These include the business outlook for oil and gas producers,prospects for natural gas infrastructure development, as well as the business outlook and competitive environmentwithin the natural gas compression industry.Industry outlook – oil and gas producersWhile <strong>Enerflex</strong> continues to build its international presence, the Company’s fortunes are largely tied to naturalgas capital and operating expenditures in western Canada. Almost 20,000 wells were completed in <strong>2003</strong>, ofwhich approximately 70% were natural gas wells. In 2004, industry analysts forecast that capital expenditureson plant and equipment will remain strong, but lower than in <strong>2003</strong>. Many forecasters expect that, in theabsence of significant discoveries, North American conventional natural gas production will decrease. Sustainingor increasing production volumes is progressively more dependent upon development of tight gas and coal bedmethane, both of which require more compression than traditional reservoirs, and expansion in frontier regionssuch as the Northwest Territories. Higher natural gas prices than thoseexperienced in the 1990s will be required to support gas development inthese areas.Crude Oil (WTI US$/barrel)Natural Gas (AECO “C” Hub C$/mcf)oil & naturalgas pricesaverage30.2925.91 26.1531.03Boh McLeanBranch ManagerSyntech5.59 5.774.116.2600 01 02 03<strong>Enerflex</strong> <strong>2003</strong> <strong>Annual</strong> <strong>Report</strong>49
Competitive issues in the oil and gas service industryAlthough the Canadian market continues to have distinct differences from the United States market, it is clear thata single North American market is developing. For this reason, investors should be aware of certain competitiveissues in Canada, the United States and overseas markets.CanadaThe Canadian production and processing equipment and compressor packaging markets are very competitive.Several fabricators target the same customers as <strong>Enerflex</strong>, and fabrication floor space is not a constraint. To besuccessful, the Company must compete based on quality and service while remaining price competitive.A number of new competitors have emerged to both our Syntech electrical and Pamco mechanical servicebusinesses. <strong>Enerflex</strong> is a market leader in Canada and maintains an extensive branch network, as proximity tocustomer locations is key to earning business. Pamco has a competitive advantage as the authorized Waukeshadistributor. Syntech does not have exclusive distributorships, but has developed proprietary control technology tohelp differentiate its business from the competition.While more compression equipment is being rented each year in Canada, only about 5% of the existing populationof compression equipment in Canada, measured by horsepower, is rented. The remaining 95% is owned byproducers. <strong>Enerflex</strong> is a leader in the rental industry, supplying an estimated 25% of the Canadian market(calculated by horsepower).United StatesThere are only two major competitors in the U.S. compression fabrication business. We believe that the U.S. marketprovides <strong>Enerflex</strong> with a strong opportunity to expand our business, which led to our 2002 acquisition of the assetsof EFX Compression USA, a specialty natural gas compression equipment packager in Odessa, Texas. <strong>Enerflex</strong>strengthened the management of its U.S. subsidiary in <strong>2003</strong> to capitalize on this opportunity.In the United States there is no dominant service provider such as <strong>Enerflex</strong>. In <strong>2003</strong>, <strong>Enerflex</strong> used its Odessa,Texas facility as a platform to establish a service business in this large, fragmented market. The Company plans toextend its mechanical service capability into the Rocky Mountain region in 2004.The United States market continues to be more heavily weighted towards compression rentals than theCanadian market. Approximately 30% of the United States market is served by rental compression equipmentwhile 70% is owned by producers and pipeline companies. Rental rates are low in the United States as therehas been a surplus of available equipment. <strong>Enerflex</strong> plans to compete in certain niche markets where returnson capital are appropriate.<strong>Enerflex</strong> <strong>2003</strong> <strong>Annual</strong> <strong>Report</strong>50
InternationalInternationally, we face the same competitors as in North America. Most significant North American productionequipment and compression fabricators pursue international business. International contacts developed by Pressonand Mactronic over the past ten years have increased the Company’s exposure to international opportunities.Through our Australian subsidiary, Gas Drive Systems, expansion into Indonesia, and the acquisition of LandréRuhaak in late 2001, <strong>Enerflex</strong> has become a significant player in the international service market.<strong>Enerflex</strong> is not actively pursuing leasing business outside of North America.Business risksWhile demand for <strong>Enerflex</strong>’s product and services is largely a function of supply, demand and price of natural gas,many other factors can affect the fortunes of the business either positively or negatively. <strong>Enerflex</strong> encourages allinvestors to read and be aware of business risks and the Company’s response to them.PersonnelQualified and motivated personnel are critical to the success of our businesses. There are few barriers to entry ina number of our businesses, so retention of staff is essential.Markets and operationsEnergy prices affect <strong>Enerflex</strong>, as the majority of our customers generate cash flow from both crude oil and naturalgas. The prices for these commodities are determined by supply, demand, government regulations relating tonatural gas production and processing, and international political events. In common with commodity prices, themarket for capital goods required by our customers is both cyclical and, at times, highly volatile.Foreign exchange<strong>Enerflex</strong>, a Canadian company, is exposed to foreign exchange risk when it buys or sells goods or services in foreigncurrencies. The company manages most of this inherent risk through a variety of contractual means, but currencyrisk cannot be eliminated entirely. <strong>Enerflex</strong> has material foreign subsidiaries in Australia, the Netherlands and theUnited States, which expose the Company to changes in the exchange rates for the Australian dollar, Euro, and U.S.dollar, respectively.The cyclical nature of the energy industry<strong>Enerflex</strong> is structured to be profitable in both high and low periods of the energy cycle. This is done through productbreadth, international diversification and access to a variety of equipment financing methods. Since becoming apublic company in 1993, <strong>Enerflex</strong> has generated positive cash flow even in challenging times.<strong>Enerflex</strong> <strong>2003</strong> <strong>Annual</strong> <strong>Report</strong>51
Qualified and motivated personnel are critical tothe success of our businesses.Foreign operations<strong>Enerflex</strong> sells products and services throughout the world. While this diversification is desirable, it can expose theCompany to risk related to issues such as quality of receivables. The Company mitigates this risk by dealing withcredit-worthy institutions, and using credit insurance and letters of credit where appropriate.Distribution agreementsOne of the Company’s strategic assets is its distribution and Original Equipment Manufacturer (“OEM”)agreements with leading manufacturers, notably the Waukesha engine division of Dresser Industries, for enginesand parts, and Ariel Corporation for compressors. <strong>Enerflex</strong> and its people make it a priority to maintain andenhance these strategic relationships.Insurance<strong>Enerflex</strong> carries insurance to protect the Company in the event of the destruction or damage to its property andequipment. Liability insurance is also maintained at prudent levels to limit exposure to unforeseen incidents. Anannual review of insurance coverage is completed to assess the risk of loss and risk mitigation alternatives.Extreme weather conditions and terrorist activity have strained insurance markets leading to substantial increasesin insurance costs and limitations on coverage.Climatic factorsIn North America, cold winters typically increase demand for and the price of natural gas, which increasescustomers’ cash flow and can have a positive impact on <strong>Enerflex</strong>. Warm winters in western Canada, however, canboth reduce demand for natural gas and make it difficult for producers to reach well locations. This restricts drillingand compression operations and negatively impacts <strong>Enerflex</strong>.Seasonal demandDemand for natural gas production equipment and services, and hence <strong>Enerflex</strong> business prospects, are influencedby seasonal demand. The first quarter of the year is generally accompanied by increased winter deliveries ofequipment. Service is more active in the summer as producers overhaul equipment when natural gas prices tendto be lower.Environment<strong>Enerflex</strong> regularly conducts third-party environment audits to ensure that environmental issues do not materiallyaffect financial condition or performance.February 2, 2004<strong>Enerflex</strong> <strong>2003</strong> <strong>Annual</strong> <strong>Report</strong>52
management’s responsibilityfor financial informationTo the Shareholders of <strong>Enerflex</strong> Systems Ltd. The accompanyingconsolidated financial statements and all information in the <strong>Annual</strong><strong>Report</strong> have been prepared by management and approved by the Board ofDirectors. The consolidated financial statements have been prepared inaccordance with generally accepted accounting principles in Canada and,where appropriate, reflect management's best estimates and judgements.Management is responsible for the accuracy, integrity and objectivity of theconsolidated financial statements within reasonable limits of materiality and forthe consistency of financial data included in the text of the <strong>Annual</strong> <strong>Report</strong> withthat in the consolidated financial statements.To assist management in the discharge of these responsibilities, the Companymaintains a system of internal controls designed to provide reasonableassurance that accounting records are reliable and assets are safeguarded.The Audit Committee is appointed by the Board of Directors. The AuditCommittee meets with management, as well as with the external auditors tosatisfy itself that management is properly discharging its financial reportingresponsibilities and to review the consolidated financial statements and theauditors' report. The Audit Committee reports its findings to the Board ofDirectors for consideration in approving the consolidated financial statementsfor presentation to the shareholders. The external auditors have direct accessto the Audit Committee of the Board of Directors.The consolidated financial statements have been audited independently byDeloitte & Touche LLP on behalf of the shareholders, in accordance withgenerally accepted auditing standards. Their report outlines the nature of theiraudits and expresses their opinion on the consolidated financial statements.(signed)P. John AldredChairman, President andChief Executive OfficerFebruary 2, 2004<strong>Enerflex</strong> <strong>2003</strong> <strong>Annual</strong> <strong>Report</strong>53
auditors’ reportTo the Shareholders of <strong>Enerflex</strong> Systems Ltd. We have audited theconsolidated balance sheets of <strong>Enerflex</strong> Systems Ltd. as at December31, <strong>2003</strong> and 2002 and the consolidated statements of income, retainedearnings and cash flows for the years then ended. These financial statementsare the responsibility of the Company's management. Our responsibility is toexpress an opinion on these financial statements based on our audits.We conducted our audits in accordance with Canadian generally acceptedauditing standards. Those standards require that we plan and perform an auditto obtain reasonable assurance whether the financial statements are free ofmaterial misstatement. An audit includes examining, on a test basis, evidencesupporting the amounts and disclosures in the financial statements. An auditalso includes assessing the accounting principles used and significantestimates made by management, as well as evaluating the overall financialstatement presentation.In our opinion, these consolidated financial statements present fairly, in allmaterial respects, the financial position of the Company as at December 31,<strong>2003</strong> and 2002 and the results of its operations and its cash flows for the yearsthen ended in accordance with Canadian generally accepted accountingprinciples.(signed)Deloitte & Touche LLPChartered AccountantsCalgary, AlbertaFebruary 2, 2004<strong>Enerflex</strong> <strong>2003</strong> <strong>Annual</strong> <strong>Report</strong>54
consolidated balance sheetsDecember 31(Thousands) <strong>2003</strong> 2002AssetsCurrent assetsCash $ 6,741 $ 5,027Accounts receivable 120,432 89,327Inventory (Note 3) 71,162 81,241Income taxes receivable – 5,905Assets held for sale (Note 6) – 4,591Future income taxes (Note 13) 4,065 9,470Total current assets 202,400 195,561Rental equipment (Note 4) 71,810 68,092Property, plant and equipment (Note 5) 65,032 70,309Future income taxes (Note 13) 2,748 1,907Intangible assets 3,231 2,815Goodwill 112,453 112,527$ 457,674 $ 451,211Liabilities and Shareholders’ EquityCurrent liabilitiesOperating bank loans (Note 7) $ 27,627 $ 45,254Accounts payable and accrued liabilities 70,163 62,112Income taxes payable 4,683 -Future income taxes (Note 13) – 2,235Current portion of long-term debt (Note 7) 17,097 17,250Total current liabilities 119,570 126,851Long-term debt (Note 7) 51,289 51,750Future income taxes (Note 13) 12,272 11,708183,131 190,309Guarantees, commitments and contingencies (Note 12)Shareholders’ equityShare capital (Note 8) 176,928 176,589Cumulative translation adjustment 1,501 595Retained earnings 96,114 83,718274,543 260,902$ 457,674 $ 451,211See accompanying Notes to the Consolidated Financial Statements.On behalf of the Board:(signed)(signed)P. John Aldred, Director Michael A. Grandin, Director<strong>Enerflex</strong> <strong>2003</strong> <strong>Annual</strong> <strong>Report</strong>55
consolidated statements of incomeYear ended December 31(Thousands, except share amounts) <strong>2003</strong> 2002Revenue (Note 1) $ 515,528 $ 326,706Cost of goods sold 411,569 256,929Gross margin 103,959 69,777Selling, general and administrative expenses 72,499 53,348Foreign currency (gains) losses (1,985) 2Gain on sale of assets (3,059) (1,492)Income before interest and taxes 36,504 17,919Interest 5,280 3,641Income before income taxes 31,224 14,278Income taxes (Note 13) 10,841 5,046Net income $ 20,383 $ 9,232Net income per common share – basic (Note 9) $ 0.92 $ 0.51– diluted $ 0.91 $ 0.51Weighted average number of common shares 22,212,700 18,166,000consolidated statements of retained earningsYear ended December 31(Thousands) <strong>2003</strong> 2002Retained earnings, beginning of year $ 83,718 $ 83,089Adjustment to retained earnings (Note 1) 900 –Net income 20,383 9,232Common shares purchasedfor cancellation – (1,181)Stock options purchased – (20)Dividends (8,887) (7,402)Retained earnings, end of year $ 96,114 $ 83,718See accompanying Notes to the Consolidated Financial Statements.<strong>Enerflex</strong> <strong>2003</strong> <strong>Annual</strong> <strong>Report</strong>56
consolidated statements of cash flowsYear ended December 31(Thousands) <strong>2003</strong> 2002Operating ActivitiesNet income $ 20,383 $ 9,232Depreciation and amortization 14,680 12,054Future income taxes 2,877 2,868Gain on sale of assets (3,059) (1,492)34,881 22,662Changes in non-cash working capital (823) 13,64234,058 36,304Investing ActivitiesAcquisition of EnSource Energy Services Inc. (Note 2) – (3,029)Acquisition of assets of VR Systems, Inc. – (4,061)Adjustment of Landré Ruhaak acquisition – (97)Purchase of:Rental equipment (23,682) (17,711)Property, plant and equipment (6,310) (3,325)Proceeds on disposal of:Rental equipment 19,943 9,219Property, plant and equipment 3,538 1,116(6,511) (17,888)Changes in non-cash working capital 952 815(5,559) (17,073)Financing ActivitiesDecrease in operating bank loans (17,627) (16,244)Increase in (repayment of) long-term debt (1,647) 9,940Stock options exercised 339 153Common shares purchased for cancellation – (1,352)Stock options purchased – (31)Dividends (8,887) (7,402)(27,822) (14,936)Changes in non-cash working capital and other 1,037 732(26,785) (14,204)Increase in cash 1,714 5,027Cash, beginning of year 5,027 –Cash, end of year $ 6,741 $ 5,027Supplemental disclosure of cash flow informationInterest paid $ 5,354 $ 3,472Interest received $ 321 $ 322Income taxes paid $ 5,080 $ 15,094Income taxes received $ 6,953 $ 16See accompanying Notes to the Consolidated Financial Statements.<strong>Enerflex</strong> <strong>2003</strong> <strong>Annual</strong> <strong>Report</strong>57
notes to theconsolidated financial statements(Tabular dollar amounts in thousands, except per share or option amounts)summary of accounting policiesThe consolidated financial statements are prepared in accordance with generally accepted accounting principles in Canada.Certain prior year amounts have been reclassified to conform with the current year’s presentation.Incorporation and Basis of Presentation – <strong>Enerflex</strong> Systems Ltd. (the “Company”) is incorporated under the Canada BusinessCorporations Act. The consolidated financial statements include the accounts of <strong>Enerflex</strong> Systems Ltd. and its subsidiaries. Theaccounts of EnSource Energy Services Inc. and its subsidiaries are included from July 19, 2002 (See Note 2).Use of Estimates – The preparation of financial statements requires management to make estimates and assumptions that affectthe reported amounts of assets, liabilities and contingencies at the date of the consolidated financial statements, and revenuesand expenses during the reporting period. Actual results could differ from those estimated. Significant estimates in the financialstatements include percentage of completion of fabrication contracts, allowance for doubtful accounts, depreciation, overhaulaccrual, obsolescence provisions, warranty obligations and commitments and contingencies.Revenue Recognition – Revenues from the design, manufacture and installation of compression and power generationequipment are recorded using the percentage of completion method in <strong>2003</strong> and upon substantial technical completion in 2002(See Note 1). Revenues from the fabrication of production and processing equipment are recognized using the percentage ofcompletion method. Unearned revenue is applied against work in progress for financial statement presentation. Any foreseeablelosses on contracts are charged to operations at the time they become evident. Revenues from parts and service sales arerecorded when goods are shipped and services rendered. Revenue from equipment leases is recorded over the lease term. In<strong>2003</strong> and 2002, substantially all revenue from equipment leases was from operating leases.Inventory – Manufacturing materials are recorded at the lower of cost (principally on the first-in, first-out method) and netrealizable value. Repair parts are recorded at the lower of weighted average cost and net realizable value. Work in progressincludes material, labour and manufacturing overhead, and is recorded net of unearned revenue on a contract by contract basis.Rental Equipment and Property, Plant and Equipment – Rental equipment and property, plant and equipment are recordedat cost. Depreciation is provided using the straight-line method over the estimated useful lives of the various classes of assets:Asset ClassBuildingsEquipmentRental AssetsEstimated Useful Life Range5 to 25 years2 to 20 years5 to 15 yearsMajor renewals and improvements are capitalized. A provision is made in advance for major overhauls on rental equipment. Nodepreciation is provided on assets under construction. Repairs and maintenance costs are charged to operations as incurred.Goodwill – Goodwill represents the excess of the purchase price over the value attributed to net tangible and intangible assetsacquired.Goodwill is assessed for impairment at least annually. The impairment test is based on earnings before interest, taxes,depreciation and amortization using multiples similar to those which would be used to value acquisitions of similar third partybusinesses, having regard to current economic circumstances.Intangible Assets – Intangible assets represent the fair value of distributorship agreements acquired. Management hasdetermined they have indefinite lives and, therefore, intangible assets are not amortized. Intangible assets are assessed forimpairment at least annually.Warranty Obligations – The Company accrues a liability for warranty obligations on the basis of historical claims history, as apercentage of revenue, specific to each business unit. Warranty costs incurred are charged against this liability.<strong>Enerflex</strong> <strong>2003</strong> <strong>Annual</strong> <strong>Report</strong>58
Income Taxes – The Company uses the liability method of accounting for income taxes. Under this method, temporary differencesbetween the tax basis of the Company’s assets and liabilities and their carrying amounts result in future income tax assets andliabilities. Future income taxes are measured using income tax rates that, at the balance sheet date, are expected to apply whenthe liability is settled or the asset is realized.Forward Exchange Contracts – In the normal course of business, the Company enters into short-term foreign currency forwardexchange contracts with financial institutions to hedge assets, liabilities or future commitments denominated in a foreigncurrency. Gains and losses arising from these contracts offset the losses and gains from the underlying hedged transactions.Foreign Currency Translation – Transactions and non-monetary balances denominated in foreign currency are translated intoCanadian dollars using the exchange rates at the dates of the transactions; monetary balances are translated using the exchangerate at the date of the balance sheet.The assets and liabilities of foreign operations considered financially and operationally independent are translated into Canadiandollars from their functional currencies using exchange rates at the balance sheet dates. Revenue and expense items aretranslated using the average rates of exchange throughout the year. Gains and losses resulting from this translation process areincluded in the cumulative translation adjustment in shareholders’ equity in the consolidated balance sheets.Stock-based Compensation Plan – The Company’s stock-based compensation plan is described in Note 10. No compensationexpense is recognized when stock options are granted to employees (See Note 11). Consideration paid by employees onexercise of stock options is credited to share capital.Earnings Per Share – The Company uses the treasury method of calculating earnings per share.Note 1. CHANGE IN ACCOUNTING POLICYRevenue recognitionEffective January 1, <strong>2003</strong>, the Company adopted a percentage of completion revenue recognition policy for fabrication activity.In the past, the Compression and Power operating segments had used the completed contract method, while Production andProcessing used percentage of completion. Under the new method, revenue and costs of goods sold are recognized in incomeat each period end, based on the costs incurred including design, engineering, materials and labour to period end as a percentageof total expected costs. Any foreseeable losses on contracts are charged to income at the time they become evident. This methodof revenue recognition more appropriately matches revenues and costs of sales to the period in which the activity occurred.As a result of the adoption of this policy, the Company has adjusted retained earnings as at January 1, <strong>2003</strong> to reflect thepercentage of completion of work in progress at December 31, 2002. The components of this adjustment are:Revenue $ 10,698Cost of goods sold 9,279Income taxes 519Increase to retained earnings, at January 1, <strong>2003</strong> $ 900Had this change in accounting policy not occurred, revenue recognized in <strong>2003</strong> would have been reduced by $16,923,000, costof goods sold would have been reduced by $16,906,000, taxes would have been reduced by $5,000, resulting in a decrease innet income of $12,000.Prior period financial statements have not been restated.Note 2. 2002 ACQUISITIONOn July 18, 2002, the Company acquired 92.4% of the issued and outstanding common shares of EnSource Energy ServicesInc. (“EnSource”). On July 23, 2002, <strong>Enerflex</strong> mailed a Notice of Compulsory Acquisition to the holders of the remainingEnSource common shares which were not tendered to the offer, pursuant to <strong>Enerflex</strong>’s right of compulsory acquisition under theBusiness Corporations Act (Alberta). EnSource became a wholly-owned subsidiary of <strong>Enerflex</strong>.<strong>Enerflex</strong> <strong>2003</strong> <strong>Annual</strong> <strong>Report</strong>59
The acquisition was accounted for using the purchase method, and the results of operations of EnSource have been includedwith those of the Company from July 19, 2002. The final cost of the acquisition was $144,645,000. At December 31, 2002, certainitems were reclassified in the purchase price equation to conform with <strong>Enerflex</strong>’s financial statement presentation.The final purchase price was allocated as follows:December 31 2002Shares issued $ 141,040Transaction costs 3,408Fair value of options issued 197$ 144,645Non-cash working capital $ 38,631Future income taxes 2,522Property, plant and equipment 29,145Rental assets 24,054Assets held for sale 4,591Other long-term assets 431Goodwill 104,924Bank indebtedness (37,612)Long-term debt (22,041)$ 144,645Note 3. INVENTORYDecember 31 <strong>2003</strong> 2002Finished goods $ 10,711 $ 11,442Manufacturing materials 14,981 23,409Repair parts held for resale 31,559 34,203Work in progress:Costs in excess of related billings 17,791 19,716Billings in excess of related costs (3,880) (7,529)$ 71,162 $ 81,241Note 4. RENTAL EQUIPMENTDecember 31 <strong>2003</strong> 2002Cost $ 87,121 $ 78,637Less accumulated depreciation (15,311) (10,545)Net book value $ 71,810 $ 68,092Depreciation of rental equipment included in income in <strong>2003</strong> was $6,091,000 (2002 - $4,866,000), which was included in costof goods sold.<strong>Enerflex</strong> <strong>2003</strong> <strong>Annual</strong> <strong>Report</strong>60
Note 5. PROPERTY, PLANT AND EQUIPMENTDecember 31 <strong>2003</strong> 2002AccumulatedAccumulatedCost Depreciation Cost DepreciationLand $ 9,551 $ – $ 9,699 $ –Buildings 53,281 (11,387) 53,196 (8,210)Equipment 49,825 (36,238) 41,269 (25,645)Total $ 112,657 $ (47,625) $ 104,164 $ (33,855)Net book value $ 65,032 $ 70,309Depreciation of property, plant and equipment included in income in <strong>2003</strong> was $8,589,000, of which $4,092,000 wasincluded in cost of goods sold and $4,497,000 was included in selling, general and administrative expenses. In 2002, depreciationof $7,188,000 was included in income; $3,191,000 in cost of goods sold and $3,997,000 in selling, general andadministrative expenses.Note 6. ASSETS HELD FOR SALEAt December 31, 2002, the Company had assets held for sale of $4,591,000, comprising the assets of the Company’s surfacedrilling equipment rental business, Canadian Select Energy West. The revenue and pretax income of these assets were$1,600,000 and $243,000, respectively, in the period July 19 to December 31, 2002. Canadian Select Energy West was includedin the Fabrication segment for the purposes of segmented reporting.On January 31, <strong>2003</strong>, the assets held for sale were sold. There was no significant impact on income in <strong>2003</strong> resulting from thisdisposition.Note 7. OPERATING BANK LOANS AND LONG-TERM DEBTIn November 2002, the Company entered into a $175,000,000 credit facility comprised of a $100,000,000 extendible operatingline and a $75,000,000 extendible revolving term loan facility, which are secured by a $250,000,000 demand debenture, ageneral security agreement, and a guarantee from each material subsidiary. The credit facilities require the Company to maintaincertain covenants. The Company was in compliance with these covenants at December 31, <strong>2003</strong> and 2002.(a) At December 31, <strong>2003</strong>, $27,627,000 (2002 - $45,254,000) of the operating line was drawn and was financed throughCanadian dollar bankers’ acceptances, which bear interest at bankers’ acceptance rates plus a margin; U.S. dollar LIBORborrowings, which bear interest at the London Interbank Offer Rate plus a margin; and bank overdrafts offset by cash deposits,as follows:<strong>2003</strong> 2002Bankers’ acceptances – CDN$ $ 6,000 $ 43,000LIBOR borrowings – (<strong>2003</strong> – U.S.$9,000; 2002 – U.S.$5,000) 11,632 7,898Net overdraft (deposits) – CDN$ equivalent 9,995 (5,644)Operating bank loans $ 27,627 $ 45,254If the operating facility is not renewed at the end of its term, it will be repayable on June 30, 2004.<strong>Enerflex</strong> <strong>2003</strong> <strong>Annual</strong> <strong>Report</strong>61
(b) At December 31, <strong>2003</strong>, $68,386,000 (2002 - $69,000,000) of the extendible revolving term loan facility was drawn, and wasfinanced through:<strong>2003</strong> 2002Bankers’ acceptances – CDN$ $ 49,000 $ 69,000LIBOR borrowings – (<strong>2003</strong> – U.S.$15,000; 2002 – U.S.$ nil) 19,386 –Long-term debt 68,386 69,000Less current portion of long-term debt (17,097) (17,250)Long-term debt $ 51,289 $ 51,750If the term loan facility is not renewed at the end of its term, it will be repayable in 24 equal consecutive monthly principalinstallments, commencing in July 2004.Canadian dollar equivalent principal payments due over the next three years, without considering renewal at similar terms, are:2004 $ 17,0972005 34,1932006 $ 17,096(c) Interest and financing costs on long-term debt were $3,640,000 (2002 - $2,017,000). The Company’s effective interest rateon long-term debt was 5.3% in <strong>2003</strong>.Note 8. SHARE CAPITALAuthorized – The Company is authorized to issue an unlimited number of common shares and first preferred shares.IssuedDecember 31 <strong>2003</strong> 2002CommonCommonShares Amount Shares AmountBalance, beginning of year 22,191,188 $ 176,589 14,861,100 $ 35,412Shares and fair value of options issuedpursuant to EnSource acquisition,net of issue costs – – 7,384,288 141,195Stock options exercised 36,000 339 17,400 153Common shares purchased – – (71,600) (171)Balance, end of year 22,227,188 $ 176,928 22,191,188 $ 176,589Common shares purchased – The Company did not purchase any shares pursuant to its normal course issuer bid in <strong>2003</strong>,and when the issuer bid expired on July 25, <strong>2003</strong>, it was not renewed. The Company will consider reinstatement of the issuerbid in 2004.In 2002, the Company purchased and cancelled 71,600 common shares at an average price of $18.88, for a total cost of$1,352,000, including commissions, pursuant to the issuer bid.<strong>Enerflex</strong> <strong>2003</strong> <strong>Annual</strong> <strong>Report</strong>62
Note 9. RECONCILIATIONS OF NET INCOME PER SHARE CALCULATIONSYear ended December 31 <strong>2003</strong> 2002Net Weighted Average Per Net Weighted Average PerIncome Shares Outstanding Share Income Shares Outstanding ShareBasic $ 20,383 22,212,700 $ 0.92 $ 9,232 18,166,000 $ 0.51Options assumed exercised 453,650 164,200Shares assumed purchased (361,736) (80,765)Diluted $ 20,383 22,304,614 $ 0.91 $ 9,232 18,249,435 $ 0.51Note 10. STOCK OPTIONSStock Options Purchased – During 2002, stock options to purchase 5,600 common shares were purchased for $20,000, net ofincome tax benefits of $11,000. In 2002, the plan was modified such that the Company will no longer purchase options for cash.Stock Options Outstanding – The Company has reserved 1,500,000 common shares under the terms of its stock option plan,of which 349,040 were available for issuance at December 31, <strong>2003</strong>. The exercise price of each option equals the average of themarket price of the Company’s shares on the five days preceding the date of the grant. Options normally vest at the rate of 20%on each of the five anniversaries of the date of grant, and expire on the tenth anniversary.In addition, in 2002, the Company reserved 175,174 common shares under the terms of the conversion plan for EnSource stockoption holders. The exercise price of each option equaled the exercise price of the previous EnSource stock option divided by theshare conversion factor of 0.26 <strong>Enerflex</strong> shares per EnSource share. Options which replaced vested EnSource options wereimmediately vested at the time of grant, and the remaining vesting period was three years.A summary of the status of the plan as at December 31, <strong>2003</strong> and 2002 and changes during the years then ended is presentedbelow:<strong>2003</strong> 2002Weighted AverageWeighted AverageOptions Exercise Price Options Exercise PriceOutstanding, beginning of year 975,334 $ 23.05 727,280 $ 23.81Granted 430,900 13.84 451,774 22.46Exercised (36,000) 9.43 (17,400) 8.82Purchased – – (5,600) 15.43Cancelled (418,812) 22.60 (180,720) 25.97Outstanding, end of year 951,422 $ 19.59 975,334 $ 23.05Options exercisable, end of year 462,291 501,213<strong>Enerflex</strong> <strong>2003</strong> <strong>Annual</strong> <strong>Report</strong>63
The following table summarizes information about the stock options outstanding at December 31, <strong>2003</strong>:Options OutstandingOptions ExercisableWeightedAverage Weighted WeightedRemaining Average AverageRange of Number Contractual Exercise Number ExerciseExercise Prices Outstanding Life (Years) Price Exercisable Price$7.81 – $9.33 134,200 1.17 $ 8.86 134,200 $ 8.86$13.62 – $21.54 517,262 8.10 16.16 110,232 19.33$25.20 – $29.50 186,580 4.53 28.15 124,591 27.98$32.63 – $38.18 113,380 5.13 33.90 93,268 33.98$7.81 – $38.18 951,422 6.07 $ 19.59 462,291 $ 21.58Note 11. STOCK OPTION EXPENSEThe Company’s stock option plan is described in Note 10.On February 21, <strong>2003</strong>, the Company issued 384,950 stock options to employees and directors at an exercise price of $13.62.On June 12, <strong>2003</strong> the Company reserved and subsequently issued 40,000 options at an exercise price of $15.22, which beginvesting in August of 2004. On October 28, <strong>2003</strong> the Company issued 4,000 options at an exercise price of $15.31, which beginvesting in February of 2004.The Company measures stock option compensation cost based on the intrinsic value of the award at the date of issuance. Asthe exercise price and the market price are the same at the grant date, no compensation cost has been recognized on any optionissuance. Had compensation cost for the Company’s stock-based compensation plan been determined based on the fair valueat the grant date for awards made under the plan subsequent to January 1, 2002, consistent with the fair value method ofaccounting for stock-based compensation, the Company’s net income and earnings per share and pro forma net income andearnings per share would have been as follows:Year ended December 31 <strong>2003</strong> 2002Net income As reported $ 20,383 $ 9,232Pro forma 20,167 8,743Earnings per share - basic As reported 0.92 0.51Pro forma 0.91 0.48Earnings per share - diluted As reported 0.91 0.51Pro forma $ 0.90 $ 0.48The estimated fair value of the options issued in <strong>2003</strong> and 2002 has been determined using a modified Black-Scholes optionpricing model with the following assumptions:<strong>2003</strong> 2002Weighted average fair value per option $2.94 $3.63Weighted average risk-free interest rate 4.1% 4.3%Weighted average expected life 5.0 years 4.6 yearsEstimated volatility in the market price of the common shares 25.1% 25.0%Dividend yield 2.9% 2.0%Commencing on January 1, 2004, the Company will adopt the new requirements to expense stock options in the financialstatements, retroactively without prior period restatement. This will result in a charge to opening retained earnings of $705,000at January 1, 2004.<strong>Enerflex</strong> <strong>2003</strong> <strong>Annual</strong> <strong>Report</strong>64
Note 12. GUARANTEES, COMMITMENTS AND CONTINGENCIESAt December 31, <strong>2003</strong> the Company had outstanding letters of credit issued in lieu of holdbacks, performance guarantees andbid bonds of $6,078,000 (2002 - $6,140,000) of which $2,155,000 (2002 - $1,506,000) are insured by Export Development Canada.The aggregate minimum lease payments for operating leases for equipment, automobiles and premises are $24,665,000 andamounts payable for the next five years and thereafter are:2004 $ 7,0792005 6,1432006 4,0512007 1,8432008 681Thereafter 4,868$ 24,665In addition, the Company has purchase obligations over the next three years:2004 $ 1,2432005 4422006 250$ 1,935The Company is involved in litigation and claims associated with normal operations. Management is of the opinion that anyresulting settlement would not materially affect the financial position or results of operations of the Company.Note 13. INCOME TAXESThe provision for income taxes differs from that which would be expected by applying statutory rates. A reconciliation of thedifference is as follows:Year ended December 31 <strong>2003</strong> 2002Income before income taxes $ 31,224 $ 14,278Canadian statutory rate 36.7% 39.2%Expected income tax provision 11,459 5,603Add (deduct)Manufacturing and processing profit reduction (287) (21)Income taxed in jurisdictions with lower tax rates (468) (81)Other 137 (455)Income tax provision $ 10,841 $ 5,046The composition of the income tax provision is as follows:Year ended December 31 <strong>2003</strong> 2002Current income taxes $ 7,964 $ 2,178Future income taxes 2,877 2,868Income tax provision $ 10,841 $ 5,046The computation of the Company’s provision for income taxes involves tax interpretations, regulations and legislation that arecontinually changing. There are tax matters that have not yet been confirmed by the various tax authorities; however, managementbelieves that the provision for income taxes is adequate.<strong>Enerflex</strong> <strong>2003</strong> <strong>Annual</strong> <strong>Report</strong>65
The tax effects of the significant components of temporary differences that give rise to future income tax assets and liabilitiesas at December 31 are as follows:<strong>2003</strong> 2002Assets Liabilities Assets LiabilitiesCurrent:Provisions $ 4,065 $ – $ 3,806 $ 2,235Tax losses – – 5,664 –4,065 – 9,470 2,235Long-term:Tax losses 1,981 – – –Capital assets 767 12,272 1,907 11,7082,748 12,272 1,907 11,708$ 6,813 $ 12,272 $ 11,377 $ 13,943The Company has available tax losses of $5,000,000, the benefit of which has been recognized based on the expected periodof utilization. These losses expire from time to time up to 2022.Current future income tax assets result from deductible temporary differences between the tax basis of the Company’s currentassets and liabilities and their carrying amounts. These relate primarily to provisions for overhaul, restructuring costs, doubtfulaccounts receivable and warranty expense and non-capital loss carryforwards expected to be utilized in the following year.Long-term future income tax assets result from deductible temporary differences between the tax basis of the Company’sproperty, plant and equipment and its carrying amount and non-capital loss carryforwards not expected to be utilized in thefollowing year.Current future income tax liabilities result from deductible temporary differences between the tax basis of accrued revenue andprogress billings and their carrying amount.Long-term future income tax liabilities result primarily from taxable temporary differences between the tax basis of the Company’srental equipment and its carrying amount.Note 14. FINANCIAL INSTRUMENTSForeign Exchange – In the normal course of operations, the Company is exposed to movements in the U.S. dollar, Australiandollar, the Pound Sterling and EURO exchange rates relative to the Canadian dollar. In order to mitigate these exposures, theCompany matches future foreign currency cash inflows with foreign currency denominated liabilities, primarily through thecurrency mix in short and long-term borrowings.From time to time, the Company also utilizes hedging instruments to create offsetting positions to specific exposures. Theseinstruments are employed in connection with an underlying asset, liability or anticipated transaction, and are not used forspeculative purposes.At December 31, <strong>2003</strong>, the Company had no currency contracts in place. At December 31, 2002 the Company had contracts tosell $3,500,000 (Australian) at an average rate of CDN/AUD $0.8603 in March and April <strong>2003</strong>. The fair value of these contracts atDecember 31, 2002 was a liability of approximately CDN$100,000.Credit Risk – A substantial portion of the Company’s accounts receivable are with customers in the oil and gas industry and aresubject to normal industry credit risks. The carrying amount of accounts receivable reflects management’s assessment of thecredit risk associated with these customers.Interest Rate Risk – The Company’s liabilities include certain long-term debt and bank indebtedness that are subject tofluctuations in interest rates. For each 1.0% change in the rate of interest on these loans, the change in interest expense wouldbe approximately $960,000 based upon the loan balances at December 31, <strong>2003</strong>.<strong>Enerflex</strong> <strong>2003</strong> <strong>Annual</strong> <strong>Report</strong>66
Fair Values of Financial Assets and Liabilities – The fair values of financial instruments that are included in the consolidatedbalance sheets, other than long-term debt, approximate their carrying amounts due to the short-term maturity of thoseinstruments. The fair value of long-term debt does not differ significantly from its carrying amount.Note 15. SEGMENTED INFORMATIONThe Company has three reportable segments: Service, Fabrication and Leasing. The Service reportable segment is the aggregationof the Mechanical Service and Syntech operating segments. The Fabrication reportable segment is the aggregation of theProduction and Processing, Compression and Power operating segments. The 2002 comparative numbers include the finalallocation of goodwill as at December 31, 2002. The 2002 comparative figures have been reallocated for the transfer of theCompression Services operating unit from the Service to the Fabrication reportable segment.Service Fabrication Leasing ConsolidatedYear ended December 31 <strong>2003</strong> 2002 <strong>2003</strong> 2002 <strong>2003</strong> 2002 <strong>2003</strong> 2002Segment revenue $ 269,036 $ 193,578 $ 259,715 $ 136,901 $ 22,281 $ 15,943 $ 551,032 $ 346,422Intersegment revenue (12,618) (2,570) (22,801) (17,140) (85) (6) (35,504) (19,716)External revenue 256,418 191,008 236,914 119,761 22,196 15,937 515,528 326,706Depreciation andamortization 3,284 2,495 5,442 5,291 5,954 4,268 14,680 12,054Income (loss) beforeinterest and taxes 15,882 14,527 7,758 (4,325) 12,864 7,717 36,504 17,919Segment assets 111,779 121,830 150,163 150,966 74,536 63,981 336,478 336,777Corporate 8,743 1,907Goodwill 52,972 52,926 52,125 52,245 7,356 7,356 112,453 112,527Total segment assets 164,751 174,756 202,288 203,211 81,892 71,337 457,674 451,211Capital expenditures $ 3,559 $ 2,123 $ 2,063 $ 2,338 $ 23,644 $ 16,516 29,266 20,977Corporate 726 59$ 29,992 $ 21,036The 2002 comparative figures have been reallocated for the transfer of the Compression Services operating unit from the Serviceto the Fabrication reportable segment as follows:Segment revenue $ 18,691Intersegment revenue (3,695)External revenue 14,996Depreciation and amortization 394Income before interest and taxes 1,058Segment assets 10,660Capital expenditures $ 1,379<strong>Enerflex</strong> <strong>2003</strong> <strong>Annual</strong> <strong>Report</strong>67
Revenue from foreign countries was:Year ended December 31 <strong>2003</strong> 2002Australia $ 33,832 $ 17,581Germany 16,896 4,985Indonesia 8,821 3,481Netherlands 17,496 15,983Pakistan 2,617 14,574United States 14,503 18,962Other 34,441 16,376$ 128,606 $ 91,942Included in these amounts are gross exportsfrom domestic operations of: $ 70,154 $ 37,383Revenue is attributed to countries by the destination of the sale. Among the countries in Other are Egypt, Gabon, Mexicoand Malaysia.Revenues from one customer represent approximately $68,021,000 of the Company’s total revenues, across all segments.Total assets in foreign countries were as follows:December 31 <strong>2003</strong> 2002Netherlands $ 14,491 $ 15,791United States 6,729 9,079Other 5,941 5,198Total assets $ 27,161 $ 30,068Total assets are attributed to countries by the location of the business.<strong>Enerflex</strong> <strong>2003</strong> <strong>Annual</strong> <strong>Report</strong>68
TEN-YEAR HISTORICAL REVIEW($ millions, exceptper share data and ratios) (unaudited) <strong>2003</strong> 2002 2001 2000 1999 1998 1997 1996 1995 1994ResultsRevenue 515.5 326.7 375.0 286.3 256.7 314.5 336.2 245.9 222.7 217.3EBITDA (1) 51.2 30.0 47.8 28.9 29.1 42.4 46.7 32.4 32.2 33.8Income before income taxes 31.2 14.3 36.5 17.7 20.4 38.1 42.7 27.8 26.9 30.2Net income 20.4 9.2 22.5 11.3 12.1 22.6 25.2 16.5 16.1 17.8Per common share – basic ($) 0.92 0.51 1.51 0.76 0.81 1.50 1.67 1.10 1.07 1.17Interest expense (income) 5.3 3.6 2.7 3.6 1.9 (0.3) (0.1) 0.7 1.3 1.3Depreciation and amortization 14.7 12.1 8.6 7.6 6.8 4.6 4.1 3.9 4.0 2.3Cash from operations beforechanges in non-cashworking capital 34.9 22.7 30.0 18.5 18.7 26.0 28.8 19.7 21.9 18.9Capital expenditures, netRental equipment 3.7 8.5 10.0 7.9 5.6 10.2 0.6 (2.2) 0.2 8.6Property, plant and equipment 2.8 2.2 2.5 4.3 14.8 23.5 3.3 2.7 3.7 7.2Dividends on common shares 8.9 7.4 6.0 6.0 6.0 6.0 4.5 3.8 3.8 2.6Financial PositionWorking capital 82.8 68.7 62.1 57.9 60.0 56.0 58.0 37.7 26.9 13.0Rental equipment 71.8 68.1 39.0 31.7 26.0 22.2 13.4 13.8 16.9 18.1Property, plant and equipment 65.0 70.3 45.1 47.3 47.7 36.7 16.2 15.5 15.2 13.8Total assets 457.7 451.2 222.1 192.7 186.1 159.5 142.7 106.4 91.8 102.5Long-term debt 68.4 69.0 30.0 30.0 30.0 15.2 – – 4.6 4.7Shareholders’ equity 274.5 260.9 118.5 104.1 103.0 100.1 87.0 66.4 53.6 41.6Key RatiosGross margin as a percentageof revenue 20.2 21.4 19.5 18.8 19.8 22.4 21.7 21.4 22.3 23.6Pre-tax income as a percentageof revenue 6.1 4.4 9.7 6.2 8.0 12.1 12.7 11.3 12.1 13.9Return on average equity (2) (%) 7.6 4.9 20.2 10.9 11.9 24.1 32.9 27.6 33.9 52.3Return on capital employed (3) (%) 10.0 6.9 24.0 13.9 15.7 36.7 54.6 41.1 43.2 65.0(1) Earnings before interest, taxes, depreciation and amortization (EBlTDA) is a non-GAAP (Generally Accepted Accounting Principles) earningsmeasure that does not have a standardized meaning prescribed by GAAP and therefore is unlikely to be comparable to similar measurespresented by other issuers.<strong>Enerflex</strong> calculates EBITDA as follows ($ thousands): <strong>2003</strong>Income before interest and income taxes 36,504Depreciation and amortization 14,680EBITDA 51,184(2) Return on average equity is calculated as net income divided by the simple average of shareholders’ equity at the beginning and end of the year.(3) Return on capital employed is calculated as pre-tax income plus interest expense divided by the simple average of capital employed atthe beginning of the year and at the end of each quarter. Capital employed is the sum of shareholders’ equity plus current and long-termbank indebtedness.<strong>Enerflex</strong> <strong>2003</strong> <strong>Annual</strong> <strong>Report</strong>69
QUARTERLY DATA<strong>2003</strong> 2002($ millions, except per share data and ratios) (unaudited) Q4 Q3 Q2 Q1 Q4 Q3 Q2 Q1Revenue 144.2 124.1 115.3 131.9 110.7 112.0 54.3 49.7EBITDA (1) 15.4 13.3 10.5 12.0 9.7 9.6 7.9 2.8Income before income taxes 10.6 8.4 5.3 6.9 4.0 4.8 5.3 0.2Net income 7.2 5.5 3.3 4.4 3.1 2.9 3.2 0.0Per common share – basic ($) 0.33 0.24 0.15 0.20 0.14 0.14 0.22 0.00Depreciation and amortization 3.6 3.7 3.7 3.7 4.3 3.6 2.1 2.1Cash from operations before changesin non-cash working capital 9.1 10.4 6.6 8.8 7.9 7.2 5.4 2.2Capital expenditures, netRental equipment 5.8 3.5 0.0 (5.6) 0.7 4.6 1.2 2.0Property, plant and equipment 2.3 1.0 (0.7) 0.2 1.6 0.1 0.3 0.2Dividends on common shares 2.2 2.2 2.2 2.2 2.2 2.2 1.5 1.5Dividends per common share (¢) 10.0 10.0 10.0 10.0 10.0 10.0 10.0 10.0Pre-tax income as a percentage of revenue 7.4 6.8 4.6 5.2 3.6 4.3 9.7 0.4COMMON SHARE DATA<strong>2003</strong> 2002 2001 2000 1999 1998 1997 1996 1995 1994Trading price range ofcommon stock: – high 20.20 26.50 32.40 42.00 40.00 45.60 44.00 18.25 9.00 9.75– low 12.05 13.20 18.60 25.00 29.50 23.85 16.75 8.19 6.12 7.00– close 20.20 15.00 19.75 31.00 37.50 29.50 32.50 16.50 8.38 8.69Trading volume (millions) 8.9 7.0 5.2 6.8 5.0 7.5 7.7 3.0 4.5 5.5Common shares (millions)Outstanding at end of year 22.2 22.2 14.9 15.0 15.0 15.0 15.1 15.1 15.1 15.1Weighted average – basic 22.2 18.2 14.9 15.0 15.0 15.1 15.1 15.1 15.1 15.1(1) Earnings before interest, income taxes, depreciation and amortization (EBlTDA) is a non-GAAP (Generally Accepted Accounting Principles)earnings measure that does not have a standardized meaning prescribed by GAAP and therefore is unlikely to be comparable to similarmeasures presented by other issuers.<strong>Enerflex</strong> calculates EBITDA as follows ($ thousands): <strong>2003</strong>Income before interest and income taxes 36,504Depreciation and amortization 14,680EBITDA 51,184common share performanceindex (per $ invested, 1994 = 100)ENERFLEX 100 99 199 395 363 466 391 254 198 272TSE 100 112 141 159 154 200 212 183 157 19594 95 96 97 98 99 00 01 02 03<strong>Enerflex</strong> <strong>2003</strong> <strong>Annual</strong> <strong>Report</strong>70
corporate directoryDirectors and OfficersP. John AldredDirectorOfficer of the CorporationChairman, President andChief Executive Officer<strong>Enerflex</strong> Systems Ltd.Calgary, AlbertaPatrick D. Daniel (1)DirectorPresident andChief Executive OfficerEnbridge, Inc.Calgary, AlbertaMichael A. Grandin (1)DirectorChairman andChief Executive OfficerFording Canadian Coal TrustCalgary, AlbertaDouglas J. HaugheyDirectorPresidentGas Transmission WestDuke Energy CorporationCalgary, AlbertaGeoffrey F. Hyland (2)DirectorPresident andChief Executive OfficerShawcor Ltd.Rexdale, OntarioJohn R. KingDirectorSenior Vice-PresidentTechnology Services GroupPrecision Drilling CorporationCalgary, AlbertaJ. Nicholas Ross (1)(2)DirectorChairman and Chief ExecutiveOfficerRover Capital CorporationToronto, OntarioHon. Barbara J. Sparrow (1)DirectorPresidentSparrow Holdings Ltd.Calgary, AlbertaRobert C. Williams (2)DirectorManaging DirectorEquity CapitalMarkets/SyndicationScotia Capital Inc.Toronto, OntarioJ. Blair GoertzenOfficer of the CorporationExecutive Vice-President andChief Operating OfficerRed Deer, AlbertaDale J. HohmOfficer of the CorporationVice-President andChief Financial OfficerCalgary, AlbertaKelly R. SmithOfficer of the CorporationVice-President,Production and ProcessingEdmonton, AlbertaYves J. TremblayOfficer of the CorporationVice-President, SyntechAirdrie, AlbertaSean R. UlmerOfficer of the CorporationVice-President, LeasingCalgary, AlbertaNote:(1) Member of Audit Committee(2) Member of Corporate Governance andCompensation CommitteeCorporate Office4700 47 Street SECalgary, AlbertaCanada T2B 3R1Tel: 1.403.236.6800Fax: 1.403.236.6816Email: ir@enerflex.comWebsite: www.enerflex.com<strong>Enerflex</strong> <strong>2003</strong> <strong>Annual</strong> <strong>Report</strong>71
shareholder informationSharesThe common shares of the Company are listed andtraded on the Toronto Stock Exchange under the sharesymbol “EFX.” The Company is a constituent of theS&P/TSX Composite Index.Registrar and Transfer AgentComputershare Trust Company of Canada600, 530 8 Avenue SWCalgary Alberta T2P 3S8Tel: 1.800.564.6253Dir: 1.403.267.6555Fax: 1.403.267.6592Internet: www.computershare.comEmail: caregistryinfo@computershare.comAll questions about accounts, stock certificates ordividend cheques should be directed to the Registrarand Transfer Agent.AuditorsDeloitte & Touche LLPCalgary, AlbertaBankersCanadian Imperial Bank of CommerceHSBC Bank CanadaCalgary, AlbertaInvestor InformationRequests for the Company’s <strong>Annual</strong> <strong>Report</strong>, Quarterly<strong>Report</strong>s and other corporate communications shouldbe directed to:Investor Relations<strong>Enerflex</strong> Systems Ltd.4700 47 Street SECalgary Alberta T2B 3R1Tel: 1.403.236.6800Email: ir@enerflex.comShares Held in Nominee NameTo ensure that shareholders whose shares are not heldin their name receive all Company reports and releaseson a timely basis, a direct mailing list is maintained bythe Company. If you would like your name added to thislist, please forward your request to Investor Relationsat <strong>Enerflex</strong>.<strong>Annual</strong> General MeetingThe <strong>Annual</strong> Meeting of Shareholders of <strong>Enerflex</strong>Systems Ltd. will be held on April 15, 2004, at theSheraton Suites Eau Claire, 255 Barclay Parade SW,Calgary, Alberta, at 11:00 a.m. Calgary time.SolicitorsBennett Jones LLPCalgary, Alberta124 8141376123951110on the coverLegend:1. Marty Carriere, Senior Electrical Foreman2. Vera Stephenson, Credit & Collection Manager3. Clint Marshall, Proposal Technician4. Steven Graham, General Manager5. Gerald Allard, Production Manager6. Chuck Kitts, Warehouse Group Leader7. Kevin Zeiler, Lead Hand, Structural8. Trent Knight, Manager, Turbine Sales9. Lin Kingdon, Administrative Supervisor10. Melanie Wilson, Apprentice Instrument Technician11. Daryl Light, Lead Project Designer12. Mike Admussen, Service Manager13. David Krobutschek, Senior Project Manager14. Raymond Guinsatao, Journeyman Welder<strong>Enerflex</strong> <strong>2003</strong> <strong>Annual</strong> <strong>Report</strong>72
<strong>Enerflex</strong>Tom ThulShop SupervisorCompression ServicesBiosClint Marshall (IFC)Proposal TechnicianJiroClint has been a valued and versatilemember of the Jiro team for six years. Hestarted out as an apprentice welder in thefabrication shop and over the years hasacquired his B-pressure ticket. He has beeninvolved in all phases of compressorassembly, from skid assembly to test runs.Proving his versatility, Clint joined Jiro’sProposal group at the end of <strong>2003</strong>, wherehis production experience will be a bigasset.Jim Degenhardt (p. 4)Resident Partsman, Slave LakePamcoWith the division since 1995, the names“Jim Degenhardt” and “Pamco” aresynonymous in the town of Slave Lake andwith customers in the surrounding area.Jim is responsible for everything fromcustomer parts requirements through tokeeping the coffee fresh and the grass cut.A volunteer fireman, Jim’s devotion to hiscommunity and to his family help definewhat Pamco is about.Charlie Burgeson (p. 5)Vessel Pipe SupervisorEFX CompressionWith 23 years of service at <strong>Enerflex</strong>, Charlieis among the leading experts in vessel andprocess piping fabrication in the industry.He is highly respected in his field and as aresult, benefits our Company by attractingmany of the best tradesmen in the industry.Charlie's expertise and leadership will playa key role in our ability to maintain our worldclass status and high level of customersatisfaction.Jacqui Blunsum (p. 8)Receptionist, PerthGas Drive SystemsWhen Jacqui joined Gas Drive SystemsPerth office in 2000, no one – not even Jaquiherself – realized what an integral part of theoperation she would become. Jacqui keepsthe operation humming handling keyadministration functions. Her achievementsinclude organizing the WADA (WaukeshaAsia Distributors Association) conferencein Perth in April 2002 and being instrumentalin the set-up of invoicing of goods toIndonesia.Michiel Sap (p. 9)Service EngineerLandré RuhaakIn just five years with the division, Michiel hasexpanded his maintenance and engineeringexpertise beyond co-generation, to includethe compression side of the business.Trained at Ariel, Waukesha and Pamco, hehas worked on projects in the North Sea,Poland, Ukraine and the Netherlands. In thenear future, he will be taking on a project inTurkmenistan.Feroze Ansari (p.11)Proposal TechnicianPowerFondly nicknamed “fount of all knowledge”,Feroze joined the division three years agowhen he came to Canada from Pakistan.With 13 years of experience in management,customer service and hardware engineering,Feroze has already made his mark,having assisted the Standards group indefining all Power standards and as theauthor of all ISO procedures for the division.Cecil Wood (p.17)QA/QC, HSE SupervisorEFX Compression USAIn his eight years with the company, Cecilhas held various management positionsincluding Shop Superintendent. Cecil'sleadership is respected among productionand engineering staff. He is recognizedas a team player and a valued employeeof <strong>Enerflex</strong>.Rennyarto Chandra (p. 27)Sales DirectorPT Gas Drive Systems IndonesiaIn just over one year with the division,Renny has been instrumental in buildingthe business from a start-up operationto a company that has capabilities incompression, processing and productionfacilities and service. Renny has over13 years of experience in the sales,marketing, project engineering, projectcontrol, project planning, fabrication,testing and commissioning of equipmentfor the oil and gas industry.Dean Jones (p. 35)Leasing Coordinator - Process EquipmentLeasingAn <strong>Enerflex</strong> team member for seven years,Dean has taken on the management andmarketing of rental process equipmentalmost single-handedly and is directlyresponsible for increasing utilization of thefleet to unprecedented levels. It is notunusual for Dean to take customers’ calls atnight and on weekends, ensuring theirneeds are being met.Mike McKinty (p. 41)Operations ManagerMactronicMike has represented Mactronic for overtwenty years with knowledge anddedication. Customers repeatedly ask forMike by name. The experience and firsthandknowledge he has acquired over thelast two decades has been instrumental inthe development and the quality of many ofthe Mactronic products in use today.Boh McLean (p. 49)Branch Manager, LloydminsterSyntechBoh has been with Syntech for 17 years,having started as an electrical apprenticein a predecessor’s shop in Kindersley,Saskatchewan. As Manager of Syntech’sLloydminster branch, Boh is responsible forthe over 40 people in the branch and looksafter Syntech’s customers within a radiusthat extends west to Viking, south to CactusLake, north to Frog Lake and east to NorthBattleford.Tom Thul (IBC)Shop SupervisorCompression ServicesTom’s vast field revamp experience is aperfect example of how CompressionServices’ status as the only stand-alonerevamp specialist is made possible by theexperience and dedication of our people.Eric Allison (OBC)Senior Project Manager,International ProjectsPressonAlmost by himself, Eric represents whatthe total <strong>Enerflex</strong> solution – teamwork fromwellhead to pipeline – can mean. Eric joinedPresson over 10 years ago as a JuniorProcess Engineer. As Senior ProjectManager, International Projects, he hasplayed a key role in Presson's success onthe international stage, having managedseveral of Presson's major projects in areasaround the world.<strong>Enerflex</strong> <strong>2003</strong> <strong>Annual</strong> <strong>Report</strong>
Eric AllisonSenior Project Manager, International ProjectsPressonENERFLEX SYSTEMS LTD.4700 47 Street SE Calgary AB Canada T2B 3R1 Tel: 1.403.236.6800 Fax: 1.403.236.6816Printed in Canada