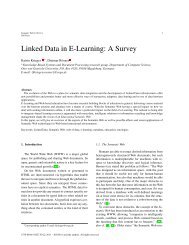
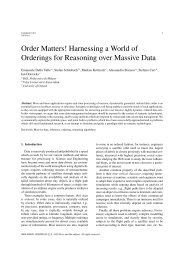
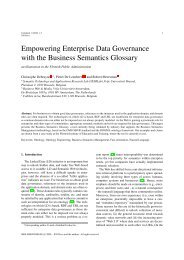
4 S. Mazumdar, D. Petrelli and F.Ciravegna / A <strong>Visual</strong> <strong>Dashboard</strong> <strong>for</strong> <strong>Linked</strong> <strong>Data</strong>: An Exploration of User and System RequirementsFig. 1. The <strong>Web</strong>-based interface <strong>for</strong> grass data with generic filters (top) and four different views on the retrieved data set, namely: tag cloud,result list, pie chart and geo-plot. (<strong>Data</strong> is courtesy of the GrassPortal(http://www.grassportal.org/) Project and Kew Gardens)tions provide complementary in<strong>for</strong>mation to the useras shown in Figure 2: the most discussed topic wasthe police (from the tag cloud top left), two areaswere affected (from the geographical view, mid right),and when twitter and flickr registered higher activities(timeline, bottom right). The different visual widgetsact on the same data set, each parsing it according tothe type of visualization they provide, e.g. geo-plottingextracting geo in<strong>for</strong>mation, timeline focussing on timevalues, etc.It is important to notice that some visualizationscould be meaningless with certain data, e.g. if timeis not provided a timeline would be empty. There<strong>for</strong>eusers can enable or disable widgets or re-arrange them(via drag-and-drop) depending on their needs and thedata in hand. For example, a numeric data would bebetter visualized as table, a pie chart or a bar chartthan as a list. The visualization widgets developed sofar include: a tag-cloud; a result list with links; a geographicalplot; a timeline; a pie chart; a bar chart (allin Figure 2). Although this list is surely not exhaustive,we were at this point more interested in providing ageneric framework that could be expanded with othervisual widgets then an exhaustive, but closed, tool. Indeed.views., acts as a visualization plat<strong>for</strong>m <strong>for</strong> linkeddata where new visualization widgets can be pluggedinas and when they are developed.Essential <strong>for</strong> an effective use is to provide simplemechanisms to query the data set. As first experimentedin [13], .views. uses the concept of dynamicquery [1]: the interface provides graphical direct manipulationwidgets, e.g. lists or slide-bars; while interacting,the user automatically queries the underliningdatabase and the data in the filtered set is displayed.This approach supports Schneidermans wellknowndesign paradigm “overview first, zoom and filter,then details-on-demand” [15]: the full set is displayedfirst, the user uses the filters to select the subsetof interest, then clicks on a view to dig into the details,e.g. at individual instances..views. provides two different types of filteringmechanisms: global and local. Global filters act on thewhole data set and affect all of the visualization widgets;local filters are attached to a single view (or widget),e.g. zooming in a geographical view to see details;clicking on a slice of a pie chart to see the relevantsubset of data. Global filters are automaticallygenerated out of the data set, while local filters could
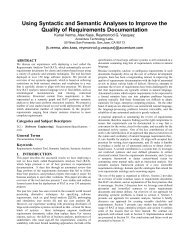
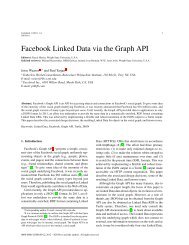
S. Mazumdar, D. Petrelli and F.Ciravegna / A <strong>Visual</strong> <strong>Dashboard</strong> <strong>for</strong> <strong>Linked</strong> <strong>Data</strong>: An Exploration of User and System Requirements 5Fig. 2. Social data after the flood in Cumbria, UK in 2007 visualised using .views. (<strong>Data</strong> harvested from Flickr(http://flickr.com) and Twitter(http://twitter.com))be already imbedded in some views (e.g. on maps) butsome need implementation (e.g. pie chart selection).Global filters are composed to retrieve the result set:items selected from a drop-down menu can be set to aspecific value <strong>for</strong> data querying (Figure 3). Local filterssupport digging-into the retrieved set from differentperspectives.Fig. 3. Global filtering <strong>for</strong> user-defined queries on the DBpediadataset. On entering the values <strong>for</strong> filters, the number of results availableis displayed in brackets.Once the system has initialized, the user makes useof the global filters to select a subset of interest fromthe entire dataset. This is done by selecting filters froma drop-down list of all the available filters. This list isautomatically generated during initialization by queryingthe backend <strong>for</strong> all the query-able concepts. Selectinga filter from the list adds the filter to the filteringinterface, and the user can type the values <strong>for</strong> the respectivefilters. The backend is then queried by makinguse of the filter values set by the user. The results ofthe query are then visualized in all of the visualizationwidgets that are available to the user. The user can thenchoose to explore individual visualizations by makinguse of local filters- like clicking on sections of aggregateplots (e.g. bar charts, pie charts etc.), zooming intogeographical maps etc. This provides a generic way ofquerying and visualizing linked data, as the user interfaceand visualizations are always shaped on the basisof the data and its strucuture and not on pre-determineddomain-specific document templates..views. provides automatic suggestions: while theuser enters the values <strong>for</strong> each global filter, SPARQLqueries are sent to the backend to provide suggestionsto the user. Figure 4 shows an example taken from thegrass data set: typing pa provides Paniceae, Parianeaeand Pappophoreae as possible values, with the num-