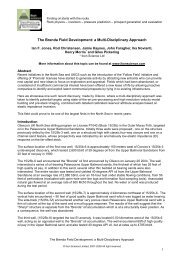
Petrophysical fracture identification for rock physics ... - Net Brains
Petrophysical fracture identification for rock physics ... - Net Brains
Petrophysical fracture identification for rock physics ... - Net Brains
- No tags were found...

Create successful ePaper yourself
Turn your PDF publications into a flip-book with our unique Google optimized e-Paper software.
Table 1: Fracture response based on the conventional well-logsStep 2: Calculating <strong>fracture</strong>s properties quantitatively• Porosity <strong>fracture</strong> index ( φf _ index): If a <strong>fracture</strong>d <strong>for</strong>mation can be considered as adual porosity system then the effective porosity consists of both matrix porosity and asecondary (<strong>fracture</strong> porosity). The effective porosity, calculated from the sonic log, issensitive to the inter-granular porosity. Meanwhile, the porosity calculated using theneutron and density logs included the <strong>fracture</strong> porosity (Yan 2008). The equationsbelow give the relationships between <strong>fracture</strong> porosity ( φ ), <strong>fracture</strong> porosity index( φf _ index), neutron- density porosity ( φND), density porosity ( φD), sonic porosity ( φs)and neutron porosity ( φN).φ = φfND−φ,sφf _ indexφ=• Resistivity <strong>fracture</strong> index (RLog name Response Description or noteCALI Calliper log Size change Sudden variations indicate a discrete featureSP Spontaneous potential log Anomalous Need to refer to other related factorsGR Gamma-Ray log Anomalous Low background readingsDT Sonic log Apparent value change Using porosity to compare with DEN/NEU porosityFDC Formation density log A sharp drop Combined with PEF <strong>for</strong> an open <strong>fracture</strong>.LLD,LLSDeep and shallow resis. log LLD> or LLS high angle, LLD
1 1 4 0.4ε = ( − ) ⋅(10/( )) (Vertical)R R Rllslldmf1 1( − ) ⋅10R R11.2Rlld llsε =(Horizontal)mf4Implementation and case studyFig. 3 The correlation of <strong>fracture</strong> porosity and apertureThe FCP method generates the probability of a <strong>fracture</strong> existing. This function, COMP, iscalculated as the weighted sum of petrophysical parameters. The weights are assigned basedon an interpretation of the reliability of the parameter to detect the presence of <strong>fracture</strong>s. Theprobability can be displayed as a synthetic FMI image on the CPI plot (Figure 4). The keysteps <strong>for</strong> implementation may be summarised as follows:Fig. 4 Fracture indication based on FCP method (left) and calibration to FMI (right)• Determine the <strong>fracture</strong> thickness ( hi) in depth (H) and calculate the <strong>fracture</strong> effectvalue using Pi = hi/ H . Then estimate the weight <strong>for</strong> each thickness ( wi= Pi/ ∑ p )jand calculate <strong>fracture</strong> probability COMP =andwiis the <strong>fracture</strong> weight).m∑i=1wi⋅x imj = 1(where x iis the <strong>fracture</strong> parameter• The calculated <strong>fracture</strong> probability (COMP) is calibrated to the FMI log. Thecalibrated <strong>fracture</strong> probability is then used to build relevant correlations to determine<strong>fracture</strong> properties such as <strong>fracture</strong> porosity and <strong>fracture</strong> aperture.An example using the FCP method in a carbonate <strong>for</strong>mation is shown in Figure 4 (left). TheFCP method generates estimates of: <strong>fracture</strong> porosity index (a), resistivity <strong>fracture</strong> index (b)and a synthetic <strong>fracture</strong> image plot (c). Also shown in Figure 4 (right) is the calibration of theFCP method to FMI data. A comparison can be made between <strong>fracture</strong> porosity (d), porosityaperture (e) derived using the FCP method and <strong>fracture</strong> porosity (D) and <strong>fracture</strong> aperture (E)derived from the FMI log. It can be seen in Figure 4 (right) there is a good correlation71 st EAGE Conference & Exhibition — Amsterdam, The <strong>Net</strong>herlands, 8 - 11 June 2009
etween the <strong>fracture</strong> porosity and <strong>fracture</strong> aperture predicted by the FCP method (d and e) andthe measured FMI logs (D and E).Carbonate <strong>rock</strong>s exhibit complicated pore textures. However, in practise, the Gassmannequations (1951) are still valid <strong>for</strong> porous media of any lithology if the observation frequencyis low and the background matrix is tight (Han, 2007). Figure 5 shows a comparison betweensynthetic gathers generated assuming the conventional porosity log (PHIE) and a <strong>fracture</strong>porosity log from FCP calculation. The tracks refer to the following: (a) Volume set; (b)Saturation set; (c) Vp (m/s); (d) Vs (m/s); (e) Density (g/cc); (f) Conventional PHIE (in red)and <strong>fracture</strong> porosity log from FCP (black); (g) Initial gather calculated from Vp, Vs andDensity; (h) Oil 80% gather using FCP; (i) Oil 80% gather using PHIE; (j) difference between(h) and (i); (k) Gas 90% gather using FCP; (l) Gas 90% gather using PHIE; (m) differencebetween (k) and (l); The difference plots in tracks (j) and (m) suggest that the <strong>fracture</strong>porosity needs to be taken into account in AVO studies, as a stronger dimming response isencountered at the top of the lower reservoir level (indicated by the horizontal red line) if onetakes into account the FCP calculated <strong>fracture</strong> porosity log.(a) (b) (c) (d) (e) (f) (g) (h) (i) (j) (k) (l) (m)Fig. 5 Fluid substitution effect on AVO with and without considering <strong>fracture</strong> porosity, asderived from the FCP method, <strong>for</strong> 80% oil (tracks h and i) and 90% gas (tracks k and l).ConclusionThe <strong>fracture</strong> comprehensive probability (FCP) is presented as a method to interpret essential<strong>fracture</strong> properties from conventional petrophysical log data. The FCP approach generates asynthetic image log that can be calibrated to FMI image logs. A case study from a gassaturated carbonate reservoir is also shown <strong>for</strong> the case study. A significant difference isobserved in the AVO response of the reservoir when the <strong>fracture</strong> parameters are incorporatedin the modelling. It is concluded that the FCP methodology is an important precursor to <strong>rock</strong><strong>physics</strong> studies when fracturing is expected to be significant but image log data areunavailable.ReferencesGassmann, F., [1951]. Elastic waves through a packing of spheres: Geo<strong>physics</strong> 16, 673-685.Han, D., H., [2007]. Velocity of Carbonate Rocks, CSRPB, University of Houston, Vol. No.P1-8.Sibbit, A.M, and Faivre, O., [1985]. The Dual laterolog response in <strong>fracture</strong> <strong>rock</strong>. SPWLA26 th Symposium.Yan. J., Lubbe, R., and Pillar, N., [2008]. Modified velocity model <strong>for</strong> seismic study via AVO,Journal of Seismic Exploration, Vol. 17, p371-390.71 st EAGE Conference & Exhibition — Amsterdam, The <strong>Net</strong>herlands, 8 - 11 June 2009