Titles should be in Arial font size 12 bold - Net Brains
Titles should be in Arial font size 12 bold - Net Brains
Titles should be in Arial font size 12 bold - Net Brains
- No tags were found...

Create successful ePaper yourself
Turn your PDF publications into a flip-book with our unique Google optimized e-Paper software.
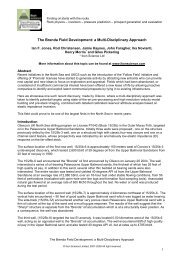
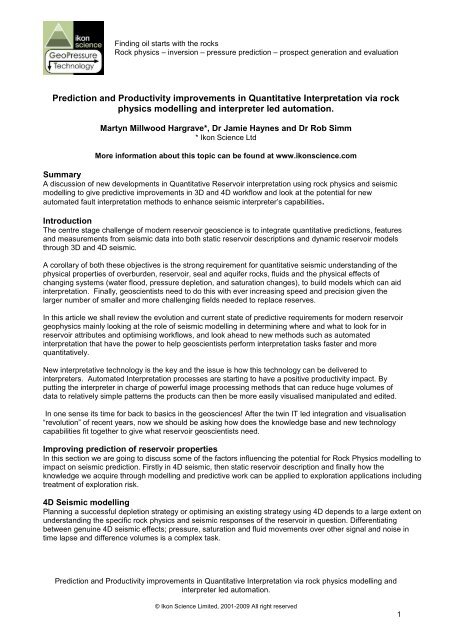
Knowledge of PlayF<strong>in</strong>d<strong>in</strong>gF<strong>in</strong>d<strong>in</strong>g oil starts with the rocksRock physics – <strong>in</strong>version – pressure prediction – prospect generation and evaluationN/A20%50%GoodN/A10%25%N/AN/A<strong>12</strong>%PoorLowHighConfidence <strong>in</strong> DHIFigure 5. An example of a chance of success matrix based on DHI‟s.Ways forward with attribute <strong>in</strong>terpretationEffective DHI <strong>in</strong>terpretation requires rigorous analysis and a cross-discipl<strong>in</strong>e understand<strong>in</strong>g of what attributescan and can‟t do for us. Non-specialists (i.e. most geophysicists, geologists and <strong>in</strong>creas<strong>in</strong>gly managers andeng<strong>in</strong>eers) need to <strong>be</strong> able to ask the right questions to put the seismic <strong>in</strong>formation <strong>in</strong>to context. This wouldhelp communication and ensure that the geophysical <strong>in</strong>terpretation is done <strong>in</strong> the most rigorous waypossible. This technology transfer can only happen if:1. There is a greater general understand<strong>in</strong>g and access to seismic analysis techniques l<strong>in</strong>ked to calibrationmethods, <strong>in</strong>clud<strong>in</strong>g rock physics, and their limitations, via tra<strong>in</strong><strong>in</strong>g and accessible technology.2. There is access to a knowledge database of previous examples, the good, the bad and the downrightugly, and lessons learned from that database.Established tra<strong>in</strong><strong>in</strong>g courses can go some way to achiev<strong>in</strong>g this, but there has to <strong>be</strong> an active m<strong>in</strong>d-set with<strong>in</strong>each company to synthesise past experiences <strong>in</strong>to „learn<strong>in</strong>gs‟ that are made available to those who needthem. The value of the knowledge data base <strong>should</strong> not <strong>be</strong> underestimated and it is never too late to <strong>be</strong>g<strong>in</strong>the process of develop<strong>in</strong>g it. What is not enough is for the geophysical priesthood to simply write guidel<strong>in</strong>esand prescri<strong>be</strong> expert - authorised workflows. They do not ensure communication and <strong>in</strong> the worst cases canactually stop people th<strong>in</strong>k<strong>in</strong>g!The follow<strong>in</strong>g example shows how rock physics was used to model the presence of a Late Jurassic massflow sand reservoir (the Buzzard Ettrick sands <strong>in</strong> the UK Central North Sea). By predict<strong>in</strong>g its elastic seismicproperties, seismic modell<strong>in</strong>g of these effects can predict workflows to use <strong>in</strong> process<strong>in</strong>g and <strong>in</strong>terpret<strong>in</strong>g 3Dattribute volumes when look<strong>in</strong>g for analogues and new plays.Mass flow sands like Buzzard can <strong>be</strong> of excellent reservoir quality as is shown by the CPI plots for well 20 /6-2 (Figure 6), which shows the high net to gross of the proximal Buzzard Ettrick sand system. A rockphysics study of these wells was performed <strong>in</strong>clud<strong>in</strong>g, <strong>in</strong>vasion corrections, determ<strong>in</strong>ation of dry rock moduli,and Gassman fluid substitution from br<strong>in</strong>e-filled to oil-filled conclud<strong>in</strong>g with a comparison of modelled elasticparameters to determ<strong>in</strong>e the most effective predictor of hydrocarbon filled sands and, if possible the highestnet pay. The attributes exam<strong>in</strong>ed <strong>in</strong>cluded AI, EI, LMR attributes and an attribute comb<strong>in</strong><strong>in</strong>g AI and EI calledAVOImpedance.Prediction and Productivity improvements <strong>in</strong> Quantitative Interpretation via rock physics modell<strong>in</strong>g and<strong>in</strong>terpreter led automation.© Ikon Science Limited, 2001-2009 All right reserved5
F<strong>in</strong>d<strong>in</strong>gF<strong>in</strong>d<strong>in</strong>g oil starts with the rocksRock physics – <strong>in</strong>version – pressure prediction – prospect generation and evaluationFigure 6. Well 20/6-2 Petrophysical analysisThe comparative analysis showed that AVOImpedance (a projection based on EI and AI) was ranked highestas the most discrim<strong>in</strong>at<strong>in</strong>g predictive attribute both for presence of oil fill (Fig 7) and <strong>in</strong> predict<strong>in</strong>gHydrocarbon net pay (Figure 8).Figure 7. AVOImpedance oil filled sand discrim<strong>in</strong>ation templateFigure 8. <strong>Net</strong> pay from AVOImpedenceThe rock physics models can <strong>be</strong> extended to 2D by <strong>in</strong>corporat<strong>in</strong>g the typical up dip p<strong>in</strong>ch out geometry of theBuzzard gra<strong>be</strong>n <strong>in</strong>to the RokDoc Scenario package (Figures 9 &10).Prediction and Productivity improvements <strong>in</strong> Quantitative Interpretation via rock physics modell<strong>in</strong>g and<strong>in</strong>terpreter led automation.© Ikon Science Limited, 2001-2009 All right reserved6
F<strong>in</strong>d<strong>in</strong>gF<strong>in</strong>d<strong>in</strong>g oil starts with the rocksRock physics – <strong>in</strong>version – pressure prediction – prospect generation and evaluationPerform Gassmann fluid substitutionBr<strong>in</strong>e scenarioFigure 9. Buzzard type model br<strong>in</strong>e filled viewed as Elastic impedance model (EI).The test of modell<strong>in</strong>g and rock physics of course is whether these effects can actually <strong>be</strong> detected on realseismic data with all the attendant problems of noise and variable data quality. Hav<strong>in</strong>g a 2D or 3D modelallows direct comparison with the seismic attributes themselves.Perform Gassmann fluid substitutionOil scenarioFigure. 10. Oil -Filled sand modelsFigure 11 shows the results of <strong>in</strong>version of a 2D seismic l<strong>in</strong>e to the AVOImpedance attribute predicted by thevisual modell<strong>in</strong>g and rock physics to <strong>be</strong> the <strong>be</strong>st attribute on which to discrim<strong>in</strong>ate and <strong>in</strong>terpret lithology andfluid-fill.2 oil sandsAVOImpedanceOil sandOWC?Water sandZone of wellcalibrationShaleFigure 11. AVOImpedance InversionPrediction and Productivity improvements <strong>in</strong> Quantitative Interpretation via rock physics modell<strong>in</strong>g and<strong>in</strong>terpreter led automation.© Ikon Science Limited, 2001-2009 All right reserved7
F<strong>in</strong>d<strong>in</strong>gF<strong>in</strong>d<strong>in</strong>g oil starts with the rocksRock physics – <strong>in</strong>version – pressure prediction – prospect generation and evaluationThe seismic <strong>in</strong>version result clearly shows the two oil filled Buzzard sands (blue/yellow) separated by shale(green/brown) and term<strong>in</strong>at<strong>in</strong>g at a common oil water contact. Further it has discrim<strong>in</strong>ated this positive resultfrom the br<strong>in</strong>e filled case at the 20/6-2 well to the left of the section!The next wave: automated Interpretation methods <strong>in</strong>crease ProductivityWith a dim<strong>in</strong>ish<strong>in</strong>g and ag<strong>in</strong>g work force and more well, seismic, and real-time reservoir data <strong>be</strong><strong>in</strong>g collectedto analyse, there is a clear need to streaml<strong>in</strong>e workflows and <strong>in</strong>crease the speed of analysis and<strong>in</strong>terpretation. This is not a problem which is conf<strong>in</strong>ed to the reservoir geoscience bus<strong>in</strong>ess. For <strong>in</strong>stance <strong>in</strong>medical science the use of Magnetic Resonance Imag<strong>in</strong>g (MRI) and Functional Magnetic ResonanceImag<strong>in</strong>g (FMRI) has given rise to an explosion of digital image data analogous to the explosion of 3D and 4Dseismic data <strong>in</strong>to our <strong>in</strong>dustry. Just like seismic data this data needs to <strong>be</strong> <strong>in</strong>terpreted and risk reduc<strong>in</strong>gdecisions made us<strong>in</strong>g this data if it is to <strong>be</strong> justified as cost effectiveFault pick<strong>in</strong>g: notoriously tedious and repetitive.How much time do <strong>in</strong>terpreters spend on <strong>in</strong>terpret<strong>in</strong>g faults <strong>in</strong> a typical project? Clearly this is dependent onthe <strong>in</strong>tr<strong>in</strong>sic structural complexity of the project area, the seismic data quality, the objective of the<strong>in</strong>terpretation and the time available. A recent survey we conducted posed the question, ‟How much time doyou spend <strong>in</strong> <strong>in</strong>terpret<strong>in</strong>g faults <strong>in</strong> a typical project?‟ The respondents replied with a range of from 10% to75% of total project time. For <strong>in</strong>terpreters work<strong>in</strong>g the North Sea and Gulf of Mexico, the range was from30% to 60%. For <strong>in</strong>terpreters build<strong>in</strong>g detailed 3D models of fields the range was from 40%-70%. The otheraspect polled was that fault pick<strong>in</strong>g was seen as extremely tedious and repetitive. This is the k<strong>in</strong>d of activitythat cries out to <strong>be</strong> automated <strong>in</strong> order to release time for more evaluative and creative <strong>in</strong>terpretation tasks.Problems of automat<strong>in</strong>g fault <strong>in</strong>terpretationConventional manual seismic <strong>in</strong>terpretation methods on 3D data use a mixture of disparate visual clues andmental models to recognise and <strong>in</strong>terpret faults. These <strong>in</strong>clude direct fault plane reflections and diffractions,changes <strong>in</strong> reflector cont<strong>in</strong>uity, offsett<strong>in</strong>g patterns <strong>in</strong> reflector shape either side of a fault and subtle amplitudeand phase changes. Good quality seismic data is a major help as is <strong>in</strong>terpretational experience <strong>in</strong>clud<strong>in</strong>g agood knowledge of structural geology and tectonics. In general it is difficult to produce globally applicablerules for identify<strong>in</strong>g <strong>in</strong>dividual faults and comb<strong>in</strong><strong>in</strong>g them to produce a coherent fault pattern. Develop<strong>in</strong>grobust algorithmic approaches to automat<strong>in</strong>g the fault <strong>in</strong>terpretation process is not trivial therefore.Fault methodologyGeoscientists at IKON Science have developed a robust software workflow, which has <strong>be</strong>en applied to datafrom a wide variety of sett<strong>in</strong>gs and data quality with good results.3D seismic reflectance data is processed to enhance the characteristic discont<strong>in</strong>uities. There are a num<strong>be</strong>rof methods to achieve this <strong>in</strong>clud<strong>in</strong>g 3D-DipAzimuth, Manhattan difference algorithms and comb<strong>in</strong>ations ofs<strong>in</strong>gle attributes to produce special meta-attributes.Image process<strong>in</strong>g methods <strong>in</strong>itially developed <strong>in</strong> medical applications are applied to isolate and detect faultlike features. The <strong>in</strong>terpreter can then apply statistical filters, 3D visualisation and user controlled analysis topass or reject potential fault candidates (Figure <strong>12</strong>).Prediction and Productivity improvements <strong>in</strong> Quantitative Interpretation via rock physics modell<strong>in</strong>g and<strong>in</strong>terpreter led automation.© Ikon Science Limited, 2001-2009 All right reserved8
F<strong>in</strong>d<strong>in</strong>gF<strong>in</strong>d<strong>in</strong>g oil starts with the rocksRock physics – <strong>in</strong>version – pressure prediction – prospect generation and evaluationFigure <strong>12</strong>. Auto picked faults colour coded by azimuthCandidate fault planes can <strong>be</strong> produced and modified jo<strong>in</strong>ed and expanded until the <strong>in</strong>terpreter is satisfiedand the fault model is output <strong>in</strong>to a modell<strong>in</strong>g system, conventional <strong>in</strong>terpretation environment or visionarium(Figure 13). Results show that the process is robust <strong>in</strong> the presence of noise and that that this system cantypically reduce the time taken for fault <strong>in</strong>terpretation <strong>in</strong> a North Sea or Gulf of Mexico sett<strong>in</strong>g by an order ofmagnitude. In a typical project this can save weeks or even months of <strong>in</strong>terpreter time.Figure 13. Auto picked fault planes superimposed upon orig<strong>in</strong>al reflectance data for <strong>in</strong>terpreter QC.In a typical oil company environment where an <strong>in</strong>terpreter at <strong>be</strong>st may spend less than 50% of their timedo<strong>in</strong>g <strong>in</strong>terpretation the relative sav<strong>in</strong>g and productivity <strong>in</strong>crease will <strong>be</strong> much more and the time saved canstart to seriously impact and improve project economics. Other <strong>be</strong>nefits are the objective and repeatablenature of the process and the quantitative nature of the results which may enable advances <strong>in</strong> understand<strong>in</strong>gother spatial properties such as anisotropy and stress.ConclusionsThe value add<strong>in</strong>g process that reservoir geoscientists can uniquely make has to come from new<strong>in</strong>terpretation technologies. I.e. creative ideas from with<strong>in</strong> the science that will generate the next leapforward. We <strong>be</strong>lieve that rock physics modell<strong>in</strong>g and automated <strong>in</strong>terpretation methods offer this potential forreservoir geoscientists by improv<strong>in</strong>g seismic prediction on the one hand and unlock<strong>in</strong>g <strong>in</strong>terpreters from thedrudgery of manual Interpretation methods on the other.Prediction and Productivity improvements <strong>in</strong> Quantitative Interpretation via rock physics modell<strong>in</strong>g and<strong>in</strong>terpreter led automation.© Ikon Science Limited, 2001-2009 All right reserved9
F<strong>in</strong>d<strong>in</strong>gF<strong>in</strong>d<strong>in</strong>g oil starts with the rocksRock physics – <strong>in</strong>version – pressure prediction – prospect generation and evaluationAcknowledgmentsThe authors acknowledge TGS NOPEC for permission to publish the seismic data and Henry Morris ofImperial College London for provid<strong>in</strong>g the 4D models.ReferencesCitron, G.P., and Rose, P.R., 2001. Challenges with amplitude-<strong>be</strong>ar<strong>in</strong>g, multiple zone prospects. TheLead<strong>in</strong>g Edge, August.Parker J.R., Bertelli, L and P.Dromgoole 2003. 4D seismic technology special issue. Petroleum Geoscience9 (1), p1-111.Publication HistoryFirst Break Volume 21 Septem<strong>be</strong>r 2003Prediction and Productivity improvements <strong>in</strong> Quantitative Interpretation via rock physics modell<strong>in</strong>g and<strong>in</strong>terpreter led automation.© Ikon Science Limited, 2001-2009 All right reserved10