Robert Thresher, U.S. National Renewable Energy Laboratory
Robert Thresher, U.S. National Renewable Energy Laboratory
Robert Thresher, U.S. National Renewable Energy Laboratory
- No tags were found...

Create successful ePaper yourself
Turn your PDF publications into a flip-book with our unique Google optimized e-Paper software.
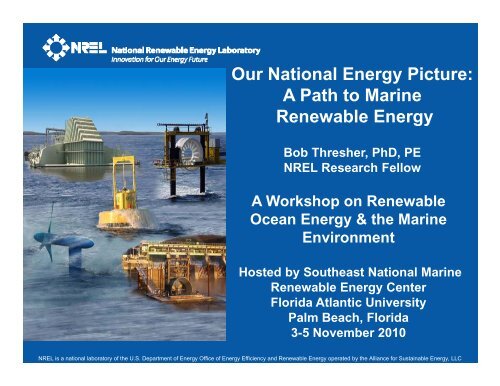
Our <strong>National</strong> <strong>Energy</strong> Picture:A Path to Marine<strong>Renewable</strong> <strong>Energy</strong>Bob <strong>Thresher</strong>, PhD, PENREL Research FellowA Workshop on <strong>Renewable</strong>Ocean <strong>Energy</strong> & the MarineEnvironmentHosted by Southeast <strong>National</strong> Marine<strong>Renewable</strong> <strong>Energy</strong> CenterFlorida Atlantic UniversityPalm Beach, Florida3-5 November 2010NREL is a national laboratory of the U.S. Department of <strong>Energy</strong> Office of <strong>Energy</strong> Efficiency and <strong>Renewable</strong> <strong>Energy</strong> operated by the Alliance for Sustainable <strong>Energy</strong>, LLC
World Primary <strong>Energy</strong> Demand is Growing<strong>National</strong> <strong>Renewable</strong> <strong>Energy</strong> <strong>Laboratory</strong><strong>National</strong> <strong>Renewable</strong> <strong>Energy</strong> <strong>Laboratory</strong>Source: IEA World <strong>Energy</strong> Outlook 2008Innovation for Our <strong>Energy</strong> Future
GDP Per Capita ($0 000/perso on)Affluence Requires <strong>Energy</strong> –Poverty Breeds Global Insecurity100101PovertyBurkina FasoEl SalvadorBangladeshJapanFranceUnited KingdomMexicoChinaAffluencePolandUnited StatesSouth KoreaRussia0.10.1 1 10 100 1000<strong>National</strong> <strong>Renewable</strong> <strong>Energy</strong> <strong>Laboratory</strong><strong>Energy</strong> Consumption Per Capita ('000 BTU/person)Source: <strong>Energy</strong> Information Administration, International <strong>Energy</strong> Annual 2000 Tables E1, B1, B2;Gross Domestic Product per capita is for 2000 in 1995 dollars.Updated May 2002Innovation for Our <strong>Energy</strong> Future
120The U.S. <strong>Energy</strong> Picture 1850-2008100Non-hydro<strong>Renewable</strong>sBTUsTWh)drillion Buad = 293TQuad(1 Qu80604020HydroNuclearNaturalGasCrude OilCoal01850 1860 1870 1880 1890 1900 1910 1920 1930 1940 1950 1960 1970 1980 1990 2000Source: 1850-1949, <strong>Energy</strong> Perspectives: A Presentation of Major <strong>Energy</strong> and <strong>Energy</strong>-Related Data, U.S. Department of the Interior, 1975; 1950-1996, Annual <strong>Energy</strong> Review 1996, Table 1.3. Note: Between 1950 and 1990, there was no reporting of non-utility use of renewables. 1997-2008,Annual <strong>Energy</strong> Review 2008, Table F1b.<strong>National</strong> <strong>Renewable</strong> <strong>Energy</strong> <strong>Laboratory</strong>Innovation for Our <strong>Energy</strong> Future
<strong>Renewable</strong> <strong>Energy</strong> Usage in the United States is 8%Source: IEA 2009<strong>National</strong> <strong>Renewable</strong> <strong>Energy</strong> <strong>Laboratory</strong>Innovation for Our <strong>Energy</strong> Future
Concentration of Greenhouse Gases is IncreasingSource: IPCC Report 2007b<strong>National</strong> <strong>Renewable</strong> <strong>Energy</strong> <strong>Laboratory</strong>Innovation for Our <strong>Energy</strong> Future
Will the Climate Stabilize and at What Level?Source: IPCC 2007b<strong>National</strong> <strong>Renewable</strong> <strong>Energy</strong> <strong>Laboratory</strong>Innovation for Our <strong>Energy</strong> Future
Possible Climate Change Impacts by 2100Possible changes in percentages of breedingNeotroptical migrant species in the next 100years (Price and Root 2001).Possible change (%)GrossNetCalifornia -29 -6Eastern Midwest -57 -30Great Lakes -53 -29Great Plains – Central -44 -8Great Plains – Northern -44 -10Great Plains – Southern -32 -14Mid-Atlantic -45 -23New England -44 -15Pacific Northwest -32 -16Rocky Mountains -39 -10Southeast -37 -22Southwest -29 -4Global Climate Change and Wildlife in North America. The Wildlife Society Technical Review 04-2 2004.<strong>National</strong> <strong>Renewable</strong> <strong>Energy</strong> <strong>Laboratory</strong>Innovation for Our <strong>Energy</strong> Future
Electric Potential for U.S. Extractable Ocean RE Resource is SignificantU.S. Electricity Usage is ~ 4000TWh/year2500200015001000500Terawatt-hrs/yearOffshore Wind 60m-900m (1)Offshore Wind 30m-60m (2)Offshor hore Wind < 30m shallow (3)Wave <strong>Energy</strong> (4)Tidal and Stream (5)Ocean Current (6)Ocean Therm rmal <strong>Energy</strong> Conversion (7)0Source: <strong>Thresher</strong> & Musial, Oceanography Magazine, June 2010<strong>National</strong> <strong>Renewable</strong> <strong>Energy</strong> <strong>Laboratory</strong> Innovation for Our <strong>Energy</strong> Future
The Vision for the U.S. Marine <strong>Energy</strong> Roadmap• To establish a commercially viable marine renewable energy industrythat is supplied by a robust U.S. manufacturing chain generatingdomestic jobs that t can compete on a level l playing field with otherenergy sources to serve both domestic and internationalmarketplaces in 2030.•To deploy a total of 20 GW of combined marine renewable energycapacity in an economically, environmentally, and sociallyresponsible manner by 2030.• To realize this vision, the MHK industry needs support to perfect thetechnology through R&D, financial incentives for early stagedeployment, and siting and permitting requirements that are bothtimely and affordable.<strong>National</strong> <strong>Renewable</strong> <strong>Energy</strong> <strong>Laboratory</strong>Innovation for Our <strong>Energy</strong> Future
A Deployment Scenario to 2030<strong>National</strong> <strong>Renewable</strong> <strong>Energy</strong> <strong>Laboratory</strong>Innovation for Our <strong>Energy</strong> Future
Commercial Strategy & Deployment Scenario<strong>National</strong> <strong>Renewable</strong> <strong>Energy</strong> <strong>Laboratory</strong>Innovation for Our <strong>Energy</strong> Future
Environmental Research<strong>National</strong> <strong>Renewable</strong> <strong>Energy</strong> <strong>Laboratory</strong>Innovation for Our <strong>Energy</strong> Future
The Roadmaps Scope of Environmental Studies– Benthic Surveys• Benthic organisms (Plants, algae, invertebrates, and fish)• Bottom geology (sediment, rocks, etc)• Scour protection– Water Column Surveys• Fish• Habitat• Mammals• Birds• Invertebratest• Turtles• Noise• EMF– Water Quality Surveys• Chemical• Sediment Transport<strong>National</strong> <strong>Renewable</strong> <strong>Energy</strong> <strong>Laboratory</strong>Ocean <strong>Renewable</strong> <strong>Energy</strong> CoalitionInnovation for Our <strong>Energy</strong> Future
Marine <strong>Renewable</strong> Technologies in DevelopmentSource: IEA – OES Report Global Technology Status 2009<strong>National</strong> <strong>Renewable</strong> <strong>Energy</strong> <strong>Laboratory</strong>Innovation for Our <strong>Energy</strong> Future
Marine <strong>Renewable</strong> Technology MaturitySource: IEA – OES Report Global Technology Status 2009<strong>National</strong> <strong>Renewable</strong> <strong>Energy</strong> <strong>Laboratory</strong>Innovation for Our <strong>Energy</strong> Future
DOE Hydrokinetic Technology Readiness LevelsConcept DesignDOE TRL 1‐3Discovery / ConceptDefinition / Early StageDevelopment, Designand EngineeringPart‐Scale (Tank)DOE TRL 4Proof of ConceptPart‐Scale (Tank/Sea)DOE TRL 5/6System Integration and<strong>Laboratory</strong> DemonstrationNear to Full Scale<strong>National</strong> <strong>Renewable</strong> <strong>Energy</strong> <strong>Laboratory</strong>DOE TRL 7/8:Open Water System Testing,Demonstration, and OperationPre‐CommercialDOE TRL 9:Array TestingCommercialDOE TRL 10:Innovation for Our <strong>Energy</strong> Future
An EU Story Demonstrating How Ocean Testing Drives InnovationYou Learn More Faster by Doing!24m/MWInnovationstDevice Capital Co2 Years of OceanTesting & Redesign7m/MWDesignRefinementIncrementalEvolutionProduction Learning3m/MWGoal1.6m/MW1 2 4 n thPrototype Units Built & Open Sea Tested<strong>National</strong> <strong>Renewable</strong> <strong>Energy</strong> <strong>Laboratory</strong>Innovation for Our <strong>Energy</strong> Future
The EU Suite of Protocols for Developing Marine <strong>Renewable</strong>sSource: EquiMar at http://www.equimar.org/<strong>National</strong> <strong>Renewable</strong> <strong>Energy</strong> <strong>Laboratory</strong>Innovation for Our <strong>Energy</strong> Future
IEA Ocean <strong>Energy</strong> Development Protocols1.1 Generic and site related wavedata1.2 Guidance for assessing tidalcurrent energy resource2.1 Wave energy developmentprotocol2.2 Tidal energy developmentprotocol3.1 Preliminary wave energydevice performance protocol3.2 Preliminary tidal energy deviceperformance protocol3.3 Guidelines for design basis ofmarine energy convertershttp://www.iea-oceans.org/publications.asp?id=8<strong>National</strong> <strong>Renewable</strong> <strong>Energy</strong> <strong>Laboratory</strong>Innovation for Our <strong>Energy</strong> Future
Watch This Space for Marine <strong>Energy</strong> International StandardsIEC TC 114 in Development• Terminology for Marine<strong>Energy</strong> (IEC TS 62600-1)• Wave and Tidal <strong>Energy</strong>Resource Characterizationand Assessment (IEC TS62600-3)• Performance Assessment ofWave <strong>Energy</strong> Converters(IEC TS 62600-100)• Performance Assessment ofTidal <strong>Energy</strong> Converters(IEC TS 62600-200)http://www.iec.ch/dyn/www/f?p=102:7:0::::FSP_ORG_ID:1316<strong>National</strong> <strong>Renewable</strong> <strong>Energy</strong> <strong>Laboratory</strong>Innovation for Our <strong>Energy</strong> Future
The EU Process for Environmental ConsentsAgain the Philosophy: Learn by doing!Source: EquiMar, Teresa Simas – EquiMar Workshop Oct 2010<strong>National</strong> <strong>Renewable</strong> <strong>Energy</strong> <strong>Laboratory</strong>Innovation for Our <strong>Energy</strong> Future
Life Cycle <strong>Energy</strong> and Greenhouse Gas ComparisonsSource: EquiMar draft protocol on Life Cycle Assessment http://www.equimar.org/<strong>National</strong> <strong>Renewable</strong> <strong>Energy</strong> <strong>Laboratory</strong>Innovation for Our <strong>Energy</strong> Future
Uncertain of the Significance of the Environmental ImpactsSource: EquiMar draft protocol on Environmental Uncertainties http://www.equimar.org/<strong>National</strong> <strong>Renewable</strong> <strong>Energy</strong> <strong>Laboratory</strong>Innovation for Our <strong>Energy</strong> Future
Uncertain Environmental Impacts (Continued)<strong>National</strong> <strong>Renewable</strong> <strong>Energy</strong> <strong>Laboratory</strong>Innovation for Our <strong>Energy</strong> Future
Ocean <strong>Energy</strong> Can Have Local Economic BenefitsA Wind <strong>Energy</strong> Example: Minnesota Local Economic Impactsfrom 1000 MW of new wind developmentWind energy’s economic “ripple effect”Direct ImpactsPayments to Landowners:• $2.7 million/yearLocal Property Tax Revenue:• $2.8 million/yearConstruction Phase:• 1455 new jobs• $188.5 M to local economiesOperational Phase:• 232 new long-term jobs• $21.2 M/yr to local economiesIndirect &Induced ImpactsConstruction Phase:• 1530 new jobs• $150.6 M to localeconomiesOperational Phase:• 177 local jobs• $18.2 M/yr to localeconomiesTotals(construction + 20yrs)Total economic benefit =$1.1 billionNew local jobs duringconstruction = 2985New local long-term jobs= 409Construction Phase = 1-2 yearsOperational Phase = 20+ years<strong>National</strong> <strong>Renewable</strong> <strong>Energy</strong> <strong>Laboratory</strong>Innovation for Our <strong>Energy</strong> Future
The Manufacturing Supply Chain Can Have <strong>National</strong> Benefits<strong>National</strong> <strong>Renewable</strong> <strong>Energy</strong> <strong>Laboratory</strong>Innovation for Our <strong>Energy</strong> Future
The Decision to Develop and Deploy Marine <strong>Energy</strong>:Requires Balancing the Risks and BenefitsThe Current <strong>Energy</strong> PathDeveloping Marine <strong>Renewable</strong>s• Importing petroleum products• A new unproven technology• Low current cost technology• High initial iti cost technology• High greenhouse gas emissions• Secure domestic energy supply• Increasing competition for resources• High economic development potential••Predictions of high environmental impactsProjected future costs increasing i••Domestic jobs generation potentialUncertain future environmental impacts<strong>National</strong> <strong>Renewable</strong> <strong>Energy</strong> <strong>Laboratory</strong>Innovation for Our <strong>Energy</strong> Future
Our Cyclic <strong>Energy</strong> Policy 1970s Version<strong>National</strong> <strong>Renewable</strong> <strong>Energy</strong> <strong>Laboratory</strong>Innovation for Our <strong>Energy</strong> Future
Questions?<strong>Robert</strong> W. <strong>Thresher</strong>, NREL Research Fellow<strong>Robert</strong>.<strong>Thresher</strong>@nrel.govDraft U.S. Marine <strong>Energy</strong> Roadmap posted at:http://www.oceanrenewable.com/press-room/<strong>National</strong> <strong>Renewable</strong> <strong>Energy</strong> <strong>Laboratory</strong>Innovation for Our <strong>Energy</strong> Future