Coastal Impacts, Adaptation, and Vulnerabilities - Climate ...
Coastal Impacts, Adaptation, and Vulnerabilities - Climate ...
Coastal Impacts, Adaptation, and Vulnerabilities - Climate ...

Create successful ePaper yourself
Turn your PDF publications into a flip-book with our unique Google optimized e-Paper software.
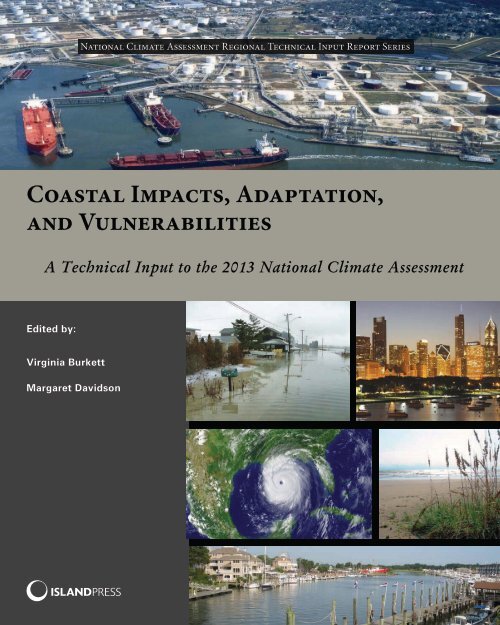
National <strong>Climate</strong> Assessment Regional Technical Input Report Series<strong>Coastal</strong> <strong>Impacts</strong>, <strong>Adaptation</strong>,<strong>and</strong> <strong>Vulnerabilities</strong>A Technical Input to the 2013 National <strong>Climate</strong> AssessmentEdited by:Virginia BurkettMargaret Davidson
<strong>Coastal</strong> <strong>Impacts</strong>, <strong>Adaptation</strong>,<strong>and</strong> <strong>Vulnerabilities</strong>A Technical Input to the2013 National <strong>Climate</strong> Assessment
© 2012 The National Oceanic <strong>and</strong> Atmospheric AdministrationAll rights reserved under International <strong>and</strong> Pan-American Copyright Conventions.Reproduction of this report by electronic means for personal <strong>and</strong> noncommercial purposesis permitted as long as proper acknowledgement is included. Users are restricted fromphotocopying or mechanical reproduction as well as creating derivative works for commercialpurposes without the without the prior written permission of the publisher.ISLAND PRESS is a trademark of the Center for Resource Economics.Printed on recycled, acid-free paperManufactured in the United States of AmericaSuggested Citation: Burkett, V.R. <strong>and</strong> Davidson, M.A. [Eds.]. (2012). <strong>Coastal</strong> <strong>Impacts</strong>,<strong>Adaptation</strong> <strong>and</strong> Vulnerability: A Technical Input to the 2012 National <strong>Climate</strong> Assessment.Cooperative Report to the 2013 National <strong>Climate</strong> Assessment, pp. 150.Keywords: <strong>Climate</strong> change, climate variability, coasts, coastal region, coastal inundation,sea-level rise, adaptation, climate risks, extreme events, climate change indicators, decisionmaking, vulnerability, mitigation, coastal ecosystems, sea surface temperature, precipitation,ocean waves, ocean circulation patterns, coastal erosion, flooding, saltwater intrusion, socialvulnerabilityThis Technical Input was produced by a team of experts at the request of the NCADevelopment <strong>and</strong> Advisory Committee. It will be available for use as reference material by allNCA author teams.The scientific results <strong>and</strong> conclusions, as well as any views or opinions expressed herein, arethose of the author(s) <strong>and</strong> do not necessarily reflect the views of NOAA or the Department ofCommerce.Date Submitted to the NCA Development <strong>and</strong> Advisory Committee:October 12, 2012Editorial Support:The Stiefel GroupTechnical Input Coordinating Lead Author Contact Information:Virginia Burkett: virginia_burkett@usgs.govMargaret Davidson: margaret.davidson@noaa.govFront Cover Images: Courtesy of National Oceanic <strong>and</strong> Atmospheric Administration
About This SeriesThis report is published as one of a series of technical inputs to the National <strong>Climate</strong>Assessment (NCA) 2013 report. The NCA is being conducted under the auspices of theGlobal Change Research Act of 1990, which requires a report to the President <strong>and</strong> Congressevery four years on the status of climate change science <strong>and</strong> impacts. The NCA informsthe nation about already observed changes, the current status of the climate, <strong>and</strong>anticipated trends for the future. The NCA report process integrates scientific informationfrom multiple sources <strong>and</strong> sectors to highlight key findings <strong>and</strong> significant gaps inour knowledge. Findings from the NCA provide input to federal science priorities <strong>and</strong>are used by U.S. citizens, communities <strong>and</strong> businesses as they create more sustainable<strong>and</strong> environmentally sound plans for the nation’s future.In fall of 2011, the NCA requested technical input from a broad range of experts inacademia, private industry, state <strong>and</strong> local governments, non-governmental organizations,professional societies, <strong>and</strong> impacted communities, with the intent of producinga better informed <strong>and</strong> more useful report in 2013. In particular, the eight NCA regions,as well as the <strong>Coastal</strong> <strong>and</strong> the Ocean biogeographical regions, were asked to contributetechnical input reports highlighting past climate trends, projected climate change, <strong>and</strong>impacts to specific sectors in their regions. Each region established its own process fordeveloping this technical input. The lead authors for related chapters in the 2013 NCAreport, which will include a much shorter synthesis of climate change for each region,are using these technical input reports as important source material. By publishing thisseries of regional technical input reports, Isl<strong>and</strong> Press hopes to make this rich collectionof information more widely available.This series includes the following reports:<strong>Climate</strong> Change <strong>and</strong> Pacific Isl<strong>and</strong>s: Indicators <strong>and</strong> <strong>Impacts</strong><strong>Coastal</strong> <strong>Impacts</strong>, <strong>Adaptation</strong>, <strong>and</strong> <strong>Vulnerabilities</strong>Great Plains Regional Technical Input Report<strong>Climate</strong> Change in the Midwest: A Synthesis Report for the National <strong>Climate</strong> Assessment<strong>Climate</strong> Change in the Northeast: A Sourcebook<strong>Climate</strong> Change in the Northwest: Implications for Our L<strong>and</strong>scapes, Waters, <strong>and</strong> CommunitiesOceans <strong>and</strong> Marine Resources in a Changing <strong>Climate</strong><strong>Climate</strong> of the Southeast United States: Variability, Change, <strong>Impacts</strong>, <strong>and</strong> VulnerabilityAssessment of <strong>Climate</strong> Change in the Southwest United StatesElectronic copies of all reports can be accessed on the <strong>Climate</strong> <strong>Adaptation</strong> KnowledgeExchange (CAKE) website at www.cakex.org/NCAreports. Printed copies are available forsale on the Isl<strong>and</strong> Press website at www.isl<strong>and</strong>press.org/NCAreports.
<strong>Coastal</strong> <strong>Impacts</strong>, <strong>Adaptation</strong>,<strong>and</strong> <strong>Vulnerabilities</strong>A Technical Input to the2013 National <strong>Climate</strong> AssessmentCoordinating Lead AuthorsVirginia BurkettU.S. Geological SurveyMargaret DavidsonNational Oceanic <strong>and</strong> Atmospheric AdministrationWashington | Covelo | London
AuthorsChapter 1Lead Author: Mary Culver, National Oceanic <strong>and</strong> Atmospheric AdministrationBritta Bierwagen, U.S. Environmental Protection AgencyVirginia Burkett, U.S. Geological SurveyRalph Cantral, National Oceanic <strong>and</strong> Atmospheric AdministrationMargaret A. Davidson, National Oceanic <strong>and</strong> Atmospheric AdministrationHilary Stockdon, U.S. Geological SurveyChapter 2Lead Author: S. Jeffress Williams, U.S. Geological SurveyDavid Atkinson, University of VictoriaAaron R. Byrd, U.S. Army Corps of EngineersHajo Eicken, University of AlaskaTimothy M. Hall, National Oceanic <strong>and</strong> Atmospheric AdministrationThomas G. Huntington, U.S. Geological SurveyYongwon Kim, University of AlaskaThomas R. Knutson, National Oceanic <strong>and</strong> Atmospheric AdministrationJames P. Kossin, National Oceanic <strong>and</strong> Atmospheric AdministrationMichael Lilly, GW ScientificJohn J. Marra, National Oceanic <strong>and</strong> Atmospheric AdministrationJayantha Obeysekera, South Florida Water Management DistrictAdam Parris, National Oceanic <strong>and</strong> Atmospheric AdministrationJay Ratcliff, U.S. Army Corps of EngineersThomas Ravens, University of AlaskaDon Resio, University of North FloridaPeter Ruggiero, Oregon State UniversityE. Robert Thieler, U.S. Geological SurveyJames G. Titus, U.S. Environmental Protection AgencyTy V. Wamsley, U.S. Army Corps of Engineers
Chapter 3Lead Author: Carlton H. Hershner, Jr., Virginia Institute of Marine ScienceGrant Ballard, PRBO Conservation ScienceDonald R. Cahoon, U.S. Geological SurveyRobert Diaz, Virginia Institute of Marine ScienceTom Doyle, U.S. Geological SurveyNeil K. Ganju, U.S. Geological SurveyGlenn Guntenspergen, U.S. Geological SurveyRobert Howarth, Cornell UniversityHans W. Paerl, University of North CarolinaCharles “Pete” H. Peterson, University of North CarolinaJulie D. Rosati, U.S. Army Corps of EngineersHilary Stockdon, U.S. Geological SurveyRobert R. Twilley, Louisiana State UniversityJordan West, U.S. Environmental Protection AgencyChapter 4Lead Author: Tony MacDonald, Monmouth UniversityAustin Becker, Stanford UniversityDoug Bellomo, Federal Emergency Management AgencyVirginia Burkett, U.S. Geological SurveyJanet Cikir, National Park ServiceSusan L. Cutter, University of South CarolinaKirsten Dow, University of South CarolinaJohn A. Hall, U.S. Department of DefenseMaria G. Honeycutt, National Oceanic <strong>and</strong> Atmospheric AdministrationPhilip G. King, San Francisco State UniversityPaul H. Kirshen, University of New HampshireJim London, Clemson UniversityAaron McGregor, California Ocean Science TrustJeffrey A. Melby, U.S. Army Corps of EngineersLindene Patton, Zurich Insurance Group, Ltd.Edmond J. Russo, U.S. Army Corps of EngineersGavin Smith, University of North CarolinaCindy Thatcher, U.S. Geological SurveyJuli M. Trtanj, National Oceanic <strong>and</strong> Atmospheric Administration
Chapter 5Lead Author: Lara Hansen, EcoAdaptRebecca Beavers, National Park ServiceJeff Benoit, Restore America’s EstuariesDiana Bowen, <strong>Coastal</strong> States OrganizationEllie Cohen, PRBO Conservation ScienceMichael Craghan, U.S. Environmental Protection AgencySteve Emmett-Mattox, Restore America’s EstuariesZach Ferdana, The Nature ConservancyKristen Fletcher, <strong>Coastal</strong> States OrganizationStephen Gill, National Oceanic <strong>and</strong> Atmospheric AdministrationJessica Grannis, Georgetown UniversityRachel M. Gregg, EcoAdaptJennie Hoffman, EcoAdaptBrian Holl<strong>and</strong>, ICLEI – Local Governments for SustainabilityZoe Johnson, Maryl<strong>and</strong> Department of Natural ResourcesBenjamin L. Preston, Oak Ridge National LaboratoryDoug Marcy, National Oceanic <strong>and</strong> Atmospheric AdministrationJames Pahl, <strong>Coastal</strong> Protection <strong>and</strong> Restoration Authority of LouisianaRichard Raynie, <strong>Coastal</strong> Protection <strong>and</strong> Restoration Authority of LouisianaJohn Rozum, National Oceanic <strong>and</strong> Atmospheric Administration/NatureServeChapter 6Lead Author: S. Jeffress Williams, U.S. Geological SurveyCase StudyLead Authors: Susan Julius, U.S. Environmental Protection Agency (ChesapeakeBay) <strong>and</strong> Denise J. Reed, University of New Orleans (Gulf of Mexico)
ContentsKey TermsAcronymsCommunicating UncertaintyExecutive SummaryxviiixxxxiixxiiiChapter 1: Introduction <strong>and</strong> Context 11.1 Scope <strong>and</strong> Purpose 11.2 Linkages <strong>and</strong> Overlapping Topics of the NCA 21.3 Reliance on the <strong>Coastal</strong> Zone 4Increasing Population <strong>and</strong> Changing L<strong>and</strong> Use 4Changing <strong>Coastal</strong> Economy 6Resilience on <strong>Coastal</strong> Ecosystems 7Maintaining a Balance 8Chapter 2: Physical <strong>Climate</strong> Forces 102.1 Overview of <strong>Climate</strong> <strong>and</strong> Sea-level-rise Effects on Coasts 12Introduction 12<strong>Coastal</strong> L<strong>and</strong>forms <strong>and</strong> <strong>Coastal</strong> Change 14Sea-level Rise <strong>and</strong> Effects on Coasts 15Inundation, L<strong>and</strong> Loss, <strong>and</strong> L<strong>and</strong> Area Close to Present Sea Level 16Historic to Present-day Sea-level Rise 19Other <strong>Coastal</strong> <strong>Climate</strong> Change Trends 19The Basis for Concern 222.2 Sea-level Rise <strong>and</strong> Future Scenarios 23Scenario Planning 23Global Mean Sea-level Rise Scenarios 24Key Uncertainties on the Global Sea-level Rise Scenarios 24Ice Sheet Loss 26Developing Regional <strong>and</strong> Local Scenarios 272.3 Extreme Events <strong>and</strong> Future Scenarios 272.4 Changes in Wave Regimes <strong>and</strong> Circulation Patterns 31Wave Regimes 31Extratropical Storm Waves 32Tropical Cyclone Generated Waves 34<strong>Impacts</strong> 35Ocean Circulation 362.5 Relative Vulnerability of Coasts 37Physical Setting 37<strong>Climate</strong> <strong>and</strong> Non-climate Drivers 37Assessment Results 382.6 Changes in Precipitation Patterns 40
Intensification of the Hydrolic Cycle 41Changes in Precipitation Amount 42Increasing Variability in Precipitation 44Changes in Ratio of Snow to Total Precipitation 44Changes in Precipitation in <strong>Coastal</strong> Alaska 44Changes in Storm Tracks 45Droughts 45Heavy Rainfall <strong>and</strong> Floods 452.7 Temperature Change <strong>Impacts</strong> with a Focus on Alaska 46Temperature Trends 46Northern <strong>Coastal</strong> Response 47<strong>Impacts</strong> of <strong>Climate</strong> Change on <strong>Coastal</strong> Processes 49Chapter 3: Vulnerability <strong>and</strong> <strong>Impacts</strong> onNatural Resources 523.1 Multiple Stressors Interact at the Coast 53Costal Freshwater Availability Threatened by Multi-stressor Interactions 53Estuarine Water Quality Comprised by Multiple <strong>Climate</strong> Drivers 553.2 Biota, Habitats, <strong>and</strong> <strong>Coastal</strong> L<strong>and</strong>forms that Are Impacted by ComplexStressor Interactions <strong>and</strong> Subject to Nonlinear Changes <strong>and</strong> Tipping Points 57Wetl<strong>and</strong>s 57Mangroves 58<strong>Coastal</strong> Forests 60Estuaries <strong>and</strong> <strong>Coastal</strong> Lagoons 60Barrier Isl<strong>and</strong>s 61Deltas 62Mudflats 63Rocky Shores 63Sea-ice Systems 64Conclusions 65Chapter 4: Vulnerability <strong>and</strong> <strong>Impacts</strong> onHuman Development 664.1 Overview of <strong>Impacts</strong> on Human Development <strong>and</strong>Societal Vulnerability 674.2 Relative Vulnerability, Exposure, <strong>and</strong> Human Losses 684.3 Socio-Economic <strong>Impacts</strong> <strong>and</strong> Implications 70Urban Centers 70Transportation, Ports, <strong>and</strong> Navigation 71Water Resources <strong>and</strong> Infrastructure 73Tourism, Recreation, <strong>and</strong> Cultural Resources 74Real Estate 76Private <strong>and</strong> Public Insurance 79Emergency Response, Recovery, <strong>and</strong> Vulnerability Reduction 82<strong>Coastal</strong> <strong>and</strong> Nearshore Oil <strong>and</strong> Gas 84
4.4 Human Health <strong>Impacts</strong> <strong>and</strong> Implications 87Direct <strong>Impacts</strong> 88Indirect <strong>Impacts</strong> 894.5 Implications for <strong>Coastal</strong> Military Installations <strong>and</strong> Readiness 92<strong>Coastal</strong> Military Installation <strong>Climate</strong>- <strong>and</strong> Global-change Challenges 92<strong>Coastal</strong> Installation <strong>Vulnerabilities</strong> <strong>and</strong> Combat ServiceSupport Readiness 94Operations <strong>and</strong> Training Readiness <strong>and</strong> Natural Resource <strong>Impacts</strong> 95DoD Requirements <strong>and</strong> Programs for Vulnerability <strong>and</strong> ImpactAssessments <strong>and</strong> <strong>Adaptation</strong> Planning 96Chapter 5: <strong>Adaptation</strong> <strong>and</strong> Mitigation 985.1 <strong>Adaptation</strong> Planning in the <strong>Coastal</strong> Zone 98Background on <strong>Adaptation</strong> Planning 99Inventory of <strong>Adaptation</strong> Planning 99The Status of <strong>Coastal</strong> <strong>Adaptation</strong> Planning 102Strengths of <strong>Coastal</strong> <strong>Adaptation</strong> Planning 102Emerging Planning Practice 103<strong>Adaptation</strong> Planning Challenges 1045.2 <strong>Coastal</strong> Resource Management <strong>and</strong> Restoration in theContext of <strong>Climate</strong> Change 105<strong>Climate</strong> Change Considerations for <strong>Coastal</strong> ResourceManagement <strong>and</strong> Restoration 105Challenges, Needs, <strong>and</strong> Opportunities 1075.3 Tools <strong>and</strong> Resources 109Assessment <strong>and</strong> Implementation Tools 110Selecting <strong>and</strong> Using Tools Appropriately 111Policy <strong>and</strong> Regulatory Tools 1135.4 <strong>Coastal</strong> Mitigation Opportunities 114<strong>Coastal</strong> Renewable Technologies 114<strong>Coastal</strong> Renewable Energy Science Gaps 115Managing Living <strong>Coastal</strong> Resources for Carbon Capture 116Carbon Sequestration <strong>and</strong> Capture Science Gaps 118Chapter 6: Information Gaps <strong>and</strong> Science Needed toSupport Sustainable Coasts 1196.1 Science Research Needs to Support Sustainable <strong>Coastal</strong> Management 119Science-based Tools Needed for <strong>Coastal</strong> Management <strong>and</strong><strong>Adaptation</strong> Planning 122Future Research – Local vs. Regional Studies, Infrastructure,Monitoring, <strong>and</strong> Co-benefits 124Appendix A: Chesapeake Bay Case Study 125Appendix B: Gulf of Mexico Case Study 141ReferenceS 144
Key Terms<strong>Adaptation</strong> 1 – Adjustment in natural or human systems to moderate harm or exploitbeneficial opportunity in response to actual or expected climatic stimuli or their effects.Various types of adaptation can be distinguished, including anticipatory, autonomous,<strong>and</strong> planned adaptation:• Anticipatory adaptation – <strong>Adaptation</strong> that takes place before impacts of climatechange are observed. Also referred to as proactive adaptation.• Autonomous adaptation – <strong>Adaptation</strong> that does not constitute a consciousresponse to climatic stimuli but instead is triggered by ecological changes innatural systems <strong>and</strong> by market or welfare changes in human systems. Alsoreferred to as spontaneous adaptation.• Planned adaptation – <strong>Adaptation</strong> as the result of a deliberate policy decisionbased on an awareness that conditions have changed or are about to change <strong>and</strong>that action is required to return to, maintain, or achieve a desired state.<strong>Climate</strong> 1 – <strong>Climate</strong> in a narrow sense is usually defined as the average weather or, morerigorously, as the statistical description in terms of the mean <strong>and</strong> variability of relevantquantities over a period of time ranging from months to thous<strong>and</strong>s or millions of years.These quantities are most often surface variables such as temperature, precipitation, <strong>and</strong>wind. <strong>Climate</strong> in a wider sense is the state, including a statistical description, of the climatesystem. The classical period of time is 30 years as defined by the World MeteorologicalOrganization (WMO).<strong>Climate</strong> Change 1 – <strong>Climate</strong> change refers to any change in climate over time due to naturalvariability or human activity.Disaster 2 – Severe alterations in the normal functioning of a community or a societyresulting from the interaction of hazardous physical events <strong>and</strong> vulnerable social conditionsthat leads to widespread adverse human, material, economic, or environmentaleffects that require immediate emergency response to satisfy critical human needs <strong>and</strong>that may require external support for recovery.Disaster Risk – The likelihood over a specified time period of severe alterations in thenormal functioning of a community or a society resulting from the interaction of hazardousphysical events <strong>and</strong> vulnerable social conditions that leads to widespread adversehuman, material, economic, or environmental effects that require immediate emergencyresponse to satisfy critical human needs <strong>and</strong> that may require external support forrecovery.1 IPCC, 2007: <strong>Climate</strong> Change 2007: <strong>Impacts</strong>, <strong>Adaptation</strong> <strong>and</strong> Vulnerability. Contribution of Working GroupII to the Fourth Assessment Report of the Intergovernmental Panel on <strong>Climate</strong> Change, M.L. Parry, O.F.Canziani, J.P. Palutikof, P.J. van der Linden & C.E. Hanson, (Eds.), Cambridge University Press, Cambridge,UK, glossary, pp. 869-883.xviii2 IPCC, 2007: Contribution of Working Group III to the Fourth Assessment Report of the IntergovernmentalPanel on <strong>Climate</strong> Change, 2007. B. Metz, O.R. Davidson, P.R. Bosch, R. Dave, & L.A. Meyer (Eds.) CambridgeUniversity Press, Cambridge, United Kingdom <strong>and</strong> New York, NY, USA. Section 2.3.1.
Key TermsxixExposure 3 – The nature <strong>and</strong> degree to which a system is exposed to significant climaticvariations.Mainstreaming – The incorporation of climate change considerations into established orongoing development programs, policies, or management strategies rather than developingadaptation <strong>and</strong> mitigation initiatives separately.Mitigation 1 – An anthropogenic intervention to reduce the anthropogenic forcing of theclimate system, including strategies to reduce greenhouse gas sources <strong>and</strong> emissions<strong>and</strong> enhance greenhouse gas sinks.Resilience 2 – The ability of a system <strong>and</strong> its component parts to anticipate, absorb, accommodate,or recover from the effects of a hazardous event in a timely <strong>and</strong> efficientmanner through ensuring the preservation, restoration, or improvement of its essentialbasic structures <strong>and</strong> functions.Risk 3 – Combination of the probability of an event <strong>and</strong> its consequences.Sensitivity 1 – Sensitivity is the degree to which a system is affected either adversely orbeneficially by climate variability or change. The effect may be direct, such as a changein crop yield in response to a change in the mean, range, or variability of temperature,or indirect, such as damages caused by an increase in the frequency of coastal floodingdue to sea-level rise.Thermal Expansion 4 – In connection with sea level, this refers to the increase in volume(<strong>and</strong> decrease in density) that results from warming water. A warming of the oceanleads to an expansion of the ocean volume <strong>and</strong> hence an increase in sea level.Threshold 1 – The level of magnitude of a system process at which sudden or rapidchange occurs. A point or level at which new properties emerge in an ecological, economicor other system, invalidating predictions based on mathematical relationshipsthat apply at lower levels.Transformation 2 – The altering of fundamental attributes of a system (including valuesystems; regulatory, legislative, or bureaucratic regimes; financial institutions; <strong>and</strong> technologicalor biological systems).Vulnerability 1 – the degree to which a system is susceptible to, <strong>and</strong> unable to cope with,adverse effects of climate change, including climate variability <strong>and</strong> extremes. Vulnerabilityis a function of the character, magnitude, <strong>and</strong> rate of climate change <strong>and</strong> variationto which a system is exposed, its sensitivity, <strong>and</strong> its adaptive capacity.3 IPCC, 2001: <strong>Climate</strong> Change 2001: <strong>Impacts</strong>, <strong>Adaptation</strong>, <strong>and</strong> Vulnerability. J. J. McCarthy, O. F. Canziani, N.A. Leary, D. J. Dokken <strong>and</strong> K. S. White (eds) Cambridge University Press, Cambridge, United Kingdom <strong>and</strong>New York, NY, USA, glossary, pp. 982-996.4 IPCC, 2001: <strong>Climate</strong> Change 2001: The Scientific Basis. Contribution of Working Group I to the Third AssessmentReport of the Intergovernmental Panel on <strong>Climate</strong> Change [Houghton, J.T.,Y. Ding, D.J. Griggs,M. Noguer, P.J. van der Linden, X. Dai, K.Maskell, <strong>and</strong> C.A. Johnson (eds.)]. Cambridge University Press,Cambridge, United Kingdom <strong>and</strong> New York, NY, USA, glossary, pp. 787-797.
AcronymsADAPT – <strong>Adaptation</strong> Database <strong>and</strong> Planning ToolAMO – Atlantic Multidecadal OscillationBMP – Best Management PracticesCCSP – <strong>Climate</strong> Change Science ProgramCDC – Centers for Disease Control <strong>and</strong> PreventionCFD – Computational Fluid DynamicsCMIP – <strong>Climate</strong> Model Intercomparison ProjectCPIC – Citizens Property Insurance CorporationCPRA – <strong>Coastal</strong> Protection <strong>and</strong> Restoration AuthorityCSO – Combined Sewer OverflowCSoVI – <strong>Coastal</strong> Social VulnerabilityCVI – <strong>Coastal</strong> VulnerabilityDoD – U.S. Department of DefenseDOT – U.S. Department of TransportationENSO – El Niño Southern OscillationEPA – U.S. Environmental Protection AgencyESD – Environmental Site DesignFCIC – Federal Crop Insurance CorporationFEMA – Federal Emergency Management AgencyGCM – Global Circulation ModelsGDP – Gross Domestic ProductGIS – Geographic Information SystemsGPS – Global Positioning SystemHABs – Harmful Algal BloomsHUD – U.S. Housing <strong>and</strong> Urban DevelopmentICLEI – International Council for Local Environmental InitiativesIPCC – Intergovernmental Panel on <strong>Climate</strong> ChangeIWGCBC – International Working Group on <strong>Coastal</strong> Blue CarbonLiDAR – Light Detection <strong>and</strong> RangingMOC – Meridional Overturning CirculationMR&T – Mississippi River <strong>and</strong> TributariesMSL – Mean Sea Levelxx
AcronymsxxiNAO – North Atlantic OscillationNCA – National <strong>Climate</strong> AssessmentNFIP – National Flood Insurance ProgramNIC – National Intelligence CouncilNOAA – National Oceanic <strong>and</strong> Atmospheric AdministrationNREL – National Renewable Energy LaboratoryOCS – Outer Continental ShelfOREC – Ocean Renewable Energy CoalitionP&C – Property <strong>and</strong> Casualty InsurersPCC – Pacific Coast CollaborativePDO – Pacific Decadal OscillationPVI – Place Vulnerability IndexPWD – Philadelphia Water DepartmentSAV – Submerged Aquatic VegetationSLCS – Sea Level Change ScenariosSRES – Special Report on Emissions ScenariosTHC – Thermohaline CirculationUSACE – U.S. Army Corps of EngineersUSGCRP – U.S. Global Change Research ProgramVBZD – Vector-Borne <strong>and</strong> Zoonotic DiseaseVOS – Voluntary Observing ShipWAIS – West Antarctic Ice SheetWPCPs – Wastewater Pollution Control Plants
Communicating UncertainityBased on the Guidance Note for Lead Authors of the third U.S. National Assessment,this technical input document relies on two metrics to communicate the degree of certainty,based on author teams’ evaluations of underlying scientific underst<strong>and</strong>ing, inkey findings:• Confidence in the validity of a finding by considering (i) the quality of the evidence<strong>and</strong> (ii) the level of agreement among experts with relevant knowledge.Table 1: Communicating UncertainityConfidence levelFactors that could contribute to this confidence evaluationHighStrong evidence (established theory, multiple sources, consistentresults, well documented <strong>and</strong> accepted methods, etc.), high consensusModerateModerate evidence (several sources, some consistency, methods vary<strong>and</strong>/or documentation limited, etc.), medium consensusFairSuggestive evidence (a few sources, limited consistency, modelsincomplete, methods emerging, etc.), competing schools of thoughtLowInconclusive evidence (limited sources, extrapolations, inconsistentfindings, poor documentation <strong>and</strong>/or methods not tested, etc.),disagreement or lack of opinions among experts• Probabilistic estimate of uncertainty expressed in simple quantitative expressionsor both the quantitative expressions <strong>and</strong> the calibrated uncertainty terms.xxii
Executive Summaryxxvffffffffffffffof oceans acidification <strong>and</strong> rates of glacier <strong>and</strong> ice sheet melt. High Confidence.Most coastal l<strong>and</strong>forms, such as barrier isl<strong>and</strong>s, deltas, bays, estuaries, wetl<strong>and</strong>s,coral reefs, are highly dynamic <strong>and</strong> sensitive to even small changes in physicalforces <strong>and</strong> feedbacks such as warming, storms, ocean circulation, waves <strong>and</strong>currents, flooding, sediment budgets, <strong>and</strong> sea-level rise. High Confidence.The effects of sea-level rise on coasts vary considerably from region-to-region<strong>and</strong> over a range of spatial <strong>and</strong> temporal scales. L<strong>and</strong> subsidence in certain locationscauses relative sea-level rise to exceed global mean sea-level rise. L<strong>and</strong>uplift such as that found in Alaska <strong>and</strong> the Northwestern Pacific coast can reduceeffects of global mean rise. The effects will be greatest <strong>and</strong> most immediate onlow-relief, low-elevation parts of the U.S. coast along the Gulf of Mexico, mid-Atlantic states, northern Alaska, Hawaii, <strong>and</strong> isl<strong>and</strong> territories <strong>and</strong> especiallyon coasts containing deltas, coastal plains, tidal wetl<strong>and</strong>s, bays, estuaries, <strong>and</strong>coral reefs. Beaches <strong>and</strong> wetl<strong>and</strong>s on steep cliff coasts <strong>and</strong> shores backed withseawalls may be unable to move l<strong>and</strong>ward or maintain their l<strong>and</strong>form with sealevelrise. Many areas of the coast are especially vulnerable because of the oftendetrimental effects of development on natural processes. High Confidence.The gradual inundation from recent sea-level rise is evident in many regionssuch as the mid-Atlantic <strong>and</strong> Louisiana where high tides regularly flood roads<strong>and</strong> areas that were previously dry, <strong>and</strong> in st<strong>and</strong>s of “ghost forests,” in whichtrees are killed by intrusion of brackish water. High ConfidenceSea level change <strong>and</strong> storms are dominant driving forces of coastal change asobserved in the geologic record of coastal l<strong>and</strong>forms. Increasingly, sea-level risewill become a hazard for coastal regions because of continued global mean sealevelrise, including possibly accelerated rates of rise that increase risk to coastalregions. As the global climate continues to warm <strong>and</strong> ice sheets melt, coasts willbecome more dynamic <strong>and</strong> coastal cities <strong>and</strong> low-lying areas will be increasinglyexposed to erosion, inundation, <strong>and</strong> flooding. High Confidence.No coordinated, interagency process exists in the U.S. for identifying agreedupon global mean sea-level rise projections for the purpose of coastal planning,policy, or management, even though this is a critical first step in assessing coastalimpacts <strong>and</strong> vulnerabilities. High Confidence.Global sea level rose at a rate of 1.7 millimeters/year during the 20th century.The rate has increased to over 3 millimeters/year in the past 20 years <strong>and</strong> scientificstudies suggest high confidence (>9 in 10 chance) that global mean sea levelwill rise 0.2 to 2 meters by the end of this century. Some regions such as Louisiana<strong>and</strong> the Chesapeake Bay will experience greater relative rise due to factorssuch as l<strong>and</strong> subsidence, gravitational redistribution of ice-sheet meltwater,ocean circulation changes, <strong>and</strong> regional ocean thermostatic effects. Other regionsundergoing l<strong>and</strong> uplift, such as Alaska, will experience lesser sea-level rise. HighConfidence.Variability in the location <strong>and</strong> time-of-year of storm genesis can influence l<strong>and</strong>fallingstorm characteristics, <strong>and</strong> even small changes can lead to large changes inl<strong>and</strong>falling location <strong>and</strong> impact. Although scientists have only low confidence in
xxvi<strong>Coastal</strong> <strong>Impacts</strong>, <strong>Adaptation</strong>, <strong>and</strong> <strong>Vulnerabilities</strong>ffffffffthe sign of projected changes to the coast of storm-related hazards that dependon a combination of factors such as frequency, track, intensity, <strong>and</strong> storm size,any sea-level rise is virtually certain to exacerbate storm-related hazards. HighConfidence.Although sea-level rise <strong>and</strong> climate change have occurred in the past, theincreasing human presence in the coastal zone will make the impacts differentfor the future. L<strong>and</strong> use <strong>and</strong> other human activities often inhibit the naturalresponse of physical processes <strong>and</strong> adaptation by plants <strong>and</strong> animals. In someareas, erosion <strong>and</strong> wetl<strong>and</strong> loss are common because sediment budgets havebeen reduced, while, in other regions, excess sediment is in-filling harbors, channels,<strong>and</strong> bays. High Confidence.Observations continue to indicate an ongoing, warming-induced intensificationof the hydrologic cycle that will likely result in heavier precipitation events <strong>and</strong>,combined with sea-level rise <strong>and</strong> storm surge, an increased flooding severity insome coastal areas, particularly the northeast U.S. Moderate Confidence.Temperature is primarily driving environmental change in the Alaskan coastalzone. Sea ice <strong>and</strong> permafrost make northern regions particularly susceptible totemperature change. For example, an increase of two degrees Celsius could basicallytransform much of Alaska from frozen to unfrozen, with extensive implications.Portions of the north <strong>and</strong> west coast of Alaska are seeing dramatic increasesin the rate of coastal erosion <strong>and</strong> flooding due to sea ice loss <strong>and</strong> permafrostmelting. As a consequence, several coastal communities are planning to relocateto safer locations. Relocation is a difficult decision that is likely to become morecommon in the future for many coastal regions. High Confidence.Methane is a primary greenhouse gas. Large reserves of methane are bound-upin Alaska’s frozen permafrost. These are susceptible to disturbance <strong>and</strong> methanerelease if the Arctic continues to warm. The additional methane released mayresult in even greater greenhouse warming of the atmosphere. High Confidence.Vulnerability <strong>and</strong> <strong>Impacts</strong> on Natural Resources<strong>Climate</strong> <strong>and</strong> non-climate stressors originating from terrestrial <strong>and</strong> marine sources interactat the coast to influence coastal habitats (Nicholls et al., 2007; Rosenzweig et al.,2007). Increased temperatures <strong>and</strong> altered precipitation patterns interact with changingl<strong>and</strong> use <strong>and</strong> l<strong>and</strong> cover practices to affect soil moisture, ground water levels, hydrology,sediment supply, <strong>and</strong> salinity in watersheds. Sea-level rise, changing ocean currents,increased wave heights, <strong>and</strong> intensification of coastal storms interact with the shorelineto exacerbate coastal erosion, flooding, <strong>and</strong> saltwater intrusion. As the physical environmentchanges, the range of a particular ecosystem will exp<strong>and</strong>, contract, or migrate inresponse. Changes in range as well as structure <strong>and</strong> function are evident in many typesof ecosystems.The interactions of the many stressors result in complex changes to natural coastalsystems that may not be predicted by the response from any single stressor. Positive<strong>and</strong> negative impacts occur when the impact of one stressor is either strengthened or
Executive Summaryxxviiweakened by variation in another, <strong>and</strong> the combined influence of multiple stressors canresult in unexpected ecological changes if populations or ecosystems are pushed beyonda critical threshold or tipping point (Harley et al., 2006; Lubchenco & Petes, 2010). Boththeoretical <strong>and</strong> empirical examples of thresholds are rising <strong>and</strong> increasing knowledgeabout how climate <strong>and</strong> non-climate stressors interact to propel sudden shifts in ecosystems.These examples also show that many of the responses of natural systems arelinked to those of human systems.Key FindingsffffffffffffffffffffMultiple stressors interact at the coast, which directly impacts natural resources.The responses of natural coastal systems to climate change are complex <strong>and</strong>subject to nonlinear changes <strong>and</strong> tipping points. Many of these responsesare heavily influenced by the way they are linked with human systems. HighConfidence.Wetl<strong>and</strong> ecosystems are vulnerable to relative rise in water levels <strong>and</strong> projectedincreases in storm activity in zones of significant human use. High Confidence.Mangrove range will exp<strong>and</strong> as minimum temperatures increase. HighConfidence.<strong>Coastal</strong> forests will tend to migrate upslope <strong>and</strong> poleward where they are able tokeep pace with changing habitat conditions. High Confidence.The structure <strong>and</strong> functioning of estuary <strong>and</strong> coastal lagoon systems will changewith alterations in habitat suitability <strong>and</strong> the timing of long-st<strong>and</strong>ing processes.High Confidence.Dynamic barrier isl<strong>and</strong> l<strong>and</strong>scapes naturally migrate in response to stormactivity <strong>and</strong> sea-level rise. This process will be confounded by human alterations.High Confidence.Because of altered sediment supplies <strong>and</strong> local subsidence, deltas, <strong>and</strong> thebiodiversity they support, are at risk to drowning during rising sea levels. HighConfidence.Mudflats are susceptible to threshold changes caused by the combined effectsof sea-level rise, temperature, l<strong>and</strong> use, altered flows, <strong>and</strong> increased nutrientrunoff. High Confidence.Complex interactions between physical <strong>and</strong> biological factors, which makeresponses to climate change difficult to predict, have been demonstrated inrocky shore communities. High Confidence.Sea ice ecosystems are already being adversely affected by the loss of summersea ice. Further changes are expected. High Confidence.Vulnerability <strong>and</strong> <strong>Impacts</strong> on Human DevelopmentSocietal vulnerability of U.S. coasts is comprised of the vulnerabilities of economic sectors<strong>and</strong> associated livelihoods, water resources, energy, transportation, national defense,
xxviii<strong>Coastal</strong> <strong>Impacts</strong>, <strong>Adaptation</strong>, <strong>and</strong> <strong>Vulnerabilities</strong>investments in homes <strong>and</strong> other buildings, <strong>and</strong> the health <strong>and</strong> well-being of a diverseconcentration of people from natives to recent immigrants <strong>and</strong> from the very poor tothe tremendously wealthy. The interactions of climate-related vulnerabilities with otherstressors such as economic downturn, environmental degradation, or pressures for developmentpose further analytical challenges. Because coastal watershed counties housea majority of U.S. cities, a significant percentage of the nation’s population may be morevulnerable to impacts under climate change <strong>and</strong> face loss of jobs, supply chain interruptions,<strong>and</strong> threats to public health, safety, <strong>and</strong> well-being as a result.Key FindingsffffffffffffExp<strong>and</strong>ing economic <strong>and</strong> population exposure along the coast significantlyincreases the risk of harm <strong>and</strong> exposes already vulnerable communities to theimpacts of climate change. Since 1980, roughly half of the nation’s new residentialbuilding permits were issued in coastal counties, which substantially increasesvulnerability <strong>and</strong> risk of loss <strong>and</strong> adds to already populated <strong>and</strong> densely developedmetropolitan areas. High Confidence.The full measure of human vulnerability <strong>and</strong> risk is comprised of the vulnerabilitiesof human development, economic sectors, associated livelihoods, <strong>and</strong>human well-being. The interactions of climate-related vulnerabilities with otherstressors in the coastal zone pose analytical challenges when coupled with thelack of quantitative, multi-stressor vulnerability assessments. High Confidence.Storm surge flooding <strong>and</strong> sea-level rise pose significant threats to public <strong>and</strong>private infrastructure that provides energy, sewage treatment, clean water, <strong>and</strong>transportation of people <strong>and</strong> goods. These factors increase threats to publichealth, safety, <strong>and</strong> employment in the coastal zone. High Confidence.Systematic incorporation of climate risk into the insurance industry’s rate-settingpractices <strong>and</strong> other business investment decisions could present a cost-effectiveway to deal with low probability, high severity weather events. Without reform,the financial risks associated with both private <strong>and</strong> public hazard insurance areexpected to increase as a result of expected climate change <strong>and</strong> sea-level rise.High Confidence.Expected public health impacts include a decline in seafood quality, shifts indisease patterns <strong>and</strong> increases in rates of heat-related morbidity. Better predictionsof coastal related public health risks will require sustained multi-disciplinarycollaboration among researchers <strong>and</strong> health practitioners in the climate,oceanography, veterinary, <strong>and</strong> public health sciences. Moderate Confidence.Although the Department of Defense (DoD) has started to consider the impactsof climate change on coastal installations, operations, <strong>and</strong> military readiness, theDoD requires actionable climate information <strong>and</strong> projections at mission-relevanttemporal <strong>and</strong> spatial scales to maintain effective training, deployment, <strong>and</strong> forcesustainment capabilities. High Confidence.
Executive Summaryxxix<strong>Adaptation</strong> <strong>and</strong> Mitigation<strong>Adaptation</strong> is emerging as an essential strategy for managing climate risk, <strong>and</strong> a broadrange of adaptation initiatives are being pursued across a range of geopolitical scales.This interest in adaptation has emerged from: increased awareness that climate impactsare already occurring <strong>and</strong> unavoidable; growing availability of knowledge, data, <strong>and</strong>tools for the assessment of climate risk; <strong>and</strong> the interest of government agencies, businesses,<strong>and</strong> communities in increasing their resilience to current climate variability <strong>and</strong>future climate change.<strong>Adaptation</strong> planning activities are increasing, <strong>and</strong> tools <strong>and</strong> resources are now moreavailable <strong>and</strong> accessible. Frequently, plans are being developed at varied spatial scalesbased upon the on-the-ground needs <strong>and</strong> adaptation drivers in the particular area;therefore, they are not easily integrated or comparable across geographic, sectoral, orpolitical boundaries. <strong>Adaptation</strong> strategies are often developed separately from otherexisting planning efforts rather than being effectively <strong>and</strong> efficiently integrated into existingcoastal management <strong>and</strong> policy regimes. More efficiency can be achieved throughintegration into overall l<strong>and</strong> use planning <strong>and</strong> ocean <strong>and</strong> coastal management policies<strong>and</strong> practices.Although progress is being made in anticipatory adaptation planning, the implementationof adaptation plans has proceeded more slowly due to a variety of barriers. Someimplementation is occurring via changes in regulations <strong>and</strong> policy <strong>and</strong> decisions intransportation, infrastructure, l<strong>and</strong> use, <strong>and</strong> development; however, challenges remainin translating adaptation planning efforts into increased resilience. Although many adaptationactions for coastal areas can be categorized as ‘no regrets’ actions that can beimplemented under a range of climate scenarios <strong>and</strong> pose few opportunity costs, moresubstantive actions may have larger financial, policy, or legal hurdles. Overlapping <strong>and</strong>sometimes conflicting laws, often designed without consideration of a changing climate,can prevent the adoption of adaptive measures.Key FindingsffffffAlthough adaptation planning activities in the coastal zone are increasing, theygenerally occur in an adhoc manner <strong>and</strong> at varied spatial scales dictated byon-the-ground needs <strong>and</strong> adaptation drivers in the particular area. Efficiency ofadaptation can be improved through integration into overall l<strong>and</strong> use planning<strong>and</strong> ocean <strong>and</strong> coastal management. High Confidence.In some cases, adaptation is being directly integrated, or mainstreamed, intoexisting decision-making frameworks regarding zoning <strong>and</strong> floodplain, coastal,<strong>and</strong> emergency management, but these frameworks are not always perfect fit <strong>and</strong>sometimes existing laws pose a barrier to implementation. Very High Confidence.Tools <strong>and</strong> resources to support adaptation planning are increasing but technical<strong>and</strong> data gaps persist. As adaptation planning has evolved, recognitionhas grown regarding the need for detailed information that is compatible withorganizational decision-making processes <strong>and</strong> management systems. Very HighConfidence.
xxx<strong>Coastal</strong> <strong>Impacts</strong>, <strong>Adaptation</strong>, <strong>and</strong> <strong>Vulnerabilities</strong>ffffffAlthough adaptation planning has an increasingly rich portfolio of case studiesthat contribute to shared learning, the implementation of adaptation plans hasproceeded at a much slower pace. Very High Confidence.Elements commonly found in adaptation plans include vulnerability assessments,monitoring <strong>and</strong> indicators, capacity building, education <strong>and</strong> outreach,regulatory <strong>and</strong> programmatic changes, implementation strategies, <strong>and</strong> a sectorby-sectorapproach. Very High Confidence.Although state <strong>and</strong> federal governments play a major role in facilitating adaptationplanning, most coastal adaptation will be implemented at the local level.Local governments are the primary actors charged with making the critical,basic l<strong>and</strong>-use <strong>and</strong> public investment decisions <strong>and</strong> with working with communitystakeholder groups to implement adaptive measures on the ground. VeryHigh Confidence.<strong>Climate</strong> change is altering all types of ecosystems <strong>and</strong> impacting human welfare <strong>and</strong>health, but effects are highly varied, pronounced along coasts, <strong>and</strong> likely to acceleratein decades ahead. A lack of underst<strong>and</strong>ing of the cumulative effects of climate <strong>and</strong> nonclimatestressors as well as the interactions between human <strong>and</strong> natural systems currentlylimits our ability to predict the extent of climate impacts. An integrated scientificprogram that seeks to learn from the historic <strong>and</strong> recent geologic past, <strong>and</strong> monitorsongoing physical, environmental, <strong>and</strong> societal changes will improve the level of knowledge<strong>and</strong> reduce the uncertainty about potential responses of coasts to sea-level rise <strong>and</strong>other drivers of coastal change. This, in turn, will improve the ability of communities toassess their vulnerability <strong>and</strong> to identify <strong>and</strong> implement adaptation options that addressthe impacts <strong>and</strong> associated uncertainties of the projections.
Introduction <strong>and</strong> Context 3irrigation for agriculture. Rising sea levels <strong>and</strong> increased storm intensity couldimpact water control structures such as levees <strong>and</strong> dams in the coastal zone.• Agriculture. The impacts of climate change on agriculture may be intensifiedin low-lying coastal areas. Saltwater intrusion may render some l<strong>and</strong>s inappropriatefor farming. Stronger storms <strong>and</strong> increased precipitation or drought maylead to major changes in planting patterns <strong>and</strong> types of crops grown.• Forestry. In coastal areas, forests may be affected by many of the same factors asagriculture, but increased severity of storms may have a greater impact on forestsdue to the longer cycle from planting to harvest. Loss of st<strong>and</strong>ing timber dueto high winds may also have long term economic impacts. Saltwater encroachment<strong>and</strong> more frequent saturation of coastal forest soils may affect the potentialfor forest regeneration <strong>and</strong> other silvicultural practices.• Public Health. <strong>Climate</strong>-related impacts on health <strong>and</strong> well-being include impactson food supply, disease transmission, <strong>and</strong> environmental health. An increaseis expected in contamination of coastal fishing <strong>and</strong> recreational watersin areas with high runoff <strong>and</strong> stressed sanitation systems; changes in access to<strong>and</strong> quality of food from the sea; <strong>and</strong> northward shifts in habitat. Vector-bornediseases may also be intensified in coastal areas as temperature <strong>and</strong> rainfall patternschange. Higher concentrations of populations in coastal areas may intensifythe impacts of increased heat <strong>and</strong> humidity in coastal areas.• Transportation. Increased flooding <strong>and</strong> inundation of roads <strong>and</strong> bridges incoastal areas may impede emergency preparation for <strong>and</strong> response to coastalstorms, delay ground <strong>and</strong> other transportation, or alter traffic patterns. Improvementsto maritime transportation infrastructure to respond to climate changemay be a complex mix of public <strong>and</strong> private investment because most freight facilitiesare privately owned. Maintaining effective transportation through portsis of special concern due to their significant impact on the national economy.• Energy Supply. Most saltwater consumption in U.S. coastal counties occurs duringthermoelectric power generation. Changes in water temperature may reducethe effectiveness of water as a cooling medium. The coasts are areas of explorationfor energy sources including traditional sources, such as the extraction <strong>and</strong>transportation of offshore oil to inl<strong>and</strong> areas, <strong>and</strong> alternative sources, such astidal, wave, <strong>and</strong> wind energy.• Ecosystems <strong>and</strong> Biodiversity. The ecosystems <strong>and</strong> biodiversity report of theNCA will examine the impacts of rising sea levels <strong>and</strong> other changing climaticfactors on l<strong>and</strong> cover <strong>and</strong> ecosystems. Temperature <strong>and</strong> changes in the hydrologiccycle are likely to have significant effects on both coastal ecosystems <strong>and</strong>biodiversity. On the coast, wetl<strong>and</strong>s <strong>and</strong> the associated species will face pressurefrom changes in salinity, inundation, <strong>and</strong> erosion. As coastal areas continue todevelop, less upl<strong>and</strong> area will be available for wetl<strong>and</strong> restoration or migrationdue to the presence of hardened shorelines.• Urban Infrastructure <strong>and</strong> Vulnerability. Most of the U.S. population lives withcoastal watersheds <strong>and</strong> a significant portion of the nation’s infrastructure is atrisk due to increased inundation <strong>and</strong> erosion from storms <strong>and</strong> sea-level rise.
8 <strong>Coastal</strong> <strong>Impacts</strong>, <strong>Adaptation</strong>, <strong>and</strong> <strong>Vulnerabilities</strong>loss to subsidence <strong>and</strong> consequent water level rise. Some regions experienced gains inthe categories of marine intertidal wetl<strong>and</strong>s including beaches <strong>and</strong> shores <strong>and</strong> estuarinenon-vegetated wetl<strong>and</strong>s, which includes near-shore shoals <strong>and</strong> s<strong>and</strong> bars.The EPA assessment (2011) of coastal water, sediment, fish, <strong>and</strong> habitat health indicatesthat the overall condition of our nation’s coastal waters is “fair.” Excess nutrients<strong>and</strong> contaminants enter the coastal system from agricultural systems <strong>and</strong> residential developmentthrough runoff, with rates that can be similar to paved surfaces, particularlyin urban <strong>and</strong> suburban areas developed after 2000 (Woltemade, 2010; Yang & Zhang,2011). An additional source of nutrients <strong>and</strong> contaminants is atmospheric deposition,which can occur from l<strong>and</strong> use changes or changes in the jet stream <strong>and</strong> other atmosphericpatterns that alter deposition amounts (Howarth, 2008; Mackey et al., 2010).Although fertilizer is the largest source of nitrogen in watersheds in the western U.S., atmosphericdeposition is next, accounting for approximately 30 percent of inputs (Schaeferet al., 2009). Both terrestrial <strong>and</strong> atmospheric sources of nutrients lead to increasedprimary productivity <strong>and</strong>, with decay, increased oxygen dem<strong>and</strong> (e.g., Rabalais et al.,2009). Although it offers some benefits, increased primary productivity can also lead toincreased incidence of hypoxic conditions.The impacts of nutrients <strong>and</strong> contaminants will also be influenced by changes intemperature, precipitation, convection, <strong>and</strong> sea level. For example, warmer water temperaturescan increase algal productivity, which increases oxygen dem<strong>and</strong> when algalblooms decay, <strong>and</strong>, consequently, the incidence of hypoxia. Hypoxic zones lead to declinesof many species, including commercially important fish <strong>and</strong> shellfish. Some ofthese water quality impacts may be counteracted through increases in the frequency orintensity of precipitation that may deliver greater quantities of freshwater to the coastalzone (Rabalais et al., 2009); however, increased runoff will also interact with impervioussurfaces of the built environment <strong>and</strong> thereby enhance the delivery of sediments, nutrients,<strong>and</strong> contaminants to coastal ecosystems (NRC, 2008). Contaminants, includingmetals, herbicides, pesticides, <strong>and</strong> pathogens, that are introduced to the coast throughrunoff, atmospheric deposition, or other sources further impact coastal water quality.The presence of these contaminants affects the ecosystem by altering productivity <strong>and</strong>potentially species’ compositions <strong>and</strong> biodiversity as well as public health if humans areexposed to the contaminants. Environmental management practices in urban <strong>and</strong> agriculturalsettings can help to reduce the flux of sediments, nutrients, <strong>and</strong> contaminantsto the coast, but the degree to which management actions can offset these impacts isuncertain.Maintaining a Balance<strong>Coastal</strong> resource managers are often charged with balancing the requirements for humanpopulation growth <strong>and</strong> economic development with the protection of naturalhabitats <strong>and</strong> the ecosystem services they provide <strong>and</strong> upon which coastal economiesdepend. Many examples of large-scale efforts are underway in the U.S. to conserve theecosystem services that the coast provides while allowing for its sustainable use. Withinthe USDOI, the U.S. National Park Service’s coastal park units cover more than 7,300miles of shoreline (National Park Service, 2011), the National Wildlife Refuge Systemmanages 556 refuges, <strong>and</strong> the U.S. Fish <strong>and</strong> Wildlife Service <strong>Coastal</strong> Program restores
Introduction <strong>and</strong> Context 9coastal wetl<strong>and</strong>s <strong>and</strong> upl<strong>and</strong> habitat <strong>and</strong> permanently protected over 2 million acres ofcoastal habitat (Fish <strong>and</strong> Wildlife Service, 2012). NOAA also directly manages coastalareas through the Office of National Marine Sanctuaries, oversees critical fisheries habitatsthrough the National Marine Fisheries Services, <strong>and</strong> supports regional to local conservation<strong>and</strong> management efforts through the National Estuarine Research Reserves,state <strong>Coastal</strong> Zone Management programs, the Coral Reef Conservation Program, <strong>and</strong>the National Sea Grant College Program. The EPA also supports local efforts throughthe National Estuary program while the USDA/NRCS supports conservation principallythrough the Crop Protection Reserve Program. Many other public <strong>and</strong> private coastalacquisition <strong>and</strong> conservation efforts have been initiated in recent years; organizationslike Trust for Public L<strong>and</strong>s, The Nature Conservancy, <strong>and</strong> the community l<strong>and</strong> trusts arebut a few of these key partners.New concepts for future coastal development have also been introduced. Green infrastructureplanning is an example of a strategy to incorporate conservation of habitatsinto coastal communities. This concept for planning future urban growth promotes aninterconnected network of protected l<strong>and</strong> <strong>and</strong> water that supports native species, maintainsnatural ecological processes, sustains air <strong>and</strong> water resources, <strong>and</strong> contributes toa community’s health <strong>and</strong> quality of life (Benedict & McMahon, 2006). Many other examplesof development planning that can help offset the potential impacts of climatechange while concomitantly reducing the effects of human development on coasts arepresented in Chapters 4 <strong>and</strong> 5 of this report.A major challenge for coastal habitats <strong>and</strong> communities in the coming years will beadapting to the increasing dem<strong>and</strong>s on natural resources given the changing climate.Many strategies are available for l<strong>and</strong> use, energy needs, transportation, <strong>and</strong> other criticalinfrastructure choices that may reduce the severity of impacts or reverse them altogether.The opportunity for restoring coastal habitats is among the conservation optionsthat many coastal states have selected in recent years (Borja et al., 2010). Restorationactivities <strong>and</strong> the establishment of buffers <strong>and</strong> setbacks increase resilience to climatechange by managing current stressors that interact with climate change effects; however,although these efforts can result in recovery of some portions of coastal systems, substantiallags <strong>and</strong> barriers may still slow full recovery (Cardoso et al., 2010). The scale ofsuch efforts will be important as population continues to grow <strong>and</strong> development occursalong coasts, so that negative impacts are minimized. Easing the existing pressures oncoastal environments to improve their resiliency is one method of coping with the adverseeffects of climate change.
Chapter 2Physical <strong>Climate</strong> ForcesKey FindingsffffffffffffThe coasts of the U.S. are home to many large urban centers <strong>and</strong> important infrastructuresuch seaports, airports, transportation routes, oil import <strong>and</strong> refiningfacilities, power plants, <strong>and</strong> military bases. All are vulnerable to varying degreesto impacts of global warming such as sea-level rise, storms, <strong>and</strong> flooding. HighConfidence.Physical observations collected over the past several decades from the l<strong>and</strong>,coasts, oceans, <strong>and</strong> the atmosphere, as well as environmental indicators, showthat warming <strong>and</strong> some related environmental changes are occurring globally atrates greater than can be expected due to natural processes. These climate-relatedchanges are highly varied, but some are likely due in large part to anthropogenicallyincreased atmospheric concentrations of greenhouse gases <strong>and</strong> altered l<strong>and</strong>surface properties. High Confidence.Findings from many independent scientific studies conclude that these changesare consistent with global warming. The primary changes observed are risingsea level <strong>and</strong> average global air, l<strong>and</strong>, <strong>and</strong> ocean temperatures; heighteningtemperature <strong>and</strong> precipitation extremes in some regions; <strong>and</strong> increasing levelsof oceans acidification <strong>and</strong> rates of glacier <strong>and</strong> ice sheet melt. High Confidence.Most coastal l<strong>and</strong>forms, such as barrier isl<strong>and</strong>s, deltas, bays, estuaries, wetl<strong>and</strong>s,coral reefs, are highly dynamic <strong>and</strong> sensitive to even small changes in physicalforces <strong>and</strong> feedbacks such as warming, storms, ocean circulation, waves <strong>and</strong>currents, flooding, sediment budgets, <strong>and</strong> sea-level rise. High Confidence.The effects of sea-level rise on coasts vary considerably from region-to-region<strong>and</strong> over a range of spatial <strong>and</strong> temporal scales. L<strong>and</strong> subsidence in certain locationscauses relative sea-level rise to exceed global mean sea-level rise. L<strong>and</strong>uplift such as that found in Alaska <strong>and</strong> the Northwestern Pacific coast can reduceeffects of global mean rise. The effects will be greatest <strong>and</strong> most immediate onlow-relief, low-elevation parts of the U.S. coast along the Gulf of Mexico, mid-Atlantic states, northern Alaska, Hawaii, <strong>and</strong> isl<strong>and</strong> territories <strong>and</strong> especiallyon coasts containing deltas, coastal plains, tidal wetl<strong>and</strong>s, bays, estuaries, <strong>and</strong>coral reefs. Beaches <strong>and</strong> wetl<strong>and</strong>s on steep cliff coasts <strong>and</strong> shores backed withseawalls may be unable to move l<strong>and</strong>ward or maintain their l<strong>and</strong>form with sealevelrise. Many areas of the coast are especially vulnerable because of the oftendetrimental effects of development on natural processes. High Confidence.The gradual inundation from recent sea-level rise is evident in many regions10
Physical <strong>Climate</strong> Forces 11ffffffffffffffsuch as the mid-Atlantic <strong>and</strong> Louisiana where high tides regularly flood roads<strong>and</strong> areas that were previously dry, <strong>and</strong> in st<strong>and</strong>s of “ghost forests,” in whichtrees are killed by intrusion of brackish water. High Confidence.Sea level change <strong>and</strong> storms are dominant driving forces of coastal change asobserved in the geologic record of coastal l<strong>and</strong>forms. Increasingly, sea-level risewill become a hazard for coastal regions because of continued global mean sealevelrise, including possibly accelerated rates of rise that increase risk to coastalregions. As the global climate continues to warm <strong>and</strong> ice sheets melt, coasts willbecome more dynamic <strong>and</strong> coastal cities <strong>and</strong> low-lying areas will be increasinglyexposed to erosion, inundation, <strong>and</strong> flooding. High Confidence.No coordinated, interagency process exists in the U.S. for identifying agreedupon global mean sea-level rise projections for the purpose of coastal planning,policy, or management, even though this is a critical first step in assessing coastalimpacts <strong>and</strong> vulnerabilities. High Confidence.Global sea level rose at a rate of 1.7 millimeters/year during the 20th century.The rate has increased to over 3 millimeters/year in the past 20 years <strong>and</strong> scientificstudies suggest high confidence (>9 in 10 chance) that global mean sea levelwill rise 0.2 to 2 meters by the end of this century. Some regions such as Louisiana<strong>and</strong> the Chesapeake Bay will experience greater relative rise due to factorssuch as l<strong>and</strong> subsidence, gravitational redistribution of ice-sheet meltwater,ocean circulation changes, <strong>and</strong> regional ocean thermostatic effects. Other regionsundergoing l<strong>and</strong> uplift, such as Alaska, will experience lesser sea-level rise. HighConfidence.Variability in the location <strong>and</strong> time-of-year of storm genesis can influence l<strong>and</strong>fallingstorm characteristics, <strong>and</strong> even small changes can lead to large changes inl<strong>and</strong>falling location <strong>and</strong> impact. Although scientists have only low confidence inthe sign of projected changes to the coast of storm-related hazards that dependon a combination of factors such as frequency, track, intensity, <strong>and</strong> storm size,any sea-level rise is virtually certain to exacerbate storm-related hazards. HighConfidence.Although sea-level rise <strong>and</strong> climate change have occurred in the past, theincreasing human presence in the coastal zone will make the impacts differentfor the future. L<strong>and</strong> use <strong>and</strong> other human activities often inhibit the naturalresponse of physical processes <strong>and</strong> adaptation by plants <strong>and</strong> animals. In someareas, erosion <strong>and</strong> wetl<strong>and</strong> loss are common because sediment budgets havebeen reduced, while, in other regions, excess sediment is in-filling harbors, channels,<strong>and</strong> bays. High Confidence.Observations continue to indicate an ongoing, warming-induced intensificationof the hydrologic cycle that will likely result in heavier precipitation events <strong>and</strong>,combined with sea-level rise <strong>and</strong> storm surge, an increased flooding severity insome coastal areas, particularly the northeast U.S. Moderate Confidence.Temperature is primarily driving environmental change in the Alaskan coastalzone. Sea ice <strong>and</strong> permafrost make northern regions particularly susceptibleto temperature change. For example, an increase of two degrees Celsius could
12 <strong>Coastal</strong> <strong>Impacts</strong>, <strong>Adaptation</strong>, <strong>and</strong> <strong>Vulnerabilities</strong>ffbasically transform much of Alaska from frozen to unfrozen, with extensiveimplications. Portions of the north <strong>and</strong> west coast of Alaska are seeing dramaticincreases in the rate of coastal erosion <strong>and</strong> flooding due to sea ice loss <strong>and</strong>permafrost melting. As a consequence, several coastal communities are planningto relocate to safer locations. Relocation is a difficult decision that is likely tobecome more common in the future for many coastal regions. High Confidence.Methane is a primary greenhouse gas. Large reserves of methane are bound-upin Alaska’s frozen permafrost. These are susceptible to disturbance <strong>and</strong> methanerelease if the Arctic continues to warm. The additional methane released mayresult in even greater greenhouse warming of the atmosphere. High Confidence.2.1 Overview of <strong>Climate</strong> Change <strong>and</strong> Sea-level Rise Effectson CoastsIntroductionMore than 50 percent of Americans live in coastal watershed counties, a percentage thatcontinues to increase (see section 1.3). In addition, the coast is home to the majority ofmajor urban centers as well as major infrastructure such as seaports, airports, transportationroutes, oil import <strong>and</strong> refining facilities, power plants, <strong>and</strong> military facilities. Allof these human uses, which represent trillions of dollars in economic investment as wellas valuable coastal ecosystems, are vulnerable in varying degrees to rising global temperature<strong>and</strong> hazards such as sea-level rise, storms, <strong>and</strong> extreme floods. Intense humanactivity over the past century has degraded many coastal environments <strong>and</strong> stressednatural ecosystems. Nationwide, nearshore areas <strong>and</strong> estuaries are polluted with excessnitrogen <strong>and</strong> other chemicals, toxic coastal algal blooms are increasing, fish stocks aredepleted, wetl<strong>and</strong> loss has been dramatic, <strong>and</strong> coral reefs are bleached <strong>and</strong> dying. <strong>Climate</strong>change exacerbates these stresses on ecosystems.A changing global climate is imposing additional stresses on coasts. Although theclimate is warming globally, the impacts are highly variable across regions <strong>and</strong> at differentreaction time scales due to various feedbacks. Some effects, such as rising sea level,are already evident in increased erosion of beaches <strong>and</strong> dunes, more frequent floodingfrom rivers <strong>and</strong> tidal surge, increased saltwater intrusion, <strong>and</strong> drowning loss of wetl<strong>and</strong>sby conversion to open water bays (CCSP, 2009a). Sea surface temperatures haverisen over much of the globe, <strong>and</strong> hurricane activity has increased over the past severaldecades, particularly in the Atlantic basin, although whether these storm changes exceedthe levels expected from natural causes is uncertain. In addition, increased uptake ofatmospheric carbon dioxide by the oceans has increased ocean acidity, which threatenscoral reefs <strong>and</strong> shellfish. These driving forces interact in complex ways <strong>and</strong> are havingcumulative effects on coasts, making coasts particularly vulnerable to many of the impactsof climate change as shown in Figure 2-1.The Earth’s geologic record shows that climate has been highly variable throughoutits history. The causes for this variability are numerous <strong>and</strong> result from complex interactionsbetween the continental l<strong>and</strong> masses, oceans, <strong>and</strong> the atmosphere, as affectedby incoming <strong>and</strong> reflected or outgoing solar radiation. Basically, the Earth’s climate
Physical <strong>Climate</strong> Forces 13Figure 2-1 Schematic diagram showing the main impacts of climate warming <strong>and</strong> the effects oncoasts. Source: Burkett et al., 2009.system is driven by solar energy. About 50 percent is absorbed at the surface, 30 percentis reflected back to space <strong>and</strong> 20 percent is absorbed in the atmosphere (IPCC, 2007).An increase in greenhouse gases in the atmosphere leads to increased absorption <strong>and</strong>higher temperatures on l<strong>and</strong> <strong>and</strong> in the oceans. Humans are changing Earth’s energybalance by altering l<strong>and</strong> surface properties <strong>and</strong> increasing greenhouse gas concentrations.The temperature increases observed are uneven around the globe <strong>and</strong> gains <strong>and</strong>losses are compensated by ocean <strong>and</strong> atmospheric currents. Many of these processesinvolve positive <strong>and</strong> negative feedback mechanisms that interact in complex ways; evensmall changes in atmospheric warming can have cumulative <strong>and</strong> multiplying effectsacross entire regions <strong>and</strong> even globally. These feedbacks are important in regulatingclimate affecting all aspects of the Earth system, but many of these environmental feedbacks<strong>and</strong> physical tipping points are neither well understood nor predictable with highconfidence.The coastal zone at the nexus of the continents, oceans, <strong>and</strong> atmosphere is highlydynamic but particularly vulnerable to impacts of climate change. The primary driving
14 <strong>Coastal</strong> <strong>Impacts</strong>, <strong>Adaptation</strong>, <strong>and</strong> <strong>Vulnerabilities</strong>forces are: sea-level rise; changes in temperature: precipitation; major storm events includingwaves, winds, <strong>and</strong> currents; <strong>and</strong> changing ocean circulation patterns.This overview is focused on sea-level rise <strong>and</strong> its effects on the ocean coast of the U.S.,including Alaska, Hawaii, <strong>and</strong> isl<strong>and</strong> territories. Although the Great Lakes are not discussed,many of the same factors <strong>and</strong> conclusions about the effects of climate change arelikely to apply. An exception is sea-level rise. Although oceans are likely to experiencerising levels, the Great Lakes are predicted to experience dropping lake levels in the nearfuture due to warming <strong>and</strong> increased evaporation. A drop in lake levels below historiclevels has serious implications for the entire Great Lakes region for activities that rely onfreshwater resources <strong>and</strong> commercial navigation.Discussions of other climate change driving forces acting on coasts, such as sea-levelrise scenario projections; extreme storm events; ocean waves, currents <strong>and</strong> ocean circulation;coastal vulnerability; changes in precipitation; <strong>and</strong> temperature increase arediscussed in the subsequent Chapter 2 sections that follow.<strong>Coastal</strong> L<strong>and</strong>forms <strong>and</strong> <strong>Coastal</strong> ChangeThe diverse l<strong>and</strong>forms such as barrier isl<strong>and</strong>s <strong>and</strong> dunes, bluffs <strong>and</strong> cliffs, mainl<strong>and</strong>beaches, deltas, estuaries <strong>and</strong> bays, <strong>and</strong> wetl<strong>and</strong>s that comprise the U.S. coast are productsof a dynamic interaction between: 1) physical processes that act on the coast, includingstorms, waves, currents, s<strong>and</strong> sources <strong>and</strong> sinks, <strong>and</strong> relative sea level; 2) humanactivity such as dredging, dams, <strong>and</strong> coastal engineering; <strong>and</strong> 3) the geological characterof the coast <strong>and</strong> nearshore. Variations of these physical processes in both location <strong>and</strong>time, as well as the local geology along the coast, result in the majority of the U.S. coastlinesundergoing overall long-term erosion at highly varying rates (CCSP, 2009a; Williamset al., 2009). The complex interactions between these factors make the relationshipbetween sea-level rise <strong>and</strong> shoreline change difficult to know. The difficulty in linkingsea-level rise to coastal change results from the fact that shoreline change is not drivensolely by sea-level rise. Instead, coasts are in dynamic balance <strong>and</strong> respond to manydriving forces such as geological character, storm activity, <strong>and</strong> sediment supply in thecoastal system. Surveys over the past century show that all U.S. coastal states are experiencingnet long-term erosion at highly variable rates. Sea-level rise will have profoundeffects by increasing flooding frequency <strong>and</strong> inundating low-lying coastal areas, butother processes such as erosion <strong>and</strong> sediment accretion will have additional importanteffects on driving coastal change.Many coastal l<strong>and</strong>forms adjust to sea-level rise by growing vertically, migrating inl<strong>and</strong>,or exp<strong>and</strong>ing laterally. If the rate of sea-level rise accelerates significantly, coastalenvironments <strong>and</strong> human populations will be affected. In some cases, the effects will belimited in scope <strong>and</strong> similar to those observed during the last century. In other cases,thresholds may be crossed, beyond which the impacts would be much greater. If the searises more rapidly than the rate with which a particular coastal system can keep pace,it could fundamentally change the state of the coast. For example, rapid sea-level risecan cause rapid l<strong>and</strong>ward migration or segmentation of barrier isl<strong>and</strong>s, disintegration ofwetl<strong>and</strong>s, <strong>and</strong> drowning of coral reefs (CCSP, 2009a).
Physical <strong>Climate</strong> Forces 15Sea-level Rise <strong>and</strong> Effects on CoastsAlthough climate has been highly variable <strong>and</strong> sea level has changed throughout Earth’shistory, over the past approximately 6,000 years, global climate <strong>and</strong> sea level have beenrelatively stable with little variability <strong>and</strong> extremes. This benign climate has likely beena major factor in the rapid expansion of human population, which numbers 7 billionpeople currently, <strong>and</strong> the development of our modern society (Day et al., 2007). In theU.S., human population <strong>and</strong> development in coastal regions are substantial. Populationcontinues to exp<strong>and</strong> <strong>and</strong> people are increasingly at risk from global warming <strong>and</strong> a varietyof natural hazards such as sea-level rise, storms, <strong>and</strong> flooding that may be exacerbatedby human-induced changes to global climate (Crossett et al., 2004; McGranahan etal., 2007; Nicholls et al., 2011).Society should be concerned about current observations of sea-level rise <strong>and</strong> projectionsof significant increases in decades ahead for two key reasons: 1) populationdensities have increased greatly <strong>and</strong> coasts have undergone intense development duringa period of relatively stable sea level over the past century. Although, in theory,people could relocate l<strong>and</strong>ward to accommodate rising seas, human infrastructure, privatel<strong>and</strong> ownership, <strong>and</strong> current policy tend to prevent such adaptation measures. 2)<strong>Coastal</strong> l<strong>and</strong>forms such as barrier isl<strong>and</strong>s, wetl<strong>and</strong>s, <strong>and</strong> deltas are already dynamic <strong>and</strong>therefore highly vulnerable to sea-level rise. Many coastal urban areas including Boston,New York, Washington D.C., Norfolk, Charleston, Miami, New Orleans, San Francisco,<strong>and</strong> Honolulu are also at high risk, yet few coastal states <strong>and</strong> communities have plansfor adaptation to warming temperatures, changes in storminess, <strong>and</strong> rising sea levels.<strong>Coastal</strong> l<strong>and</strong>forms are not simply inundated as sea level rises, but rather are modifiedby a variety of dynamic processes with cumulative effects that vary by location. Severalconditions <strong>and</strong> driving forces influence coastal evolution in response to sea-level rise, asdiscussed by FitzGerald et al. (2008) <strong>and</strong> Williams <strong>and</strong> Gutierrez (2009):• Geologic framework <strong>and</strong> character of coastal l<strong>and</strong>forms;• <strong>Impacts</strong> of major storm events;• <strong>Coastal</strong> oceanographic processes acting on the coast;• Sediment supply to the coast by erosion <strong>and</strong> rivers <strong>and</strong> transport along thecoast; <strong>and</strong>• Human activity that alters sediment movement <strong>and</strong> increases erosion.Geologic <strong>and</strong> historical records show large cyclical fluctuations in global sea level associatedwith global climate change (Church et al., 2010, 2011; Hansen et al., 2007; IPCC,2001; IPCC, 2007). For example, during the last interglacial warm period about 125,000years ago when most of the world’s glaciers <strong>and</strong> many ice sheets on Greenl<strong>and</strong> weredepleted, sea level was approximately 6 to 8 meters higher than present (Kopp et al.,2009). In contrast, during the Last Glacial Maximum about 21,000 years ago when muchof North America <strong>and</strong> northern Europe were thickly ice-covered, sea level was about 120meters lower than present (see Figure 2-2) <strong>and</strong> much of present-day continental shelf areaswere exposed coastal plains (Fairbanks, 1989; Muhs et al., 2004). During the Ice Ages<strong>and</strong> lower sea level eras, rivers flowing across the coastal plain eroded large valleys.Subsequent sea-level rise submerged these river valleys, creating Long Isl<strong>and</strong> Sound,
16 <strong>Coastal</strong> <strong>Impacts</strong>, <strong>Adaptation</strong>, <strong>and</strong> <strong>Vulnerabilities</strong>Figure 2-2 Generalized curve of sea-level rise since the last ice age. Abbreviations: MWP = meltwaterpulse. MWP-1A0, c. 19,000 years ago, MWP-1A, 14,600 to 13,500 years ago, MWP-1B, 11,500-11,000 years ago, MWP-1C, ~8,200-7,600 years ago. (From http://www.giss.nasa.gov/research/briefs/gornitz_09/)the Chesapeake <strong>and</strong> Delaware Bays, <strong>and</strong> San Francisco Bay. In addition, all of the barrierisl<strong>and</strong>s, most expanses of wetl<strong>and</strong>s, <strong>and</strong> the Mississippi River delta are l<strong>and</strong>formsthat were only able to form about 6,000 years ago, when the rate of sea-level rise stabilizednear its present level <strong>and</strong> sediments were able to accumulate <strong>and</strong> create l<strong>and</strong>formsat the coast (Williams & Gutierrez, 2009).Inundation, L<strong>and</strong> Loss, <strong>and</strong> L<strong>and</strong> Area Close to Present Sea LevelA readily apparent impact of rising sea level is inundation. For example, as discussed inchapter 2.2, if sea level rises 1 meter in the next century, then l<strong>and</strong> under 1 meter will bebelow sea level unless the l<strong>and</strong> is experiencing uplift or accretion of 1 meter or greater.The 1-meter elevation contour does not necessarily correspond to the future shorelinefrom a 1-meter rise in sea level. Shoreline processes may cause l<strong>and</strong> well above 1 meterto erode (Gutierrez et al., 2009), sediment accretion may enable wetl<strong>and</strong>s to remain atsea level (Cahoon et al., 2009), <strong>and</strong> coastal development can lead to shore protection to
Physical <strong>Climate</strong> Forces 17maintain l<strong>and</strong> that would otherwise be claimed by the sea (Titus et al., 2009). Nevertheless,l<strong>and</strong> elevation, determined from high resolution data such as LiDAR, is a usefulindicator of potential vulnerability.Table 2-1 shows regional <strong>and</strong> state-specific estimates of the area of l<strong>and</strong> low enoughto become inundated by a 1 meter rise in sea level, from published multi-state studies.The table includes much of the U.S. but excludes regions where data for analyses werelimited. Those studies generally distinguish possible tidal flooding of dry l<strong>and</strong> that isless than 1 meter above high tide from inundation of tidal wetl<strong>and</strong>s that are already inundatedat high tide but might convert to open water with a higher sea level. The statesof Louisiana, Florida, <strong>and</strong> North Carolina each have more than one thous<strong>and</strong> square kilometersof dry l<strong>and</strong> less than 1 meter above high tide; in the case of Louisiana, much ofthis low l<strong>and</strong> is already below mean sea level <strong>and</strong> kept habitable by dikes <strong>and</strong> pumpingsystems. Considering also low-lying coastal wetl<strong>and</strong>s, every state along the Atlantic <strong>and</strong>Gulf Coast from New Jersey to Texas has at least 1000 square kilometers that could besubmerged by a 1 meter rise in sea level, except for the three states with relatively shortcoastlines: Delaware, Mississippi, <strong>and</strong> Alabama.Table 2-1: Dry L<strong>and</strong> <strong>and</strong> Total L<strong>and</strong> Area Less than One Meter above High Waterby State <strong>and</strong> Region (square kilometers)Dry l<strong>and</strong> 1 All L<strong>and</strong> 2ElevationSourceSample of USGS <strong>and</strong>National Elev.Printed maps local dataDataset (2012)(1991) 3 (2009) 54Sample of USGS USGS <strong>and</strong>(1991) 3 (2001) 6 (2009) 4Printed maps 1-degree data local dataNortheastME – – 54 – 383 420NH – – 5 – 42 47MA – 110 86 – 365 459RI – 8 11 – 122 38CT – 30 27 – 63 106Mid-AtlanticNY – 90–218 155 – 240 244–379NJ – 148–365 174 – 1083 1231–1564PA – 11–33 7 – 3 18–44DE – 84–158 90 – 388 465–553MD – 326–570 410 – 1547 1539–1832DC – 3–4 2 – 2 3–5VA – 189–479 315 – 969 1881–2265
18 <strong>Coastal</strong> <strong>Impacts</strong>, <strong>Adaptation</strong>, <strong>and</strong> <strong>Vulnerabilities</strong>Table 2-1: Dry L<strong>and</strong> <strong>and</strong> Total L<strong>and</strong> Area Less than One Meter above High Waterby State <strong>and</strong> Region (square kilometers) (Continued)Dry l<strong>and</strong> 1 All L<strong>and</strong> 2ElevationSourceSoutheastSample of USGS <strong>and</strong>National Elev.Printed maps local dataDataset (2012)(1991) 3 (2009) 54Sample of USGS USGS <strong>and</strong>(1991) 3 (2001) 6 (2009) 4Printed maps 1-degree data local dataNC – 1330–1717 1288 – 5836 5650–6343SC – 341 439 – 2334 2842GA – 133 331 – 1743 1993FL – 1286 1654 – 12251 6624GulfAL – – 35 – 195 –MS – – 34 – 173 –LA 3700 – 3058 13400 25742 –TX – – 284 – 5177 –PacificCA – – 378 – – –OR – – 54 – – –WA – – 289 – – –Northeast 608 263 183 849 975 1070Mid-Atlantic 3120 851–1827 1153 4466 4230 5381–6642Southeast 7 5800 3122 2885 13140 16038 17143Gulf 7 8200 4793 4238 21000 61355 –Pacific 8 2340 – 721 2431 – –United States 8 13300–26700 – 13401 21100–54800 – –– Indicates that the study did not report a result at this level of aggregation.1 Defined as l<strong>and</strong> that is not classified as wetl<strong>and</strong> in the National Wetl<strong>and</strong> Inventory.2 Dry l<strong>and</strong>, nontidal wetl<strong>and</strong>s, <strong>and</strong> tidal wetl<strong>and</strong>s.3 From Titus et al., 1991, reporting results from Park et al., (1989) <strong>and</strong> Titus & Greene (1989). High water defined asspring high water. Uncertainty range based on sample error.4 Mid-Atlantic results from Titus <strong>and</strong> Wang (2009). Other states from Titus et al., (2009). Mid-Atlantic uncertaintyrange by Titus <strong>and</strong> Cacela (2009) based on vertical error of elevation data. High water = spring high water.5 From Strauss et al., (2012). High water = mean high water.6 From Titus <strong>and</strong> Richman (2001). Using 1.5 m NGVD as a proxy for 1 m above high water.7 Includes half of “S <strong>and</strong> SW FL” for the 1991 study <strong>and</strong> half of Florida for the 2001 <strong>and</strong> 2012 studies.8 Excludes Alaska <strong>and</strong> Hawaii.
Physical <strong>Climate</strong> Forces 19These low elevation dry l<strong>and</strong> areas include the bay sides of many barrier isl<strong>and</strong>s,dredge-<strong>and</strong>-fill areas originally reclaimed by filling wetl<strong>and</strong>s, <strong>and</strong> low-lying portions ofmany coastal cities including Boston, Philadelphia, Washington D.C., Charleston, <strong>and</strong>New Orleans. The gradual inundation from recent sea-level rise is evident in many areasof the mid-Atlantic <strong>and</strong> Louisiana, where high tides regularly flood roads <strong>and</strong> l<strong>and</strong>that were previously dry (Craghan et al., 2010) as well as st<strong>and</strong>s of ghost forests wheretrees were killed recently by brackish water (Cahoon et al., 2009; Williams et al., 2009).In some cases, the local sea-level rise has been enhanced by the local or regional l<strong>and</strong>subsidence.Historic to Present-day Sea-level RiseAnalyses of historic relative sea level records from tide gauges around the U.S. <strong>and</strong> theworld (Figures 2-3, 2-4) show that global sea level rose, on average, 19 centimeters duringthe 20th century at highly variable regional rates influenced by many factors, includingvariations in ocean density, ocean currents, <strong>and</strong> circulation patterns (Jevrejeva et al.,2008; Woodworth et al., 2008; Zervas, 2009). Rates of global sea-level rise are derivedfrom relative rates obtained from gauge data <strong>and</strong> exclude regional <strong>and</strong> local affects suchas l<strong>and</strong> subsidence <strong>and</strong> uplift. A number of studies <strong>and</strong> assessments conducted in recentyears suggest that the rate of sea-level rise is likely to increase significantly during the21st century <strong>and</strong> beyond (Anderson et al., 2010; IPCC, 2007; Jevrejeva et al., 2011; Mitchumet al., 2010; Pfeffer et al., 2008; Rahmstorf, 2007, 2010). although uncertainty existsin quantitatively predicting the exact magnitude <strong>and</strong> rate of future change in sea level,compelling scientific observations from tide gauge records <strong>and</strong>, more recently, satellitealtimetry (Figures 2-5, 2-6) show that sea-level rise has been increasing since about themid-19th century from an average of 1.7 millimeters/year during the 20th century to acurrent rate of greater than 3 millimeters/year, which represent a significant increasein the past two decades over 20th century rates (Gehrels, 2010; Hamlington et al., 2011;Holgate & Woodworth, 2004; Merrifield et al., 2009; Yin et al., 2011). The main causes aremelting of alpine glaciers, Greenl<strong>and</strong> <strong>and</strong> Antarctic outlet glaciers, <strong>and</strong> thermal expansionof the oceans (IPCC, 2007). A more complete discussion of future projections <strong>and</strong>scenarios of sea-level rise by the year 2100 (Figure 2-7) can be found in Section 2.2 of thischapter.Other <strong>Coastal</strong> <strong>Climate</strong> Change TrendsChange in both short- <strong>and</strong> longer-term interannual to decadal atmospheric phenomenahave profound effects on the coastal zone. Average global l<strong>and</strong> <strong>and</strong> sea surface temperaturesare continually increasing, with 2010 as the hottest on record (Blunden et al., 2011).Increased atmospheric temperature <strong>and</strong> atmospheric changes such as El Niño <strong>and</strong> LaNiña induce direct affects such as sea-level rise <strong>and</strong> also cause changes in frequency,intensity, <strong>and</strong> duration of drought, precipitation, <strong>and</strong> storm events. The 2009/2010 ElNiño transitioned to the 2010/2011 La Niña period with a Pacific Ocean temperature1 degree Celsius decrease. This change induced other changes in atmospheric conditionsfavorable for Atlantic tropical storm cyclogenesis, such as weak wind shear. However,2010 was atypical with no named storms in the Gulf of Mexico <strong>and</strong> no l<strong>and</strong>-fallingU.S. storms. The lack of l<strong>and</strong>-falling U.S. storms was attributed to several factors <strong>and</strong>
20 <strong>Coastal</strong> <strong>Impacts</strong>, <strong>Adaptation</strong>, <strong>and</strong> <strong>Vulnerabilities</strong>Figure 2-3 Annual averages of globalmean sea level in millimeters from1870 based on tide gauge <strong>and</strong> satellitedata. The red curve shows sea-levelfields since 1870 (updated fromChurch & White, 2006); the blue curvedisplays tide gauge data from Holgate<strong>and</strong> Woodworth (2004), <strong>and</strong> the blackcurve is based on satellite observationsfrom Leuliette et al. (2004). Verticalerror bars show 90 percent confidenceintervals for the data points. Source:CCSP, 2009; IPCC, 2007.Figure 2-4 U.S. sea-level trends from 1900-2003 basedon NOAA tide gauge records. High variability is due togeophysical <strong>and</strong> oceanographic regional differences.Source: Zervas, 2009.interrelated atmospheric anomalies (Bluden et al., 2011). The 2011 North Atlantic hurricaneseason tied for the third most active season since historic record keeping beganin 1851, although earlier years in the storm record are likely underestimates of the truenumber of storms due to limited sampling by ship traffic (Vecchi & Knutson, 2011). Onlyone major storm, Hurricane Irene, struck the U.S. coast, but it caused $10 billion dollarsin damage <strong>and</strong> the death of 55 people.
Physical <strong>Climate</strong> Forces 21Figure 2-5 The topography of the ocean. Average sea level in the Gulf Stream is unusually highbecause the warmer waters are less dense. The Gulf Stream also draws water away from the AtlanticCoast, making local sea level unusually low. Future changes in ocean currents are likely to affectregional changes in sea level. Source: Commonwealth Scientific <strong>and</strong> Industrial Research Organization(http://www.cmar.csiro.au/sealevel), using data from Pavlis et al., 2008.Current trends in precipitation affect the coastal environment with too little or toomuch precipitation, affecting marsh <strong>and</strong> wetl<strong>and</strong> vegetation, river runoff, <strong>and</strong> infrastructure.Global average annual precipitation was about 5 percent above normal withhigh regional variability. Overall, ocean salinity has stayed similar to 2004 conditionswith anomalous regions continuing to be saltier <strong>and</strong> fresher regions continuing to beanomalously fresh. Rising sea levels contribute to increased salinities within the coastalzone <strong>and</strong> induce wetl<strong>and</strong> transitions. Recent progress has been made in the tools thatassess <strong>and</strong> model climate impacts to the coastal zone <strong>and</strong> systematically capture criticalspatial <strong>and</strong> temporal measurements of high resolution data sets for monitoring changes(Bluden et al., 2011).
22 <strong>Coastal</strong> <strong>Impacts</strong>, <strong>Adaptation</strong>, <strong>and</strong> <strong>Vulnerabilities</strong>Figure 2-6 The highly variable spatial distribution of the rates of sea-level change, plotted about theglobally averaged rate of rise for the period 1992 to 2011, as measured from satellite altimeter data.Source: NOAA Laboratory for Satellite Altimetry.The Basis for ConcernRising global temperatures are likely to accelerate the rate of sea-level rise for threereasons:1. Ocean water exp<strong>and</strong>s when heated;2. A warmer climate causes glaciers <strong>and</strong> the polar ice sheets in Greenl<strong>and</strong> <strong>and</strong> Antarcticato melt more rapidly; <strong>and</strong>3. The ocean warming <strong>and</strong> ice sheet melting can accelerate the speed at which iceshelves disintegrate <strong>and</strong> outlet glaciers flow from Greenl<strong>and</strong> <strong>and</strong> Antarctica tothe oceans.The current rate of global carbon emissions has increased by half in the last 20 years<strong>and</strong>, at these rates, continually reduces any chance of holding global temperature rise toless than 2 degrees Celsius above pre-industrial levels. Global carbon emissions are likelyto continue to increase at a rate of about 3 percent per year (Peters et al., 2011). Futureconcern regarding coastal climate is based on the effects of increased atmospheric <strong>and</strong>ocean temperature <strong>and</strong> changes in flooding frequencies from precipitation, hurricanes,<strong>and</strong> storms. An increase in extreme flood events can be detrimental to coastal wetl<strong>and</strong>s
Physical <strong>Climate</strong> Forces 23that survive within a range of elevations, seasonal temperature, precipitation, <strong>and</strong> ebb<strong>and</strong> flood tides. For certain species, too much precipitation can have as much impact astoo little precipitation can have. For example, for oysters, spawning is affected by toomuch freshwater in the spring <strong>and</strong> too much saltwater in the summer, both of which caninduce diseases. An increase in extreme flooding <strong>and</strong> episodic events can increase turbidity,cause wetl<strong>and</strong> loss, <strong>and</strong> induce stress to submerged plants <strong>and</strong> coral reefs.Strong scientific consensus now suggests that the frequency of some climate extremeevents is increasing <strong>and</strong> evidence exists that some extremes have increased as a result ofanthropogenic influences (Peters et al., 2011). A December 2011 news release by NOAAreported that the U.S. experiences 12 disasters in 2011 that cost a billion or more dollars,totaling losses of about $53 billion. Several were coastal storms <strong>and</strong> the 2011 losses weregreater than the previous record year in 2008. The global frequency of tropical storms isprojected to remain about the same with an increase in the number of extreme events.“Average tropical cyclone maximum wind speed is likely to increase, although increasesmay not occur in all ocean basins. It is likely that the global frequency of tropical cycloneswill either decrease or remain essentially unchanged” (IPCC, 2011). Hurricanes<strong>and</strong> episodic storm events have been observed to have many direct physical impacts.These factors are likely to contribute to increased erosion, flooding, wetl<strong>and</strong> loss, <strong>and</strong>damage to infrastructure.2.2 Sea-level Rise <strong>and</strong> Future ScenariosGlobal sea-level rise is expected to continue through the end of the next century <strong>and</strong>beyond, which will significantly impact the U.S. <strong>and</strong> the world. Past trends providevaluable evidence in preparing for future environmental change but are insufficient bythemselves for assessing the risks associated with an uncertain future. The wide range ofestimates for global mean sea-level rise are scattered throughout the scientific literature<strong>and</strong> other high profile assessments such as previous reports of the NCA <strong>and</strong> the IntergovernmentalPanel on <strong>Climate</strong> Change (IPCC). Currently, no coordinated, interagencyeffort exists in the U.S. to identify agreed upon global mean sea-level rise estimates forthe purposes of coastal planning, policy, <strong>and</strong> management. This is an important gapbecause identifying global mean sea-level rise estimates is a critical step in assessingcoastal impacts <strong>and</strong> vulnerabilities. At present, coastal managers are left to identify globalsea-level rise estimates through their own interpretations of scientific literature or theadvice of experts on an adhoc basis. For these reasons, the NCA Development <strong>and</strong> AdvisoryCommittee requested a report entitled Global Mean Sea-level Rise Scenarios for theU.S. NCA (Parris et al., 2012). This report provides a synthesis of the scientific literatureon global sea-level rise <strong>and</strong> a set of global mean sea-level rise scenarios to describe futureconditions <strong>and</strong> assess potential vulnerabilities <strong>and</strong> impacts.Scenario PlanningScenarios do not predict future changes; instead, they describe future potential conditionsin a manner that supports decision-making under conditions of uncertainty (Gray2011; Moss et al., 2010; Weeks et al., 2011). Scenarios are used to develop <strong>and</strong> test decisionsunder a range of plausible futures. This approach strengthens an organization’s
24 <strong>Coastal</strong> <strong>Impacts</strong>, <strong>Adaptation</strong>, <strong>and</strong> <strong>Vulnerabilities</strong>ability to recognize, adapt to, <strong>and</strong> take advantage of changes over time. Using a commonset of scenarios across different regions <strong>and</strong> sectors to frame the range of uncertaintiessurrounding future environmental conditions is a relatively new NCA initiative. Thisreport provides scenarios to help assessment experts <strong>and</strong> their stakeholders analyze thevulnerabilities <strong>and</strong> impacts associated with uncertain possible futures.Probabilistic projections of future conditions are another form of scenarios not usedin the Sea-level Rise Scenarios because this method remains an area of pending research(Parris et al., 2012). No widely accepted method is currently available for producingprobabilistic projections of sea level rise at actionable regional <strong>and</strong> local scales. <strong>Coastal</strong>management decisions based solely on most probable or likely outcome can lead to maladaptedor vulnerable assets (Gray, 2011; Weeks et al., 2011). Given the range of uncertaintyin future global sea-level rise, using multiple scenarios, none more likely than theother, encourages experts <strong>and</strong> decision makers to consider multiple future conditions<strong>and</strong> to develop multiple response options. Scenario planning offers an opportunity toovercome decision-making paralysis <strong>and</strong> initiate actions now to reduce possible futureimpacts <strong>and</strong> vulnerabilities. Thus, specific probabilities or likelihoods are not assignedto individual scenarios, <strong>and</strong> none of these scenarios should be used in isolation.Global Mean Sea-level Rise ScenariosBased on numerous scientific studies, there is very high confidence (>9 in 10 chance) thatglobal mean sea level will rise at least 0.2 meters <strong>and</strong> no more than 2.0 meters by 2100(Parris et al., 2012). Global mean sea-level rise can be estimated from physical evidencesuch as observations of sea level <strong>and</strong> l<strong>and</strong> ice variability (Pfeffer et al., 2008), expertjudgment (NRC, 1987, 2011, 2012), general circulation models (GCMs) (IPCC, 2007a),<strong>and</strong> from semi-empirical methods that utilize both observations <strong>and</strong> general circulationmodels (Grinsted et al., 2009; Horton et al., 2008; Jevrejeva et al., 2010; Vermeer & Rahmstorf,2009).In recent decades, the dominant contributors to global sea-level rise have been oceanwarming (thermal expansion) <strong>and</strong> ice sheet loss. Many previous studies, including theIPCC, assume thermal expansion to be the dominant contributor; however, the NRC(2012) recently reports that advances in satellite measurements indicate ice sheet loss asa greater contributor to global sea-level rise than thermal expansion over the period of1993 to 2008. Our scenarios are based on four estimates of global sea-level rise by 2100that reflect different degrees of ocean warming <strong>and</strong> ice sheet loss (Table 2-2 <strong>and</strong> Figure2-7).Key Uncertainties on the Global Sea-level Rise ScenariosAt this stage, the greatest uncertainty surrounding estimates of future global sea-levelrise is the rate <strong>and</strong> magnitude of ice sheet loss, primarily from Greenl<strong>and</strong> <strong>and</strong> West Antarctica.The Highest Scenario of global sea-level rise by 2100 is derived from a combinationof estimated ocean warming from the IPCC AR4 global sea-level rise projections<strong>and</strong> a calculation of the maximum possible glacier <strong>and</strong> ice sheet loss by the end of thecentury (Pfeffer et al., 2008). The Highest Scenario should be considered in situationswhere there is little tolerance for risk. Our Intermediate-High Scenario is based on anaverage of the high end of ranges of global mean SLR reported by several studies using
Physical <strong>Climate</strong> Forces 25Table 2-2: Global Sea-level Rise ScenariosScenarioSea-level Rise by 2100 (meters)Highest 2.0Intermediate-High 1.2Intermediate-Low 0.5Lowest 0.2Source: Parris et. al., 2012semi-empirical approaches. Semi-empirical projections utilize statistical relationshipsbetween observed sea level change, including recent ice sheet loss, <strong>and</strong> air temperature.Our Intermediate-Low Scenario is based on the upper end (95% confidence interval) ofIPCC Fourth Assessment Report (AR4) global SLR projections resulting from climatemodels using the B1 emissions scenarios. The Intermediate-High Scenario allows experts<strong>and</strong> decision makers to assess risk from ice sheet loss, but to a limited extent. TheIntermediate Low Scenario allows experts <strong>and</strong> decision makers to assess risk primarilyfrom ocean warming.Figure 2-7 Global mean sea-level rise scenarios developed for the 2013. Present Mean Sea Level(MSL) for the U.S. coasts is determined from the National Tidal Datum Epoch (NTDE) provided byNOAA. The NTDE is calculated using tide gage observations from 1983 – 2001. Therefore, we use1992, the mid-point of the NTDE, as a starting point.
26 <strong>Coastal</strong> <strong>Impacts</strong>, <strong>Adaptation</strong>, <strong>and</strong> <strong>Vulnerabilities</strong>The Lowest Scenario is based on a linear extrapolation of the historical sea-level riserate derived from tide gauge records beginning in 1900 (1.7 millimeters/year). The LowestScenario also coincides with the lower end (95% confidence interval) of the IPCC AR4global sea-level rise projection derived from climate model simulations using the B1emissions scenario. The rate of global mean sea-level rise derived from satellite altimetry(1992 to 2010) has been substantially higher (3.2 millimeters/year), approaching twicethe rate of the longer historical record from tide gauges. The 18-year altimeter recordis insufficient in duration for projecting century-scale global sea-level rise. Trends derivedfrom the shorter records are less reliable as projections because they are affectedby decadal <strong>and</strong> interannual climate <strong>and</strong> oceanographic patterns that are superimposedupon the long-term change of global sea level (Sallenger, 2012). The Lowest Scenarioshould only be considered where there is a great tolerance for risk.Observations of global mean sea-level rise <strong>and</strong> increasing global mean temperaturedemonstrate highly significant correlation (Rahmstorf et al., 2011; Vermeer & Rahmstorf,2009), <strong>and</strong> the IPCC (2007a) <strong>and</strong> more recent studies (Schaeffer et al., 2012) anticipatethat global mean sea level will continue to rise even if warming declines. OurIntermediate-Low <strong>and</strong> Lowest Scenarios are optimistic scenarios of future environmentalchange assuming limited ice sheet loss <strong>and</strong> historical rates of ocean warming (i.e.,thermal expansion).Ice Sheet LossOther studies (Rohling et al., 2008) have arrived at even greater estimates of global meansea-level rise than the Highest Scenario, but we are less confident in the plausibilityof those estimates in this century; however, we do recognize the plausibility of greaterthan 2 meter rise particularly beyond 2100. The IPCC AR4 produced some of the morewidely used projections of global sea-level rise for the 21st century (IPCC, 2007a). TheIPCC projections included thermal expansion, contributions from glaciers, <strong>and</strong> modeledpartial ice sheet contributions among other factors; however, the IPCC AR4 estimatesdid not include potential rapid dynamic response of Greenl<strong>and</strong> <strong>and</strong> Antarctic Ice Sheetsas reflected in our Highest Scenario.A growing body of recently published work suggests that, due to increasing loss,the great polar ice sheets in Greenl<strong>and</strong> will become much more significant contributorsto global sea-level rise in the future (NRC, 2012; Rignot et al., 2011; Van den Broeke etal., 2011; Vermeer & Rahmstorf, 2009). Ice sheet contributions to global mean sea-levelrise stem from mass loss brought about by melting <strong>and</strong> discharge of ice into the oceanat marine-terminating glaciers <strong>and</strong> ice streams (NRC, 2012). Multiple reports indicatethat mass loss of both the Greenl<strong>and</strong> <strong>and</strong> Antarctic ice sheets may have accelerated overthe past two decades despite high interannual variability in space <strong>and</strong> time (Chen et al.,2011; NRC, 2012; Rignot et al., 2011; Van den Broeke, 2011). Regional variability of massloss for the Greenl<strong>and</strong> ice sheet over the past few years shows that areas of acceleratingdeterioration changed from the southeast part of the ice sheet to the northwest part, suggestinghigh sensitivity of the Greenl<strong>and</strong> ice sheet to regional climate (Chen et al., 2011).In Antarctica, ice loss is occurring in some coastal areas, <strong>and</strong> ice accumulation is occurringin interior Antarctica. While the balance between ice loss <strong>and</strong> accumulation remainsan area of investigation, recent observations suggest that ice loss has been greater.
Physical <strong>Climate</strong> Forces 27Most of the ice loss in Antarctica has come from the West Antarctic ice sheet (Rignotet al., 2008). A significant portion of the West Antarctic ice sheet is floating at or groundedbelow sea level, as are relatively smaller parts of the ice sheets in East Antarctica<strong>and</strong> Greenl<strong>and</strong>. Floating ice shelves support l<strong>and</strong>-based ice sheets; thus, current <strong>and</strong> futureocean warming below the surface make ice shelves susceptible to catastrophic collapse,which, in turn, can trigger increased ice discharge to the ocean (Jacobs et al., 2011;Joughlin <strong>and</strong> Alley, 2011; Rignot et al., 2004; Scambos et al., 2004; Yin et al., 2011). Betterunderst<strong>and</strong>ing of how the polar ice sheets will respond to further changes in climaticconditions over the 21st century requires continued development of physical models(Price et al., 2011).Ice sheet melting will lower the gravitational attraction ice sheets have for surroundingseas, producing spatial variability in changes to global mean sea level (Kopp et al.,2010; Mitrovica et al., 2001, 2009). Although seemingly counterintuitive, sea level fallsclose to the ice sheets even though water from ice melt is discharged into the sea. Thislowering of sea level is due to gravitational effects that can cause sea-level rise up to~2,000 kilometers from the melting ice sheet. Sea-level rise resulting from deteriorationof the Greenl<strong>and</strong> ice sheet is thought to be relatively lower than the global averagefor the contiguous U.S., Alaska, <strong>and</strong> U.S. territories in the Caribbean Sea <strong>and</strong> relativelyhigher for Hawaii <strong>and</strong> U.S. territories in the Pacific Ocean (Kopp et al., 2010). Sea-levelrise resulting from deterioration of the West Antarctic ice sheet is thought to be relativelyhigher than the global average for all states <strong>and</strong> territories of the U.S. (Mitrovicaet al., 2009).Developing Regional <strong>and</strong> Local ScenariosThe development of sea-level change scenarios at global, regional, <strong>and</strong> local scales is aninitial stage in conducting coastal vulnerability assessments. Parris et al. (2012) recommendsthat the choice of scenarios involve interdisciplinary scientific experts as well ascoastal managers <strong>and</strong> planners who underst<strong>and</strong> relevant decision factors. These scenariosprovide a set of plausible trajectories of global mean sea-level rise for use in assessingvulnerability, impacts, <strong>and</strong> adaptation strategies. None of these scenarios shouldbe used in isolation, <strong>and</strong> experts <strong>and</strong> coastal managers should factor in locally <strong>and</strong> regionallyspecific information on climate, physical, ecological, <strong>and</strong> biological processes<strong>and</strong> on the culture <strong>and</strong> economy of coastal communities. The NOAA <strong>Coastal</strong> ServicesCenter <strong>and</strong> the USGS also provide access to information via Digital Coast, including twocompanion reports on developing sea-level scenarios (NOAA, 2010, 2012).Scientific observations at the local <strong>and</strong> regional scale are essential to action, but globalphenomena such as sea-level rise can influence those conditions creating unanticipatedimpacts at the local scale, especially over longer time horizons. Thous<strong>and</strong>s of structuresalong the U.S. coast are over fifty years old, including vital storm <strong>and</strong> waste water systems.Thus, coastal vulnerability, impact, <strong>and</strong> adaptation assessments require an underst<strong>and</strong>ingof the long-term, global, <strong>and</strong> regional drivers of environmental change.2.3 Extreme Events <strong>and</strong> Future ScenariosVariability of tropical cyclone frequency, track, <strong>and</strong> intensity is highly relevant to coastal
28 <strong>Coastal</strong> <strong>Impacts</strong>, <strong>Adaptation</strong>, <strong>and</strong> <strong>Vulnerabilities</strong>interests because of the associated risk of damage <strong>and</strong> loss of life during l<strong>and</strong>fall eventsas well as the significant role that tropical cyclones can play in maintaining regionalwater resources (Jiang & Zipser, 2010). Atlantic tropical cyclone variability is closely correlatedwith tropical Atlantic climate variability on a broad range of time-scales. A majorchallenge in detecting past trends in various measures of tropical cyclone activity is theneed to identify the causal factors underpinning the observed Atlantic climate variability,which is required to separate tropical cyclone variability into naturally <strong>and</strong> anthropogenicallyforced constituents. Even when regional climate variability can be attributed toanthropogenic causes, the question of how tropical cyclones respond to such variabilityremains. For example, studies have detected a tropical Atlantic sea surface temperaturewarming trend due to increasing greenhouse gases (Gillett et al., 2008; Karoly & Wu,2005; Knutson et al., 2006; Santer et al., 2006), but the question of how tropical cyclonesrespond to sea surface temperature changes under global warming remains (Johnson &Xie, 2010; Knutson et al., 2008; Kunkel et al., 2011).Detection of past trends in Atlantic tropical cyclone activity is also significantly constrainedby the quality of the historical data records (Knutson et al., 2010; Kunkel etal., 2011). Attempts to detect trends in l<strong>and</strong>falling tropical cyclone events are furtherconstrained by the reduced data sample size associated with parsing of the data <strong>and</strong> arealso substantially challenged by tropical cyclone track variability (Kossin & Camargo,2009). This variability is driven largely by r<strong>and</strong>om fluctuations in atmospheric steeringcurrents <strong>and</strong> introduces substantial noise into time series of U.S. l<strong>and</strong>falling tropicalcyclone activity, which show no statistically significant long-term trends (L<strong>and</strong>sea,2005; Vecchi & Knutson 2011). Atlantic tropical cyclone track variability is also driven bymore systematic climatic forcings such as the El Niño-Southern Oscillation, North AtlanticOscillation, Atlantic Meridional Mode, <strong>and</strong> Madden-Julian Oscillation (Kossin et al.,2010), but uncertainty still remains regarding how these modes of variability respond toclimate change (Collins et al., 2010). Even modest tropical cyclone track variability canlead to large differences in associated coastal impacts. When compounded by uncertaintiesin the historical data, this severely challenges detection-attribution studies as wellas disaster risk reduction in specific coastal regions. Only very low confidence can be offeredthat any trends in tropical cyclone activity reported within specific coastal regionsare detectable.Regarding global hurricane or tropical cyclone activity, an expert team of the WorldMeteorological Organization (Knutson et al., 2010) concluded that by the late 21st century,greenhouse warming would likely cause: 1) the global number of tropical cyclonesto remain at current levels or to decrease by up to one-third; 2) the average intensityof tropical cyclones to increase by up to 10 percent; <strong>and</strong> 3) near-storm rainfall rates toincrease by roughly 20 percent. For Atlantic basin tropical cyclone activity, the 21st centuryclimate model projections summarized in Knutson <strong>and</strong> colleagues’ work (2010; <strong>and</strong>updated in Tables S1-S4 of this report) show a much larger range of uncertainty thanthe global projections. For example, the model projections from 14 studies for Atlantictropical storm frequency for the late 21st century range from about a 60 percent increaseto about a 60 percent decrease relative to current levels (Table S1). Thus, projections ofthe sign of Atlantic tropical storm frequency change are offered at very low confidence.Model or theoretical projections for Atlantic hurricane intensity range from an 8 percentdecrease to a 14 percent increase (Table S3) with a clear tendency for an increase
Physical <strong>Climate</strong> Forces 29(low to moderate confidence). Models consistently projected increases of near-storm rainfallrates (moderate confidence) with projections averaged within 100 kilometers of stormcenter ranging from about 5 percent to over 20 percent. These precipitation results werebased on six studies reporting Atlantic basin results or multi-basin results that includethe Atlantic <strong>and</strong> based on storms of tropical storm intensity or greater. Similar resultsfor tropical cyclone frequency, intensity, <strong>and</strong> precipitation rates were reported for theNortheast Pacific basin, with tropical storm frequency projections ranging from about-70 percent to +80 percent (very low confidence in sign of change) <strong>and</strong> intensity changesranging from about -5 percent to +20 percent (low to moderate confidence in an increase).Specific northeast Pacific region results have not been reported for near-storm precipitationrates, although relevant multi-basin studies report increases (moderate confidence)ranging from about +5 percent to over +20 percent.Two dynamical modeling studies (Bender et al., 2010; Murakami et al., 2011) haveexplored present-day simulations <strong>and</strong> 21st century projections of intense Atlantic <strong>and</strong>/or Northeast Pacific hurricane frequency (category 4 <strong>and</strong> 5, with wind speeds exceeding131 miles per hour or 210 kilometers/hour; or category 5, with wind speeds exceeding155 miles per hour or 249 kilometers/hour). For the 21st century projections, both studiesuse an average projected climate trend calculated from 18 different CMIP3 globalclimate models under an assumed A1B future emission scenario (Table S2). The Benderet al. (2010) study, using a regional model/case study approach, projects a 10 percentincrease per decade (i.e., 100 percent increase over the 21st century) in Atlantic basin category4-5 frequency, based on the multi-model ensemble climate change; however, notall of the individual models used to derive this value indicate an increase in frequencyof Atlantic category 4-5 hurricanes. The Murakami et al. (2011) study (with auxiliary informationprovided by Dr. H. Murakami, personal communication, 2011) projects a nonsignificantincrease in category 4-5 storm days in the Atlantic basin (+15 percent) <strong>and</strong>globally (+4 percent) but a significant (+180 percent) increase in the NE Pacific basin. Forcategory 5 storm days, their model projects significant increases (+56 percent globally,<strong>and</strong> +290 percent in the Atlantic basin). Several important caveats to these results shouldbe noted. First, the Bender et al. (2010) model has a substantial (~50 percent) low bias intheir simulation of Atlantic category 4-5 hurricane frequency under present climate conditions.Murakami et al. (2011) report a relatively small bias in their present-day simulationof Atlantic category 5 storm days but a large positive bias (almost a factor of 4) intheir simulation of Atlantic category 4-5 storm days <strong>and</strong> a substantial low bias in NEPacific category 4-5 storm days. In addition, the global model used by Murakami et al.does not include an interactive ocean component, in contrast to the regional case studymodel of Bender et al. In summary, we have low to moderate confidence in projections of anincrease in intense hurricane frequency in the Atlantic basin.A general caveat to available results reported here is the focus on basin-wide activitymeasures, which do not necessarily correlate in an obvious way to coastal eventsbecause l<strong>and</strong>falling activity is intimately related to storm track variability, which itself isalso linked to climate variability <strong>and</strong> change (Kossin et al., 2010). U.S. l<strong>and</strong>falling tropicalstorm or hurricane activity in particular are explored in limited studies (Knutsonet al., 2008; Villarini et al., 2011); thus, the above projections, <strong>and</strong> particularly those ofintense hurricane activity, may be considered as early attempts at scenario developmentwith respect to U.S. l<strong>and</strong>falling activity.
30 <strong>Coastal</strong> <strong>Impacts</strong>, <strong>Adaptation</strong>, <strong>and</strong> <strong>Vulnerabilities</strong>Exposure of coastal areas to devastating storm surge <strong>and</strong> waves will increase withthe ever- increasing population that seeks to reside along the coast <strong>and</strong> its accompanyinginfrastructure. The storm surge threat will be exacerbated by relative sea-level rise<strong>and</strong> potentially by climate induced changes in frequency <strong>and</strong> intensity of hurricanes. Ashurricanes approach the coast, four storm-related phenomena can occur to modify localwater levels: set up due to wind, low barometric pressure, set up due to wave forcing,<strong>and</strong> rainfall. Storm winds force water towards the coast <strong>and</strong> typically create the greatestchange in local water elevation. Low barometric pressure provides a secondary effect,creating a bulge in the water surface around the center of the storm. Wave forcing createsan increase in the mean water level due to breaking waves at the coast. Storm rainfallcan also increase the local water elevation. Additional factors not related to the stormitself are the astronomical tide <strong>and</strong> river flows at the time the storm reaches the coast.Storm surges are also greatly influenced by the geometry of the basin <strong>and</strong> continentalshelf leading up to the coastal floodplain. A mildly sloping continental shelf, such as inthe Gulf of Mexico, results in a higher storm surge as compared to a coast with a steeperbathymetry.Several recent studies (Irish et al., 2008; Irish & Resio, 2010; Resio et al., 2009) haveshown that the maximum surge can be estimated as a function of several storm parametersincluding storm intensity, size, <strong>and</strong> motion as well as the alongshore position ofthe point of interest relative to the l<strong>and</strong>fall position. In general, the primary drivers ofsurge potential are storm intensity <strong>and</strong> size. Projected increases in storm intensity due toglobal warming will result in greater storm surge potential. Extensive studies with thenumerical model ADCIRC (Westerink et al., 1992, 2007) indicate that, for small to moderatelysized storms, peak alongshore surge increases about 30 centimeters per 10 mb ofintensification. For large storms, peak alongshore surge increases about 40 centimetersper 10 mb (Irish et al., 2009).Storm surge potential is also increased by global warming induced sea-level rise dueto the mean water level increase as well as the complex interaction of storms <strong>and</strong> thecoastal l<strong>and</strong>scape. Data <strong>and</strong> numerical simulations have shown that l<strong>and</strong>scape features<strong>and</strong> vegetation cover have the potential to reduce inl<strong>and</strong> storm surge elevations alongthe coast by slowing the surge propagation (Wamsley et al., 2009, 2010). Elevations greaterthan the storm surge elevation provide a physical barrier to the surge. Even when inundated,l<strong>and</strong>scape features <strong>and</strong> vegetation have the potential to create friction <strong>and</strong> slowthe forward speed of the storm surge, effectively reducing inl<strong>and</strong> water levels. Higherwater levels resulting from sea-level rise can modify wetl<strong>and</strong> vegetation type <strong>and</strong> mayalso lead to wetl<strong>and</strong> loss, shoreline erosion, erosion of barrier isl<strong>and</strong>s through overwash<strong>and</strong> breaching, <strong>and</strong> an overall change in the local morphology such as isl<strong>and</strong>s transformingto submerged shoals <strong>and</strong> wetl<strong>and</strong>s becoming open lakes or bays. Therefore,storm surge response does not increase linearly with sea-level rise in some coastal areasbecause of differences in slope of the coastal plain. Numerical simulations by Smith etal. (2010) indicate that for deltaic areas such as south Louisiana, the nonlinear responseto sea-level rise is greatest in areas of modest surge (2-3 m). These areas may experiencesurges two to three times the amount of sea-level rise. Thus, in a statistical analysis ofwater levels, the long return period water levels would increase modestly above the sealevelrise, but shorter return period water levels could increase significantly.
Physical <strong>Climate</strong> Forces 31A number of recent studies have estimated the impact of sea-level rise on the frequencyof extreme coastal inundation events due to storm passage. In a warming climate,storm frequency, intensity, rainfall, <strong>and</strong> sea level are all projected to change,affecting storm inundation frequency <strong>and</strong> magnitude. Sea-level rise <strong>and</strong> storm-rainfallrate increases are the more robust projections as described above, <strong>and</strong> both can leadto increased surge <strong>and</strong> flooding. Kirshen et al. (2008) project sea-level rise onto timeseriesof past surge events in the U.S. Northeast to estimate that the 2005 100-year-eventwill become the 30-70 year event by 2050 depending on sea-level rise scenario. Largerchanges are projected for particularly exposed locales such as Boston <strong>and</strong> Atlantic City.The Kirshen et al. analysis includes all surge sources, including tropical cyclones <strong>and</strong>nor’easters. Cayan et al. (2008) perform a related analysis for coastal California, obtaininglarge increases by mid-21st century in the annual number of hours with sea levelabove 99.99 percent of the historical values. Park et al. (2011) incorporate sea-level riseprojections in statistical analysis of historic surge events on South Florida <strong>and</strong> find thatthe 50- year surge on Key West increases from 0.5 meters historically to 0.8-1.1 meters by2060 depending on sea-level rise scenario. They find comparable changes elsewhere inSouth Florida.Fewer studies have examined the impact of changes in tropical cyclone characteristicsin addition to sea-level rise on flooding. Mousavi et al. (2010) estimate how surgeson coastal Texas would increase with increases in hurricane intensity as well as sea-levelrise by re-scaling key historical l<strong>and</strong>falling storms with an assumed 8 percent higherintensity through central pressure fall per degree Celsius of sea surface temperatureincrease. They estimate that, for a catastrophic storm event on Corpus Christi, basedon a re-scaled Hurricane Carla, surge height will increase 0.2-0.5 meters by 2030 <strong>and</strong>0.6-1.8 meters by 2080. Sea-level rise <strong>and</strong> increases in storm intensity have comparablecontributions to the increases. Not included, however, is the impact of changing stormfrequency, which would affect return periods.Changes in storm risk along the coasts depends on changes in exposure, storm-relatedhazards, <strong>and</strong> coping mechanisms. If current coastal population <strong>and</strong> development trendscontinue, exposure to storm hazards such as surge, wind, or heavy rainfall will alsoincrease in the next century, but projections of coping mechanisms such as improvedbuilding codes <strong>and</strong> restoration of wetl<strong>and</strong> vegetation are much more uncertain. Anysea-level rise is virtually certain to exacerbate storm-related hazards, but projectionsof the magnitude of sea-level rise in specific regions (see also sections 2a,b above) canonly be offered with low confidence <strong>and</strong> further uncertainties exist related to the effects ofchanges in storm-related hazards along the coasts. However, given the likelihood of continuedincreases in exposure due to demographic pressure, <strong>and</strong> the likelihood of furtherincreases in sea level, continues increases of storm-related risk along the coasts are likelyin the 21st century.2.4 Changes in Wave Regimes <strong>and</strong> Circulation PatternsWave RegimesWinds <strong>and</strong> waves control the flux of energy from the atmosphere to the ocean. Intensecyclones <strong>and</strong> associated episodes of high waves are important in transmitting the effects
32 <strong>Coastal</strong> <strong>Impacts</strong>, <strong>Adaptation</strong>, <strong>and</strong> <strong>Vulnerabilities</strong>of low-frequency climate variability to both the environment <strong>and</strong> society. The heights ofwaves generated by a storm depend on its wind speeds, the area over which the windsblow, also called the storm’s fetch, <strong>and</strong> on the duration of the storm, all factors thatgovern the amount of energy transferred to the waves. As they travel across the oceanbasins, waves transport the energy they accumulated during storm events <strong>and</strong> dissipateit through many processes. Waves can significantly contribute to the dispersionof pollutants <strong>and</strong> the sorting of sediments on continental shelves. In nearshore regions,wave transformations induce gradients of radiation stresses, which result in longshorecurrents, rip-currents, <strong>and</strong> undertows. In particular, extreme storm events <strong>and</strong> associatedextreme wave heights can have negative effects on beaches, barrier isl<strong>and</strong>s, coastalstructures, maritime works, ships, <strong>and</strong> coastal communities. A major concern for humansociety is whether external influences on the climate system, especially human influence,have affected storm <strong>and</strong> ocean wave climates in the past <strong>and</strong> whether wave climates willevolve under future climate scenarios.Wave heights have been estimated from:1. Visual observations from ships;2. Hindcast analyses;3. Direct measurements by buoys; <strong>and</strong>4. In recent years from satellite altimetry.The reliability of the data ranges widely for these different sources depending on thecollection methodology <strong>and</strong> processing techniques. Wave climates are most easily definedon coasts that are dominated by one type of storm system such as the North Pacificshore of the U.S., where the waves are generated by extratropical storms. The Atlanticshore of the U.S. has two wave climates: one climate consisting of waves from extratropicalstorms such as nor’easters <strong>and</strong> the second being waves generated by tropical cyclonessuch as tropical storms <strong>and</strong> hurricanes. These two types of storm systems are fundamentallydifferent in their modes of formation, largely separate seasons of dominance, <strong>and</strong>distinctive climate controls of their intensities <strong>and</strong> generated waves. They will thereforebe considered separately in this section.Extratropical Storm WavesExtratropical storms are formed at relatively high latitudes by cold air masses movingdown from subpolar regions <strong>and</strong> colliding with warmer air masses. The strongest stormsdevelop during the winter. Considerable attention has been given to the occurrence inrecent decades of increasing wave heights in both the North Atlantic <strong>and</strong> the NortheastPacific generated by these storms.In the Atlantic, the first positive documentation of wave-height increases by waverecords was developed from the Seven Stones light vessel offshore from the southwestcoast of Engl<strong>and</strong> (Bacon & Carter, 1991; Carter & Draper, 1988) with a rate of increase inannual mean significant wave heights of about 2.2 centimeters/year. Wang et al. (2009)found that, in the winter, the observed 1955-2004 patterns in atmospheric storminess<strong>and</strong> ocean wave heights were characterized by an upward trend in the high-latitudesespecially the northeast North Atlantic <strong>and</strong> by a downward trend in the mid-latitudes
Physical <strong>Climate</strong> Forces 33off the coast of the U.S. This result is supported by analyses of buoy data along the EastCoast of the U.S. that did not find an increase for the winter wave heights (Komar & Allan,2008). Wang et al. (2006, 2009) suggest that the changes in the North Atlantic waveclimates are associated with the mean position of the storm track shifting about 181 kilometersnorthward. Gulev <strong>and</strong> Grigorieva (2006) analyzed wind wave climatologiesderived from the visual wave observations of voluntary observing ship (VOS) officers.In both North Atlantic high latitudes <strong>and</strong> North Pacific mid latitudes, winter significantwave heights showed a secular increase from 10 to 40 centimeters per decade during theperiod 1958-2002. Statistical analysis showed that variability in wind sea is closely associatedwith the local wind speed, while swell changes can be driven by the variations incyclone counts, implying the importance of forcing frequency for the resulting changesin significant wave heights (Gulev & Grigorieva, 2006).Increases in wave heights have been found in the Northeast Pacific <strong>and</strong> documentedby measurements from a series of NOAA buoys along the U.S. West Coast (Allan &Komar, 2000, 2006; Komar et al., 2009; Mendez et al., 2006, 2008; Ruggiero et al., 2010a;Seymour, 2011). Analyses by climatologists of North Pacific extra-tropical storms haveconcluded that their intensities, measured as wind velocities <strong>and</strong> atmospheric pressures,have increased since the late 1940s (Favre & Gershunov, 2006; Graham & Diaz, 2001),implying that the trends of increasing wave heights may have begun in the mid-20thcentury earlier than could be documented with the direct measurements of the wavesby buoys.However, the results of studies relying on solely on buoy measurements have recentlybeen called into question after careful analyses of modifications of the wave measurementhardware as well as the analysis procedures since the start of the observationshave demonstrated inhomogeneities in the records (Gemmrich et al., 2011). Accountingfor these changes, trends for the corrected data are substantially smaller than the apparenttrends obtained from the uncorrected data. Of interest, the most significant of thenon-climatic step changes in the buoy records occurred prior to the mid 1980’s. Menendezet al. (2008) analyzed extreme significant wave heights along the northeast Pacificusing data sets from 26 buoys over the period 1985-2007, not including the more suspectdata from earlier in the buoy records. Application of their time-dependent extremevalue model to significant wave heights showed significant positive long term trendsin the extremes between 30-45° N near the western coast of the U.S. They further demonstratedan impact of El Niño on extreme wave heights in the northeast Pacific as wellas important correlations with mid-latitudinal climate patterns such as NP <strong>and</strong> PNAindices. Mendez et al. (2010) extended this work by using two time-dependent extremevalue models <strong>and</strong> three different datasets from buoys, satellite missions, <strong>and</strong> hindcastdatabases. Using reanalysis <strong>and</strong> buoy data, they conclude that the extreme wave climatein the NE Pacific is increasing in the period 1948-2008 at a rate of about 1 centimeter/year<strong>and</strong> 2-3 centimeters/year in the period 1985-2007.Young et al. (2011) used a 23-year database of satellite altimeter measurements toinvestigate global changes in oceanic wind speed <strong>and</strong> wave height from 1985 to 2008.They found a general global trend of increasing wind speed <strong>and</strong>, to a lesser degree, waveheight. For both winds <strong>and</strong> waves, the rate of increase is greater for extreme events ascompared to the mean condition. Although wave heights showed no significant trend
34 <strong>Coastal</strong> <strong>Impacts</strong>, <strong>Adaptation</strong>, <strong>and</strong> <strong>Vulnerabilities</strong>for mean monthly values, at more extreme conditions (99 th - percentile), a clear statisticallysignificant trend can be seen of increasing wave height at high latitudes includingoff the U.S. West <strong>and</strong> East Coasts <strong>and</strong> more neutral conditions in equatorial regions.By analyzing monthly mean significant wave heights rather than extremes, Seymour(2011) also demonstrates a significant increase in wave energy affecting the West Coastof the U.S. during the interval of a 1984-2007. During the same period, a monotonic increasein the positive El Niño portion of the ENSO cycle <strong>and</strong> a monotonic decline in theatmospheric pressure in the Gulf of Alaska could be seen. Seymour (2011) speculates apossible connection between greenhouse gases <strong>and</strong> bigger waves in the North Pacificbecause both of these changes would be expected to produce higher wave energy levels<strong>and</strong> both have been identified as resulting, at least in part, from global climate change.However, Seymour (2011) clearly points out that the wave height record is too noisy <strong>and</strong>too short to establish an estimate of a possible contribution from the changes to globalclimate.Research on trends in mid-latitude extra-tropical storms in the Eastern North Pacifichave confirmed that storm intensity has increased but other research has documented adecrease in frequency, possibly because the storm tracks have shifted poleward duringthe latter half of the 20th century. McCabe et al. (2001) showed a statistically significantdecrease in the frequency of storms over the years 1959-1997; however, Geng <strong>and</strong> Sugi(2003) found that the decrease in annual numbers of storms is typically of the weakmediumstrength variety while the stronger storms have actually increased in frequency.These documented changes in storm tracks are thought to be primarily due to changesin baroclinicity, which in turn is linked to changes in atmospheric temperature distributionsdue to increased greenhouse gas emissions. In other words, in the mid-latitudes ofthe Northern Hemisphere, poles are warming faster than lower latitudes , leading to adecrease in the meridional temperature gradient <strong>and</strong> a decrease in mid-latitude stormfrequency. Recognizing the trends in reanalysis data, Yin (2005) used the output of 15coupled general circulation models to relate the poleward shift of the storm track tochanges in baroclinicity in the 21st century. Though these studies concluded that thestorm track shifts poleward in the Northern Hemisphere with warmer temperatures,uncertainties remain regarding natural variability <strong>and</strong> model limitations.Tropical Cyclone Generated WavesIrish et al. (2011) have shown that historical observations of storm surges contain significantvariations at the scale of the storm size, typically on the order of one or two timesthe radius to maximum winds or about 25-40 kilometers. For this reason, Irish et al.(2011) argued that historical observations alone may not be not good predictors of longtermclimatological characteristics of surges in a coastal area. Wave fields tend to be abit more dispersed, but extreme waves in hurricanes <strong>and</strong> tropical storms tend to exhibitsimilar characteristic scales of variation. In this context, long-term Global <strong>Climate</strong> Modelsimulations should offer a much better estimate of the impacts of climatic variations onfuture wave climates than attempts to used local observations; however, although manypapers have discussed projections of future wave climates based on GCM simulations(Caires et al., 2006; Debenhard & Roed, 2008; Hemer et al., 2010; Mori et al., 2010; Sterles& Caires, 2005; Wang et al., 2004; Wang & Swail, 2006), the numerical models used
Physical <strong>Climate</strong> Forces 35in these projections operate at spatial <strong>and</strong> temporal scales that make inferences aboutwaves generated by tropical storms <strong>and</strong> hurricanes difficult to draw. The smallest scaleused in these simulations is around 20 kilometers (Mori et al., 2010), which, althoughsufficient to resolve the dynamics of wave generation in extratropical storms, is onlymarginally sufficient to resolve them in tropical systems.The Mori et al. (2010) study showed that waves simulated from the GCM ensemblesin his study needed to be adjusted by about 5-15 percent to match observations in thepresent. They assumed that this adjustment would not change in future climates as well<strong>and</strong> chose to use the ratio of wave heights in future climates to the present climate astheir indicator of the impact of climate variability on wave heights. They noted that thechanges in wave climates around the globe showed different signatures for tropical <strong>and</strong>extratropical storm regimes <strong>and</strong> found no clear global trend in wave heights generatedby tropical systems around the world. In areas analyzed in detail by Mori et al. (2010),the changes in wave heights were in the range of -5 percent to +15 percent between thepresent wave climate <strong>and</strong> the projected wave climate for 2100.The expected changes in storm intensity in the Mori et al. (2010) study are in thesame range as those discussed in a recent summary by Knutson et al. (2010). Knutsonet al. (2010) examined the results of several recent studies <strong>and</strong> concluded that globallyaveraged tropical cyclone wind intensity is likely to increase with a projected range of 2to 11 percent by 2100 among the different models (A1B scenario). Knutson et al. (2010)also concluded that global tropical cyclone frequency will either remain unchanged ordecrease somewhat, by 6 to 34 percent, with future global warming by 2100. This rangeof potential changes in intensity <strong>and</strong> frequency, along with difficulties in the resolutionof tropical systems for wave generation <strong>and</strong> early results that indicate that changes intropically-generated wave climate may exhibit significant geographic variations makegeneralizations about potential impacts of climate variability on tropically-generatedwaves difficult to draw at present.<strong>Impacts</strong>If wave climates increase in the future, coastal infrastructure will come under increasedrisk to damage <strong>and</strong> inundation with impacted sectors including transportation <strong>and</strong> navigation;coastal engineering structures such as seawalls, riprap, <strong>and</strong> jetties; flood control<strong>and</strong> prevention structures; water supply <strong>and</strong> waste <strong>and</strong> storm water systems; <strong>and</strong> recreation,travel, <strong>and</strong> hospitality. Due to the dependence of wave runup, <strong>and</strong> thereforetotal water levels, on offshore wave characteristics, an increasing wave climate can significantlyalter the frequency of flooding <strong>and</strong> erosion events along coastlines. Volumetricsediment transport rates are often formulated as nonlinear functions of wave height(Komar, 1998) <strong>and</strong> therefore small increases in wave heights can have impacts on transportrates, gradients in transport rates, <strong>and</strong> resulting morphological changes. Slott et al.(2006) found that moderate shifts in storminess patterns <strong>and</strong> the subsequent effect onwave climates could increase the rate at which shorelines recede or accrete to as muchas several times the recent historical rate of shoreline change. On complex-shaped coastlines,including cuspate-cape <strong>and</strong> spit coastlines, they found that the alongshore variationin shoreline retreat rates could be an order of magnitude higher than the baselineretreat rate expected from sea-level rise alone over the coming century. Working on a
36 <strong>Coastal</strong> <strong>Impacts</strong>, <strong>Adaptation</strong>, <strong>and</strong> <strong>Vulnerabilities</strong>straight s<strong>and</strong>y coastline, Ruggiero et al. (2010b) applied a deterministic one-line shorelinechange model in a quasi-probabilistic manner to test the effects of both wave climate<strong>and</strong> sediment supply variability on decadal-scale hindcasts <strong>and</strong> forecasts. Althoughtheir modeling exercises indicated that shoreline change is most sensitive to changes inwave direction, the effect of an increasingly intense future wave climate had significantimpacts on erosion estimates.However, at present we do not conclusively underst<strong>and</strong> the climate controls onchanging patterns of storminess <strong>and</strong> wave heights <strong>and</strong> therefore have relatively low confidencein our ability to project future trends in coastal storm impacts. For example, themagnitude <strong>and</strong> frequency of major El Niños has significant implications, but at this timewe are unable to assess whether or not these will increase in the future due to climatechange. Given the importance of waves along U.S. coastlines for essentially all planning<strong>and</strong> design considerations, more studies are needed to quantify these effects.Ocean CirculationOur underst<strong>and</strong>ing of the role of climate change in changing patterns of ocean circulationis relatively uncertain. Most studies to date have centered on the Atlantic basinbecause this is where ice melt in Greenl<strong>and</strong> most directly affects key elements of thecirculation. In this basin, the thermohaline circulation (THC) is manifested primarilythrough the meridional overturning circulation (MOC). Few direct measurements of theMOC exist, so quantifying the characteristics of its natural low-frequency variation isdifficult. Instead, much of the variation is inferred from either indirect linkages to oceantemperature patterns, expected variations in stratification related to fresh water fromice melt, <strong>and</strong> coupled models of the atmosphere-ocean system (Latif et al., 2005). Usingreconstructed sea surface temperature datasets <strong>and</strong> century-long ocean <strong>and</strong> atmospherereanalysis products, Wu et al. (2012) recently found that the post-1900 surfaceocean warming rate over the path of subtropical western boundary currents, includingthe Gulf Stream, is two to three times faster than the global mean surface ocean warmingrate. The accelerated warming is associated with a synchronous poleward shift <strong>and</strong>/or intensification of global subtropical western boundary currents in conjunction with asystematic change in winds over both hemispheres. Wu et al. (2012) speculate that thisenhanced warming may reduce the ability of the oceans to absorb anthropogenic carbondioxide over these regions.Increased freshwater inflows due to projections of Greenl<strong>and</strong> Ice Sheet melting areexpected to decrease the strength of the MOC due to changes in ocean salinity <strong>and</strong> temperature;however, as pointed out by Hu et al. (2009, 2011) the impact of this weakeningwill likely not significantly alter the strength of the MOC this century. Overall, thesestudies suggest that the combined effects of sea level due to both steric density changes<strong>and</strong> ocean dynamics might be significant in some regions of the world. The Hu et al.results are relatively consistent with the predictions of Yin et al. (2009) that indicate thatthe overall impact of steric <strong>and</strong> dynamic components of the ocean circulation on sealevel might be in the range of 15-21 centimeters by the end of this century. However, aspointed out by Toggweiler <strong>and</strong> Russell (2008), the role of wind forcing on ocean circulationappears to be somewhat inconsistent with the historical observations, <strong>and</strong> becausemuch of the ocean circulation is related directly or indirectly to wind forcing, resolving
Physical <strong>Climate</strong> Forces 37this difference in underst<strong>and</strong>ing the quantitative value of the current model predictionsis important.2.5 Relative Vulnerability of CoastsThe key factors governing the relative vulnerability of U.S. coastal regions include thephysical setting of specific areas, including their geology, geomorphology, <strong>and</strong> oceanographiccharacteristics, <strong>and</strong> the relevant climate <strong>and</strong> non-climate drivers. The coastlineof the U.S. <strong>and</strong> its territories is highly diverse, ranging from arctic permafrost cliffs tomid-latitude barrier isl<strong>and</strong>s to low-lying tropical atolls. The broad geographic distributionof U.S. <strong>and</strong> territorial coastal environments also means that climate <strong>and</strong> non-climatechange drivers are similarly diverse, varying in form <strong>and</strong> magnitude at regional scales.Assessing coastal vulnerability in this context is challenging because of the many factorsinvolved. Underst<strong>and</strong>ing how the coast will change in the future requires knowledge ofphysical, chemical, biological, <strong>and</strong> social processes that describe l<strong>and</strong>scape <strong>and</strong> habitatchanges <strong>and</strong> of societal adaptation abilities. <strong>Coastal</strong> vulnerability assessments thus requirea multidisciplinary approach that evaluates the joint probability of a wide varietyof global change impacts <strong>and</strong> societal responses; however, current vulnerability assessmentstypically focus on only one variable such as elevation or rate of shoreline change.Physical SettingA number of studies have classified the physical setting of the U.S. coastal zone for purposesof developing vulnerability assessments (Gornitz, 1990, 1991; Shaw et al., 1998;Thieler & Hammar-Klose, 1999, 2000a, b). Variables such as geology, geomorphology, elevation,shoreline change rate, sea-level rise rate, <strong>and</strong> wave <strong>and</strong> tide regime among otherfactors are used to describe the coast according to increasing vulnerability to changedue to sea-level rise. A simple mathematical formula relates the different variables <strong>and</strong>is used to calculate an index value. This method combines estimates of the coastal system’ssusceptibility to change with its natural ability to adapt to changing environmentalconditions, yielding an objective, quantitative measure of the system’s vulnerabilityto sea-level rise. This approach has been applied to a number of locations worldwide;some applications include the addition of societal data <strong>and</strong> location-specific physicalvariables (Aboudha & Woodroffe, 2010; Boruff et al., 2005; Ozyurt & Ergin, 2010; Pendletonet al., 2010).<strong>Climate</strong> <strong>and</strong> Non-<strong>Climate</strong> Drivers<strong>Coastal</strong> change is driven by a number of important factors (Table 2-3) that affect thel<strong>and</strong>scape as well as biological systems such as wetl<strong>and</strong>s <strong>and</strong> coral reefs. The climatedrivers will have a non-uniform spatial <strong>and</strong> temporal influence across the U.S. <strong>and</strong> itsterritories. For example, the location of future ice-sheet melting (e.g., Greenl<strong>and</strong> vs. Antarctica)will affect the gravitational distribution of water in the oceans, such that someareas far from the meltwater source will experience greater sea-level rise (Bamber et al.,2009; Mitrovica et al., 2009; Riva et al., 2010). Regional variations in ocean warming <strong>and</strong>circulation may also enhance or reduce the amount of sea-level rise along the coast (Huet al., 2008; Yin et al., 2009). Other climate drivers such as CO2concentration may change
38 <strong>Coastal</strong> <strong>Impacts</strong>, <strong>Adaptation</strong>, <strong>and</strong> <strong>Vulnerabilities</strong>the rate at which coastal wetl<strong>and</strong>s <strong>and</strong> coral reefs can accrete (Hoegh-Guldberg et al.,2007; Langley et al., 2009).Non-climate drivers (Table 2-3) will have largely regional effects. For example, damconstruction in the Mississippi River basin has reduced sediment loads such that theMississippi delta may experience significant future l<strong>and</strong> loss (Blum & Roberts, 2009).Near-instantaneous events such as earthquakes can result in a meter or more of verticall<strong>and</strong> movement <strong>and</strong> associated shoreline displacement (Peterson et al., 2000).Table 2-3: <strong>Climate</strong> <strong>and</strong> non-climate drivers of coastal change<strong>Climate</strong> DriversSea level change• Waves <strong>and</strong> Currents• Winds• Storminess (frequency, intensity,track)Atmospheric CO 2ConcentrationAtmospheric TemperatureWater Properties (temperature, pH,turbidity, salinity)Sediment SupplyGroundwater AvailabilityNon-<strong>Climate</strong> DriversTidesVertical L<strong>and</strong> Movement (tectonic, glacialisostatic, sediment compaction, fluidwithdrawal)Coseismic Uplift or SubsidenceTsunamiHuman Development <strong>and</strong> ManagementActionsAssessment ResultsMost current global <strong>and</strong> U.S.-based coastal vulnerability assessments have focused onsea-level rise (Nicholls et al., 2007). Initial assessments of the relative vulnerability of U.S.coastal environments to future sea-level rise (Gornitz, 1990; Thieler & Hammar-Klose,1999, 2000a, b) were based on index values determined from coastal characteristics <strong>and</strong>did not explicitly incorporate future sea-level change or other climate <strong>and</strong> non-climatedrivers. More recently, as large <strong>and</strong> consistent datasets have become available, assessmentshave focused on coastal elevations relative to potential future sea-level rise (Weisset al., 2011; Figure 2-12). Knowles (2010) used both elevation data <strong>and</strong> a model of hydrodynamicforcing to assess potential future inundation in the San Francisco Bay region;however, a number of limitations of the simple-inundation approach should be noted,including lack of vertical accuracy in coastal elevation data <strong>and</strong> inability to distinguishlocations where inundation will not be the principal response to sea-level rise (Gesch,2009; Gesch et al., 2009; Knowles, 2010; Weiss et al., 2010).Vulnerability assessments of coastal environments such as cliffed coasts are not currentlywidespread, but the data <strong>and</strong> modeling frameworks exist to develop future assessments(Ashton et al., 2011; Hampton & Griggs, 2004; Hapke & Plant, 2010). Recent work(Gutierrez et al., 2011; Figures 2-8 <strong>and</strong> 2-9) has sought to present coastal vulnerabilityassessment in a probabilistic fashion. This approach takes advantage of the uncertainty
Physical <strong>Climate</strong> Forces 39in input data <strong>and</strong> outcomes <strong>and</strong> uses descriptive terminology that is familiar to coastalmanagers. Such an approach could also be extended to include multiple stressors.Vulnerability assessment for climate change decision making is an emerging discipline(USGCRP, 2011). To improve these assessments in the coastal zone, multiple factorsneed to be incorporated so that potential outcomes can be examined in a holisticframework (Nicholls et al., 2008). The vulnerability of a specific location, ecosystem, orcommunity to climate change impacts is determined by a mix of environmental, social,economic, <strong>and</strong> other non-climate factors that influence its overall exposure <strong>and</strong> adaptivecapacity (NSTC, 2005; Marra et al., 2007); however, current vulnerability assessmentstypically fail to meet this goal (Harvey & Woodroffe, 2008). For the most part,they focus on only one exposure element such as elevation or rate of shoreline change.Sensitivity <strong>and</strong> adaptive capacity are often explored in similarly isolated ways (Hinkel,Figure 2-8. <strong>Coastal</strong> elevation analysis for the U.S. Pacific coast, showing areas within 1-6 metersof NAVD88. Source: Weiss et al., 2011; http://dx.doi.org/10.1007/s10584-011-0024-x, SupplementalFigure 2.
40 <strong>Coastal</strong> <strong>Impacts</strong>, <strong>Adaptation</strong>, <strong>and</strong> <strong>Vulnerabilities</strong>Figure 2-9 Example of a vulnerability assessment for shoreline change due to sea-level rise. Maps ofthe U.S. Atlantic coast show (a) the posterior probability of shoreline change
Physical <strong>Climate</strong> Forces 41Intensification of the Hydrologic CycleOne of the primary drivers for ongoing <strong>and</strong> expected future changes in precipitationpatterns is a warming-induced intensification of the hydrologic cycle (Held & Soden,2006; Trenberth, 1999). Intensification of the hydrologic cycle is a consequence warmerair holding more moisture following the Clausius-Clapeyron relation (see Figure 2-10<strong>and</strong> Box 2-1). Evidence has been reported for an ongoing intensification of the hydrologiccycle based on the observational record on a global basis (Giorgi et al., 2011; Huntington,2006, 2010; Rawlins et al., 2010; Syed et al., 2010; Wentz et al., 2007). Intensificationof the hydrologic cycle heightens the likelihood that the rates of evapotranspiration <strong>and</strong>precipitation will both increase on a global scale; however, wet areas are likely to getwetter <strong>and</strong> drier areas may get drier (Trenberth, 2011).One concern relating to climate change impacts is the resiliency of a system underchanges in weather forcings. Two types of climate change forcings are of importancein examining the resiliency of a system. The first is examining the ability of the systemto endure or adapt given long term gradual trends. As the more likely precipitationreturn period events slowly change, study is required to determine whether the hydrologic/ecologic/anthropogenicsystem is able to cope <strong>and</strong> maintain its identity or whetheropportunistic actors external to the system are able to invade <strong>and</strong> change the system.The second climate change effect lies in the ability of the system to cope with extremeFigure 2-10 Linear trends in annualtotal precipitation amount over the20th century at 643 stations acrossthe USA, where the trend magnitude<strong>and</strong> significance is computed using(a) Kendall’s tau statistic <strong>and</strong> (b)bootstrapping of the OLSR residuals.The changes are expressed as achange in percent per decade. In eachframe, the diameter of the symbolscales linearly with the magnitudeof the trend. If the symbol is a filledblue dot, the trend is positive; if it isa red circle, the trend is negative; agrey cross is shown, if the trend isnot statistically significant at the 90thconfidence level. Source: Pryor et al.,2009.
42 <strong>Coastal</strong> <strong>Impacts</strong>, <strong>Adaptation</strong>, <strong>and</strong> <strong>Vulnerabilities</strong>Box 2-1The Clausius-Clapeyron RelationThe Clausius-Clapeyron relation is a basic physicallaw that characterizes the transition between twogiven phases of matter, which, in this context, isthe transition between water vapor <strong>and</strong> liquidwater. As a consequence of this relation, the waterholdingcapacity of Earth’s atmosphere increasesby about 7 percent° C -1 increase in air temperature(Held & Soden, 2000). In other words, warmer airholds more water; thus, more moisture is availableto supply heavier <strong>and</strong> longer-lasting precipitationevents (Kundzewicz et al., 2007). However, theactual sensitivity of the relation, or how the “realworld” will respond to warming, is uncertainbecause of energy limitations (Allen & Ingram,2001). In addition to the obvious implications forincreasing storm intensity two other importantconsequences should be noted: (1) amplificationof warming through the water vapor feedback,<strong>and</strong> (2) increases in heat stress due to increases inspecific humidity.events. Extreme events can precipitate sudden <strong>and</strong> significant change in fundamentalphysical processes that promulgate throughout the system. Groundwater impactsto drought are an example of this effect studied by Peterson <strong>and</strong> colleagues (2009)who found that a significant enough drought period could fundamentally changea stable groundwater level enough such that plant communities dependent uponthe groundwater would not be able to adapt or survive. These two modes of climatechange impacts bear significance on all aspects of the anthropogenic <strong>and</strong> ecologicuses of water.Changes in Precipitation AmountThe use of different metrics to describe “extreme” precipitation <strong>and</strong> analyses overdifferent time periods <strong>and</strong> different criteria for including or excluding individualstation data complicates an assessment of regional trends <strong>and</strong> comparisons amongstudies. Pryor et al. (2009) analyzed the spatial coherence of changes in annual <strong>and</strong>extreme precipitation patterns across the U.S. over the 20th century. The results showthat changes in precipitation patterns vary both at the regional scale <strong>and</strong> the statescale. General trends shown from the analysis are that annual total precipitation,number of precipitation days, <strong>and</strong> extreme event precipitation amounts are increasingin the coastal areas of the Great Lakes, the Texas/Louisiana coast, <strong>and</strong>, to a lesserextent, in northern California/Oregon/Washington <strong>and</strong> in the New Engl<strong>and</strong> states.The southeast region generally had relatively stable precipitation statistics. Douglas<strong>and</strong> Fairbank (2011) analyzed trend in extreme precipitation in New Engl<strong>and</strong> <strong>and</strong>found evidence for a trend towards increasing maximum annual precipitation ina 24-hour period from 1970 to 2008 at some stations, especially in coastal areas ofsouthern New Engl<strong>and</strong>. Douglas <strong>and</strong> Fairbank compared the 100-year precipitation
Physical <strong>Climate</strong> Forces 43depth quantiles for the 1954-2005 record with NOAA’s Technical Paper No. 40 (NOAA,1961) 100-year, 24-hour precipitation values. Estimates for stations along coastal Massachusetts,New Hampshire, <strong>and</strong> Maine all exceeded 7 inches <strong>and</strong> exceeded TP-40 by 1inch or more. These findings indicate that TP-40 under represents coastal-storm depths.Observed long-term trends in annual precipitation amounts in coastal areas of theU.S. are quite variable. Generally, between 1958 <strong>and</strong> 2007, increases were observed inCalifornia, the northeastern states, the Great Lakes, the Gulf Coast of Texas, <strong>and</strong> Louisiana,<strong>and</strong> decreases were observed in the Pacific Northwest <strong>and</strong> in the southeasternU.S. (GCCI, 2009). Hodgkins <strong>and</strong> Dudley (2007) reported increases in precipitation <strong>and</strong>runoff in the Great Lakes Basin during 1915 to 2004. In 1958-2007, the largest increasesin heavy precipitation occurred in the northeastern states <strong>and</strong> surrounding the GreatLakes (GCCI, 2009). Significant increases in heavy daily precipitation above the 99.7 thpercentile during 1908 to 2000 on an annual basis occurred in the Great Lakes region <strong>and</strong>the Gulf of Mexico coastal regions throughout Texas to Louisiana <strong>and</strong> in the winter inthe northeastern states (Groisman et al., 2004). Increases in extreme rainfall in the GreatLakes regions also were reported by Kling et al. (2003) for the period of 1931 to 1996.Changes in precipitation amount annually <strong>and</strong> seasonally will influence stream <strong>and</strong>river runoff as well as the potential for flooding <strong>and</strong> drought. Changes in the volume,timing, <strong>and</strong> quality of available water may increase the vulnerability of water supplies<strong>and</strong> water quality (Aggarwal & Singh, 2010; Buonaiuto et al., 2010; Delpla et al., 2009;Park et al., 2010; Whitehead et al., 2009). Increasing runoff can reduce salinity in estuaries<strong>and</strong> the near-coastal ocean, which, when coupled with warmer surface water,increases the difference in density between surface <strong>and</strong> bottom waters, thus preventingthe replacement of oxygen in the deeper waters (GCCI, 2009).Extreme precipitation events can have many impacts on the integrity of coastal wetl<strong>and</strong>systems, including direct effects on vegetation that have indirect effects on wetl<strong>and</strong>geomorphology by affecting stability of soils <strong>and</strong> the erosion, transport, <strong>and</strong> depositionof sediments (Cahoon, 2006). Extreme precipitation can cause local rivers to jump theirchannels <strong>and</strong> carve new channels through the upl<strong>and</strong>, mobilizing millions of tons ofsediment that are deposited in downstream wetl<strong>and</strong>s, which occurred in the TijuanaRiver during the 1993 El Niño storm in southern California (Cahoon et al., 1996).Late 21st century projections of precipitation changes for the winter <strong>and</strong> summerseasons from the CMIP3 models are shown in the IPCC AR4 (see Fig. 10.9 <strong>and</strong> TS.30 ofthe Working Group I report). Those results suggest that making confident projections ofregional precipitation changes over the U.S. is difficult. The most robust global changesinclude a tendency for increased precipitation in high latitudes <strong>and</strong> decreased precipitationin many parts of the subtropical dry zones around the globe. On the other h<strong>and</strong>, thecontinental U.S. tends to lie between these two broad zones, leading to lower confidencein precipitation projections than for some other regions around the globe. The highestlevel of model agreement for the U.S. is the projection of an increase in precipitationin the Alaska region. Washington <strong>and</strong> Oregon lie in a relatively small region of highinter-model agreement on reduced summertime precipitation. Most of the CMIP3 modelsproject increased winter precipitation along the Northeast coastal regions of the U.S.In a recent study of the Great Lakes region, climate model projections indicatedincreases in winter <strong>and</strong> spring precipitation of up to 20 percent under lower <strong>and</strong> 30
44 <strong>Coastal</strong> <strong>Impacts</strong>, <strong>Adaptation</strong>, <strong>and</strong> <strong>Vulnerabilities</strong>percent under higher emissions scenarios by the end of the 21st century, while projectionsfor summer <strong>and</strong> fall were inconsistent. Competing effects of shifting precipitation<strong>and</strong> warmer temperatures suggested little change in Great Lake levels over much of thecentury until the end of the century, when net decreases were projected under higheremissions (Hayhoe et al., 2010).Increasing Variability in PrecipitationAn increase in the spatial <strong>and</strong> temporal variability <strong>and</strong> the amount of precipitation willresult in major challenges for water resource managers. Most water resource managementinfrastructure <strong>and</strong> planning is based on assumptions of stationarity <strong>and</strong> the conceptthat historical variability in precipitation can be used to predict future variabilityin the design <strong>and</strong> management of water systems (Milly et al., 2008). If climate changeis accompanied by substantial changes in the variability of precipitation as is projected(Bates et al., 2008; Gutowski et al., 2008), water resource availability will be affected unlessresource managers develop adaption plans that can accommodate such changes.The historical record suggests that variability is increasing (Madsen & Figdor, 2007;Medvigy & Beaulieu, 2012; Tebaldi et al., 2006). Pryor et al. (2009) analyzed eight metricsof precipitation in century-long records throughout the contiguous U.S. <strong>and</strong> foundthat statistically significant trends generally indicated increases in the intensity of eventsabove the 95 th percentile. Medvigy <strong>and</strong> Beaulieu (2012) reported changes between 1997<strong>and</strong> 2007 in variability in daily precipitation amount for some U.S. regions. Increasesin variability were reported for coastal New Engl<strong>and</strong>, Washington state, Hawaii, <strong>and</strong>most of coastal Alaska, <strong>and</strong> decreases were reported for parts of southeastern <strong>and</strong> southwesterncontinental U.S. Studies indicate medium high confidence in the range of 67 to90 percent probability that variability in the amount, intensity, <strong>and</strong> spatial distributionof precipitation, especially in extreme weather events will increase in the 21st century(Bates et al., 2008; Gutowski et al., 2008).Changes in Ratio of Snow to Total PrecipitationStudies show that the ratio of snow to total precipitation has decreased in the northeasternU.S. (Huntington et al., 2004), northwestern U.S. (Knowles et al., 2006), <strong>and</strong> in theAlaskan Arctic region (Screen & Simmonds, 2011). These changes have implications forthe timing <strong>and</strong> volume of spring runoff during the snowmelt period.Changes in Precipitation in <strong>Coastal</strong> AlaskaSparse historical records for total precipitation indicate that trends in Alaska vary byregion <strong>and</strong> time period but do not show major trends in total annual amounts as havebeen reported over many areas of the contiguous U.S. (GCCI, 2009; Kunkel et al., 2008;Muskett & Romanovsky, 2011). Arctic regions have experienced decreases in snowfallamounts in recent decades (Derksen & Brown, 2011) <strong>and</strong> decreases in the fraction oftotal precipitation occurring as snow (Screen & Simmonds, 2011). Mixed results havebeen reported for changes in frequency of heavy precipitation events in Alaska; however,more increasing trends have appeared since 1980, especially in southern Alaska(Stewart, 2011). <strong>Climate</strong> projections for Alaska indicate high confidence in increasing
Physical <strong>Climate</strong> Forces 45precipitation <strong>and</strong> increasing frequency of heavy precipitation (IPCC AR4 WGII, 2007;IPCC, 2011). Changes in precipitation regime could influence permafrost temperature,which has generally been increasing in Alaska (Derksen & Brown, 2011; Osterkamp,2007; Smith et al., 2010), thus affecting soil water content (Muskett & Romanovsky, 2011)<strong>and</strong> presumably the stability of permafrost in coastal regions (Buonaiuto et al., 2010).Changes in Storm TracksAccording to the recently released summary of the IPCC report on extreme events(IPCC, 2011: pg. 5), “It is likely that there has been a poleward shift in the main Northern<strong>and</strong> Southern Hemisphere extra-tropical storm tracks.” As a result, some regions will experienceincreased or decreased storm frequency due to the poleward shift of the tracks.According to a recent assessment report on tropical cyclones <strong>and</strong> climate change (Knutsonet al., 2010: pg. 2), there is “low confidence in projected changes in tropical cyclonegenesis location, tracks, duration, <strong>and</strong> areas of impact.” Existing model projections donot show dramatic large-scale changes in these features.DroughtsAn increase in the proportion of l<strong>and</strong> area in drought since the 1970s is reported byBurke et al. (2006). Dai et al. (2004) reported increases in the area in both drought <strong>and</strong>wet areas in the conterminous U.S. Trends are highly variable among regions <strong>and</strong> areattributed to both ENSO-induced decreases in precipitation <strong>and</strong> to warming-induced increasesin evaporation. The changes are consistent with increasing risk of more frequent<strong>and</strong> more intense drought over some regions (Dai et al., 2004). During 1967 to 2006, themean duration of prolonged dry episodes, 1 month or longer in the eastern U.S. <strong>and</strong>2 months or longer in the southwestern U.S., has significantly increased (Groisman &Knight, 2008). Increasing drought in some coastal areas could lead to water shortages<strong>and</strong> soil moisture deficits, called agricultural drought, leading to reduced crop yield,greater risk of wildfire, <strong>and</strong> greater susceptibility to some pests (Hatfield et al., 2008).In some regions drought will likely be compounded by higher rates of evapotranspiration,which could result in increased groundwater withdrawals because of higher waterdem<strong>and</strong>s (Hatfield et al., 2008). Cumulatively, these climatic changes, sea-level rise, <strong>and</strong>human adaptations could result in depletion of coastal aquifers <strong>and</strong> saltwater intrusion(Conrads et al., 2010).Heavy Rainfall <strong>and</strong> Floods<strong>Climate</strong> change has the potential to substantially affect risk of flooding <strong>and</strong> associatedimpacts to human health, infrastructure, <strong>and</strong> agriculture. <strong>Coastal</strong> U.S. cities have farlower populations at risk than cities in Southeast Asia, but New York <strong>and</strong> Miami rankhighly in assets exposed to risks from storm <strong>and</strong> flood damage (Hanson et al., 2011).Floods can cause population- <strong>and</strong> community-level changes in ecosystems superimposedon a background of more gradual trends (Thibault & Brown, 2008). Saltmarshes,mangroves, <strong>and</strong> coral reefs are expected to be particularly vulnerable to impacts of extremeevents associated with major coastal storms (Bertness & Ewanchuk, 2002; Fischlinet al., 2007; Hughes et al., 2003). Heavier rainfall, combined with sea-level rise <strong>and</strong> storm
46 <strong>Coastal</strong> <strong>Impacts</strong>, <strong>Adaptation</strong>, <strong>and</strong> <strong>Vulnerabilities</strong>surge, is expected to substantially increase the frequency of flooding in major metropolitanareas in the U.S. northeast in the 21st century (Kirschen et al., 2008) <strong>and</strong> in California(Moser & Tribbia, 2006).Flooding <strong>and</strong> erosion are significant problems for many Native American villages inAlaska from the combined effects of sea-level rise, loss of protective sea ice (ACIA, 2005;Polyak et al., 2009), major storms, heavy inl<strong>and</strong> rainfall that causes rivers to flood downstream,<strong>and</strong> accelerated melting of snow <strong>and</strong> ice (GAO, 2003, 2009).2.7 Temperature Change <strong>Impacts</strong> with a Focus on AlaskaTemperature TrendsIn Alaska, temperature increases melt permafrost <strong>and</strong> sea ice, which will exacerbate acceleratingcoastal erosion rates, especially on the North <strong>and</strong> West Coast.Temperature increases affect coasts due to sea-level rise associated with ocean thermalexpansion <strong>and</strong> terrestrial ice melt (see section 2.2). In addition to multi-year trends,water temperature variations occur seasonally. Changes can be small <strong>and</strong> difficult todetect (Willis et al., 2008), but they do contribute to overall coastal water level <strong>and</strong>, whencombined with other factors, could contribute to increased water levels. Biological activity(section 3.1) in coastal regions is likely to be adversely affected by temperatureincreases (Vaquer-Sunyer & Duarte, 2011). When combined with other stressors, coastalmarine productivity could become increasingly threatened.Much of the ocean off of the U.S. West Coast is an upwelling zone. The eastern PacificOcean circulation is manifested in this region as the southward-flowing Californiacurrent. The southward movement of an ocean current along a western coastal marginresults in surface waters moving away from the coast, which draws cool water up fromdeeper waters. Altering the strength of the ocean circulation will alter the upwellingregime; this linkage to atmospheric circulation represents the primary mechanism foraltering West Coast ocean temperature. Currently, the response of this circulation regimeto projected climate forcing is not well known. For most West Coast areas, datasuggest no change or a decrease in sea surface temperatures, measured by season. Onlyin southern California are increasing trends observed, <strong>and</strong> only during the strongestseason, autumn, <strong>and</strong> the weaker season, winter (Pardo et al., 2011); however, decreasingcoastal ocean temperatures could result in decreased regional precipitation by reducingevaporation <strong>and</strong>, in the same manner as a temperature increase, could act to stress themarine biota. At the same time, a cooler ocean surface could act to reduce the intensity ofcoastal storms. Finally, cooler waters could also lead to an increase in the occurrence offog, which impacts the transportation sector.The nearshore waters of the U.S. Atlantic <strong>and</strong> Gulf of Mexico coasts are much warmerwaters than the waters of the U.S. West Coast. Like the West Coast, ocean temperaturesalong the U.S. East Coast are largely a function of ocean circulation patterns, in this case,the Gulf Stream. In the Atlantic, a primary response to a change in ocean temperaturesis a change in hurricane formation <strong>and</strong> trajectory. Warmer waters favor hurricane formation,longevity, <strong>and</strong> power, but recent work suggests that atmospheric responses towarm waters of the “Atlantic Warm Pool,” which include the Gulf of Mexico, Caribbean
Physical <strong>Climate</strong> Forces 47Sea <strong>and</strong> western tropical North Atlantic, can act to steer hurricanes farther to the east,away from l<strong>and</strong> (Wang et al., 2011). Increased temperatures in the Atlantic Warm Pool,although possibly causing a reduction in U.S. l<strong>and</strong>falling hurricane activity, could increasethe potential strength <strong>and</strong> precipitation amounts from winter/spring “bombs,”which are powerful storms that move up the Eastern Seaboard, <strong>and</strong> could result instronger lines of late winter/spring lines of tornado-bearing storms. One un-publishedinvestigation does suggest an increase in early-season tornados (Burnett et al., 2008).Other work suggests a potential increase in atmospheric convective conditions that favorsevere storm outbreak under “business as usual” future climates (van Klooster &Roebber, 2009), a response that would depend in large part on warming coastal waters.Rise in temperature can benefit some organisms. For example, mangrove forests,important to coastal fisheries <strong>and</strong> providing coastline stabilization <strong>and</strong> inundation reductionfunctions, generally thrive with higher temperatures <strong>and</strong> can respond to sealevelrise by migrating inl<strong>and</strong>. However, this comes at the expense of inl<strong>and</strong> freshwatermarshes such as those found in Florida. Furthermore, where human responses includesea walls to limit marine encroachment, mangroves, deprived of a region to retreat into,will be squeezed out.Figure 2-11 Damagedinfrastructure in an Alaskancoastal community. Thisrepresents the juxtapositionof problems caused byincreasing temperatures:permafrost melt destabilizingthe ground combined withincreased water temperaturethat reduces protective icecover <strong>and</strong> allows waves tomelt the base of permafrostbluffs <strong>and</strong> increase coastalerosion. Photo by NedRozell, Geophysical Institute/University of Alaska Fairbanks.Northern <strong>Coastal</strong> ResponseArguably, the most immediate impacts arising from temperature change are being feltalong the coastlines of Alaska. Alaska coasts represent important locations along whichisolated communities, sensitive habitats, <strong>and</strong> industrial operations are situated. Varioustypes of coastline are found here: the rocky coasts with pocket beaches of the panh<strong>and</strong>le,
48 <strong>Coastal</strong> <strong>Impacts</strong>, <strong>Adaptation</strong>, <strong>and</strong> <strong>Vulnerabilities</strong>South Coast, <strong>and</strong> Aleutians; eroding bluffs along the West <strong>and</strong> North Coasts; wide, flatdeltas in many areas; <strong>and</strong> barrier isl<strong>and</strong> chains. A key distinction of the Alaska coasts isthe presence of ice, both in the ground as permafrost <strong>and</strong> on the ocean as sea ice. This isunique among U.S. coastal systems.Accordingly, the primary driver of environmental change in Alaska is temperature.Ice makes northern regions particularly susceptible to temperature change; for example,an increase of two degrees Celsius could take a system from frozen to unfrozen withextensive implications. This is not the case for coastal regimes anywhere else in the U.S.<strong>and</strong> represents a major additional stressor in addition to sea-level rise, waves, <strong>and</strong> stormsurge.Earlier work (Serreze et al., 2000; Polyakov et al., 2003) established a 20th centurytemperature increase in the Alaska region, <strong>and</strong> recent work by various authors (Lopezde-Lacalle,2011; Shulski, 2010; Wendler & Shulski, 2009; Wendler et al., 2010) has reinforcedthese findings. The second U.S. National Assessment (Karl et al., 2009) concludedthat the Alaska region has warmed at twice the rate of the lower 48; over the last 50years, mean annual air temperature in Alaska has increased by 3.4°C. Winter <strong>and</strong> Springhave experienced the largest increases in air temperature: approximately 6.3°C in thelast 50 years, which is almost twice the rate of the average annual increase.Increasing temperature affects ice-dominated systems in Alaska, including glaciers,sea ice, snow cover, <strong>and</strong> permafrost. Arendt et al. (2009) considered regional impacts onAlaska glaciers; most are losing mass due largely to summer temperature increase that ismore apparent at higher elevations. In other words, the freezing line is higher up on themountains, which causes greater melt at lower elevations.Another important measure of change for Alaska is ground temperature <strong>and</strong> snowcover. When frozen, permafrost is stable <strong>and</strong> strong. When thawed, it can have the consistencyof thick soup <strong>and</strong> retains virtually no strength; it can also cause a lowering ofthe l<strong>and</strong> surface. Weakened coastal sediments are much more susceptible to erosion,<strong>and</strong> a lower l<strong>and</strong> surface is more susceptible to inundation by storm surge. Changes insnow cover can affect ground temperatures <strong>and</strong> sea-ice formation. One implication ofweakened permafrost surfaces <strong>and</strong> changes to snow cover are impacts on tundra travel.Atkinson (2005) indicated a general increase in circum-Arctic coastal-storm activitygenerated largely due to a major atmospheric circulation shift that occurred in the mid-1970s. A reduced sea-ice cover will result in increased potential for storm damage dueto surge <strong>and</strong> erosion, which is further detailed below. Storms also exert an impact ontemperature via advection; that is, their strong winds can move warm or cold air overa region. A particularly strong coastal storm in 2000 caused widespread decreases inground temperatures in the North Slope region (Atkinson & Hinzman, 2008).<strong>Coastal</strong> impacts, including erosion <strong>and</strong> damage to infrastructure, are strongly dependentupon coastal sea ice, which can both amplify or mitigate damage depending onthe processes at work. Ice driven onshore by winds or currents can bulldoze shore sedimentsor damage structures (Christensen, 1994). Shore-fast ice frozen onto structurescan cause considerable damage during surges or break-out events (Atkinson et al., 2011).Also, by entraining sea-floor sediments, sea ice is a highly effective erosion <strong>and</strong> transportagent (Are et al., 2008). Recent reductions in Arctic sea-ice extent <strong>and</strong> thickness mayresult in substantial increases in the amount of material removed from the coastal zone
Physical <strong>Climate</strong> Forces 49by sea ice (Eicken et al., 2005). Such ice-mediated export of nearshore sediments alsoplays a role in enhancing the impacts of wave action that drives erosion <strong>and</strong> thawing ofcoastal permafrost, amplified by recent changes in the length of the open water season(Overeem et al., 2011). At the same time, formation of nearshore ice well in advance ofthe appearance of the ice pack can provide protection to the coastline through the formationof ice berms in the surf zone (Atkinson, 2011). The complicated interplay betweenthese different factors that serve to amplify or dampen the effects of climate change onice action in the nearshore zone is at present not well understood. For the entire Arcticregion, sea-ice area <strong>and</strong> thickness are decreasing, with summer ice-extent reductions onthe order of 12 percent per decade for the past three decades (Stroeve et al., 2011). Atpresent, projections from climate models suggest that the Arctic Ocean may be ice-freeduring summer by about 2040 (Wang & Overl<strong>and</strong>, 2009). However, even a substantiallyreduced summer ice cover will have major implications for all the processes discussedabove.An important feature of northern ecosystems is their capacity to store large quantitiesof methane <strong>and</strong> carbon dioxide in the frozen ground of the tundra, boreal forest,<strong>and</strong> near-coastal regions. Methane emission in the Arctic is dependent, in part, on thechanges in area of wetl<strong>and</strong> <strong>and</strong> lakes in the North Slope of Alaska during the snow-freeseason. Ground thaw due to climate warming will increase the formation of thaw-inducedwetl<strong>and</strong>s, enhancing release of greenhouse gases, which will exacerbate existingglobal warming trends. Current Arctic contributions to global methane emissions aresmall, however recent increasing trends have been noted (Bloom et al., 2010). Methaneemission had been thought to be a warm-season phenomenon in the Arctic because atmosphericmethane is unusually oxidized in the soil during winter season; however, recentfield measurements indicate that tussock tundra, which covers more than 6 millionsquare kilometres of the Northern Hemisphere, is an unexpected winter methane sourcein tundra <strong>and</strong> boreal forest ecozones (Kim et al., 2007). This indicates winter methaneemission should not be overlooked in estimation of regional or global methane budgets.Finally, large reserves of methane are found in nearshore permafrost (Shakhova et al.,2008), which is susceptible to disturbance if coastal temperatures warm; Siberian fielddata suggests strong methane release in the near-coastal marine region (Shakhova <strong>and</strong>Semiletov, 2007).Impact of <strong>Climate</strong> Change on <strong>Coastal</strong> Processes<strong>Coastal</strong> processes <strong>and</strong> erosion in Arctic settings differ from coastal processes in sub-arcticsettings in that both thermal <strong>and</strong> mechanical processes are important. In the Arctic,coastal sediments are normally locked in place by ice, <strong>and</strong> thawing of the ice is necessarybefore mechanical processes such as waves, currents, <strong>and</strong> wind can transport the sediments.As well, shore fast, bottom fast, <strong>and</strong> sea ice often protect the coastal zone fromwave action. For example, coastal villages on the Chukchi Sea such as Shishmarev <strong>and</strong>Kivalina were historically protected from the brunt of large late-fall storms due to thepresence of nearshore <strong>and</strong> sea ice, but these villages have been subject in the last decadeto the full brunt of these storm waves <strong>and</strong> surge flooding due to diminished sea-ice coveragein the late fall.Two process sequences are responsible for much of the coastal erosion in Arctic
50 <strong>Coastal</strong> <strong>Impacts</strong>, <strong>Adaptation</strong>, <strong>and</strong> <strong>Vulnerabilities</strong>Alaska: (1) niche erosion followed by block collapse <strong>and</strong> (2) thaw slumping. The term“niche erosion” refers to the cutting of a niche at the base of the coastal bluff. Niche erosion/blockcollapse is a four-process sequence (Figure 2-12).Figure 2-12 Conceptual model of the processesresponsible for niche-erosion/block-collapse inArctic Alaska. Source: Ravens et al., 2012.Storms raise water levels <strong>and</strong> allow the sea to directly contact the base of the bluff.Waves <strong>and</strong> currents thermally <strong>and</strong> mechanically erode a niche at the base of the bluff.The niche grows until the overburden exceeds the bluff strength <strong>and</strong> block collapse results.The fallen block is then eroded thermally <strong>and</strong> mechanically by waves <strong>and</strong> currents.Niche erosion/block collapse is the dominant erosion mechanism in locationsdominated by coastal bluffs. Beach survey measurements (Jones et al., 2009a, b; Mars &Houseknecht, 2007) <strong>and</strong> modeling (Ravens et al., 2012) have documented the rapid <strong>and</strong>accelerating coastal retreat in locations where this erosion sequence is dominant. Ravenset al. (2012) indicate that the main driver in the acceleration of erosion is increasingnearshore water temperature, which weakens the permafrost sediments. Recent observationshave shown significant erosion even in the absence of storms.Thaw slumping is predominant in coastal bluffs with significant coarse material. Theterm “thaw slumping” refers to the slumping or sloughing of the bluff face followingthaw due to radiation or convective heating. Bluff thaw slumping is the predominanterosion mechanism in locations with significant coarse material such as Barter Isl<strong>and</strong> inthe Beaufort Sea. Bluff erosion in these areas leaves a significant lag deposit that heightensthe beach before the bluff <strong>and</strong> reduces the frequency of niche erosion.Three main aspects of climate change in Arctic Alaska directly affect coastal erosion:1) increased temporal <strong>and</strong> spatial extent of open water <strong>and</strong> reduced sea ice concentrations,2) increased water temperatures, <strong>and</strong> 3) increased air temperatures. The niche erosion/blockcollapse sequence will accelerate due to factors 1, 2, <strong>and</strong> 3. Increased watertemperature, increased wave height due to more open water, <strong>and</strong> increased temporalextent of open water (factors 1 <strong>and</strong> 2) will intensify <strong>and</strong> prolong the niche erosion process.Also, these process changes along with increasing air temperatures (factor 3) willaccelerate the erosion of fallen blocks. Hence, continued increasing erosion rates due to
Physical <strong>Climate</strong> Forces 51niche erosion/block collapse are expected. Thaw slumping will also accelerate due towarming of the atmosphere (factor 3), but this process would not be directly changed byoceanic changes.A final Arctic coastal process that appears to be affected by climate change is themigration of barrier isl<strong>and</strong>s in the Alaska Beaufort Sea in the Arctic Ocean. In the past,these barrier isl<strong>and</strong>s have been observed to migrate westward due to the predominanteastern winds <strong>and</strong> waves. Ravens <strong>and</strong> Lee (2007) provide evidence that the western endof one of these isl<strong>and</strong>s, Narwhal Isl<strong>and</strong>, is migrating at an accelerating rate. Accordingto GIS analysis <strong>and</strong> GPS surveys, between 1955 <strong>and</strong> 1990, the western end of the isl<strong>and</strong>moved at about 5 meters/year. However, in the last two decades between 1990 <strong>and</strong> 2007,it has moved at 25 meters/year on average.The recently published IPCC Special Report on Managing the Risks of ExtremeEvents <strong>and</strong> Disasters to Advance <strong>Climate</strong> Change <strong>Adaptation</strong> “Report for Policy Makers”(IPCC, 2012) indicates that temperature increases <strong>and</strong> increased variability, includinggreater potential for extremes, will continue to be strong for coastal regions. ThisIPCC result is based on an average of results from a series of climate projection modelsoperated by different research groups <strong>and</strong> represents the benchmark for assessing whatis likely to occur with continued climate warming.
Chapter 3Vulnerability <strong>and</strong> <strong>Impacts</strong> on NaturalResourcesKey FindingsffffffffffffffffffffMultiple stressors interact at the coast, which directly impacts natural resources.The responses of natural coastal systems to climate change are complex <strong>and</strong>subject to nonlinear changes <strong>and</strong> tipping points. Many of these responsesare heavily influenced by the way they are linked with human systems. HighConfidence.Wetl<strong>and</strong> ecosystems are vulnerable to relative rise in water levels <strong>and</strong> projectedincreases in storm activity in zones of significant human use. High Confidence.Mangrove range will exp<strong>and</strong> as minimum temperatures increase. HighConfidence.<strong>Coastal</strong> forests will tend to migrate upslope <strong>and</strong> poleward where they are able tokeep pace with changing habitat conditions. High Confidence.The structure <strong>and</strong> functioning of estuary <strong>and</strong> coastal lagoon systems will changewith alterations in habitat suitability <strong>and</strong> the timing of long-st<strong>and</strong>ing processes.High Confidence.Dynamic barrier isl<strong>and</strong> l<strong>and</strong>scapes naturally migrate in response to stormactivity <strong>and</strong> sea-level rise. This process will be confounded by human alterations.High Confidence.Because of altered sediment supplies <strong>and</strong> local subsidence, deltas, <strong>and</strong> thebiodiversity they support, are at risk to drowning during rising sea levels. HighConfidence.Mudflats are susceptible to threshold changes caused by the combined effectsof sea-level rise, temperature, l<strong>and</strong> use, altered flows, <strong>and</strong> increased nutrientrunoff. High Confidence.Complex interactions between physical <strong>and</strong> biological factors, which makeresponses to climate change difficult to predict, have been demonstrated inrocky shore communities. High Confidence.Sea ice ecosystems are already being adversely affected by the loss of summersea ice. Further changes are expected. High Confidence.52
Vulnerability <strong>and</strong> <strong>Impacts</strong> on Natural Resources 533.1 Multiple Stressors Interact at the Coast<strong>Climate</strong> change-mediated impacts originating from terrestrial <strong>and</strong> marine sources interactat the coast to influence coastal habitats (Nicholls et al., 2007; Rosenzweig et al.,2007; Figure 3-1; Table 3-1). On the l<strong>and</strong>ward side, increased temperatures <strong>and</strong> alteredprecipitation patterns interact with changing l<strong>and</strong>-use <strong>and</strong> l<strong>and</strong>-cover practices to affectsoil moisture, ground water levels, hydrology, sediment supply, salinity, <strong>and</strong> pollutionin watersheds. On the marine side, sea-level rise, changing ocean currents, increasedwave heights, <strong>and</strong> intensification of coastal storms interact with changes in l<strong>and</strong> use <strong>and</strong>l<strong>and</strong> cover to exacerbate coastal erosion, flooding, <strong>and</strong> saltwater intrusion. As a result ofthese interactions, complex changes in coastal freshwater availability <strong>and</strong> water qualityare also occurring.Figure 3-1 Major physical climate forces that affect coastal regions either directly or indirectly throughexternal marine <strong>and</strong> terrestrial influences. Source: Nicholls et al., 2007.<strong>Coastal</strong> Freshwater Availability Threatened by Multi-stressor InteractionsClimatic changes to atmospheric conditions <strong>and</strong> sea-level rise interact to affect theavailability of fresh surface water in coastal regions. Cloern et al. (2011) used a seriesof linked models under two GCM scenarios to infer the impact of climatic changes onwater <strong>and</strong> habitat quality in the California San Francisco Bay-Delta estuary where wateris extracted for human use. Earlier <strong>and</strong> more extreme spring streamflow combined withreduced flows in the low-flow season as well as sea-level rise led to increased Delta salinity(Figure 3-2). These changes have important implications for decisions regardingwater releases, which will need to balance drinking <strong>and</strong> irrigation water quality withsupport for native fisheries that rely on specific water temperature <strong>and</strong> salinity ranges<strong>and</strong> flushing regimes.
54 <strong>Coastal</strong> <strong>Impacts</strong>, <strong>Adaptation</strong>, <strong>and</strong> <strong>Vulnerabilities</strong>Table 3-1:Examples of impacts of climate change <strong>and</strong> human exacerbating factors oncoastal ecosystems<strong>Climate</strong> FactorDirect <strong>Impacts</strong>Indirect/Interactive<strong>Impacts</strong>Exacerbating Human-Development <strong>Impacts</strong>Ecosystem ResponsesSea level• Inundation• Erosion• Saltwaterintrusion• Altered patterns offlooding• Upstream salinitychanges• Soil salinity changes• Freshwaterextraction• Sea walls/coastalarmoring• Wetl<strong>and</strong> drowning<strong>and</strong> migration• Reduced viability ofmangroves• Beach <strong>and</strong> mudflatlossExtreme events• Storm surge• Waves• Wind scour• Erosion• Drought• Flooding• Altered flushing<strong>and</strong> residence times• Sea walls/coastalarmoring• Urb<strong>and</strong>evelopment/impervious surfaces• Beach <strong>and</strong> mudflatloss• Habitat destruction• Altered food websPrecipitation• Soil moisture• Hydrologicchanges• Salinity changes• Altered waterresidence times• Increased nutrientloading <strong>and</strong>eutrophication• Reduced streamflows• Urb<strong>and</strong>evelopment/impervious surfaces• Alterednutrient runoffconcentrations• Altered sedimentdelivery• Agriculture/fertilizers <strong>and</strong>pesticides• Changes indistribution of fresh<strong>and</strong> salt water biota• Altered productivityof fisheries species• Increased harmfulalgal bloomsTemperature• Soil moisture• Salinity changes• Permafrostthawing• Reduced streamflows• Altered nutrient <strong>and</strong>toxin concentrations• Eutrophication• Freshwaterextraction• Urb<strong>and</strong>evelopment/heatisl<strong>and</strong>s• Altered metabolism<strong>and</strong> growth rates• Altered plant <strong>and</strong>animal distributions• Local extinctions• Increased harmfulalgal bloomsWave regimes• Shoreline retreat• Erosion• Altered patterns offlooding• Sea walls/coastalarmoring• Beach <strong>and</strong> mudflatloss• Wetl<strong>and</strong> edge loss
Vulnerability <strong>and</strong> <strong>Impacts</strong> on Natural Resources 55Figure 3-2 Trends in climatic forcing (air temperature, precipitation, sea level), subsequent hydrology,<strong>and</strong> water quality response in the San Francisco Estuary. Source: Cloern et al., 2011.Climatic changes that decrease surface water availability <strong>and</strong>/or increase water dem<strong>and</strong>will increase salinity intrusion in coastal aquifers through direct <strong>and</strong> indirect effects.Loáiciga et al. (2011) assessed salinity intrusion scenarios in a modeling study ofthe Seaside Area groundwater aquifer near Monterey, California. They found that theposition of the human-use threshold level of 10,000 mg/L isohaline was more sensitiveto groundwater extraction rates than sea-level rise. This indicates that in some cases, atmosphericfactors including precipitation <strong>and</strong> snow thickness, <strong>and</strong> socio-economic factorssuch as population <strong>and</strong> l<strong>and</strong> use, diminish total water supply <strong>and</strong> increase dem<strong>and</strong>,which may increase salinity intrusion more than sea-level rise.Estuarine Water Quality Compromised by Multiple <strong>Climate</strong> DriversEstuarine water quality, in terms of eutrophication <strong>and</strong> hypoxia, is greatly affected bymulti-stressor interactions. Currently, approximately 250 hypoxic, or low-dissolved oxygen,dead zones exist in U.S. coastal <strong>and</strong> Great Lake waters (Figure 3-3). Hypoxia maybe initiated <strong>and</strong>/or worsened by high rates of primary productivity spurred by increasesin nutrient loading, called eutrophication. After studying a number of watersheds,Howarth et al. (2011) indicated that riverine-discharge increases due to climate change
56 <strong>Coastal</strong> <strong>Impacts</strong>, <strong>Adaptation</strong>, <strong>and</strong> <strong>Vulnerabilities</strong>will increase net anthropogenic nitrogen inputs to coastal waters, thereby increasing eutrophication<strong>and</strong> hypoxia. <strong>Climate</strong> change, especially warming, may also make systemsmore susceptible to development of hypoxia through enhanced water column stratification,decreased solubility of oxygen, <strong>and</strong> increased metabolism <strong>and</strong> mineralizationrates. High-precipitation storms, which are on the increase (see Chapter 2 section 7 thisreport), increase stratification <strong>and</strong> organic matter flushed into estuarine <strong>and</strong> coastal systemsfrom the watershed; algal blooms can result from the nutrient pulses they injectinto estuarine <strong>and</strong> coastal ecosystems (Paerl et al., 2006a) <strong>and</strong> massive hypoxia can betriggered by such events (Justic et al., 2007; Paerl et al., 2006b). For the Mississippi Riverbasin associated with the northern Gulf of Mexico seasonal dead zone, climate predictionssuggest a 20 percent increase in river discharge (Miller & Russell, 1992) that wouldlead to elevated nutrient loading, a 50 percent increase in primary production, <strong>and</strong> expansionof the oxygen-depleted area (Justic et al., 1996). All factors related to climatechange will progressively lead to an onset of hypoxia earlier in the season <strong>and</strong> longerperiods of hypoxia over time (Boesch et al., 2007)Figure 3-3 Overall eutrophic condition of the nation’s estuaries <strong>and</strong> change. Source: Bricker et al.,2007.
Vulnerability <strong>and</strong> <strong>Impacts</strong> on Natural Resources 573.2 Biota, Habitats, <strong>and</strong> <strong>Coastal</strong> L<strong>and</strong>forms that are Impacted byComplex Stressor Interactions <strong>and</strong> Subject to Nonlinear Changes<strong>and</strong> Tipping PointsCoastlines are dynamic systems subject to complex interactions of climate <strong>and</strong> non-climatestressors. When multiple stressors act in combination on an ecosystem, nonlinearinstabilities may be triggered (Burkett et al., 2005; CCSP, 2009a; Nicholls et al., 2007).Such nonlinear responses can be amplified <strong>and</strong> accelerated by synergies <strong>and</strong> positivefeedbacks that increase the alteration of the system <strong>and</strong> cause a domino-like propagationof potentially-irreversible change. Synergies <strong>and</strong> feedbacks occur when the impactof one stressor is either strengthened or weakened by variation in another, <strong>and</strong> the combinedinfluence of multiple stressors can result in nonlinear ecological changes if populationsor ecosystems are pushed beyond a critical threshold or tipping point (Harleyet al., 2006; Lubchenco & Petes, 2010). In some cases, threshold shifts can be caused bygradual climate change if that change is occurring at a rate beyond which the ecosystemcan adapt (McNeall et al., 2011). A threshold is defined as “the point at which there isan abrupt change in an ecosystem quality, property or phenomenon, or where smallchanges in one or more external conditions produce large <strong>and</strong> persistent responses in anecosystem” (CCSP, 2009b: pg. vii).Multi-stressor interactions <strong>and</strong> resulting nonlinear changes in ecosystems, which canmanifest over varying spatial <strong>and</strong> temporal scales, add further complexity (Groffmanet al., 2006). Research on identifying <strong>and</strong> predicting thresholds in ecosystems is still nascentbut is growing rapidly (Groffman et al., 2006; Scheffer et al., 2009). Both theoretical<strong>and</strong> empirically-based examples of thresholds are on the rise <strong>and</strong> signal an increasingunderst<strong>and</strong>ing of how climate <strong>and</strong> non-climate stressors interact to propel sudden shiftsin ecosystems.Wetl<strong>and</strong>s: These ecosystems are vulnerable to relative rise in water levels togetherwith projected increase in storm activity in zones of significant human use.Salt marshes have considerable capacity to adjust to sea-level rise under favorable conditionsof hydrology <strong>and</strong> sediment supply (Cahoon et al., 2009). Wetl<strong>and</strong>s build soilby a combination of trapping fine-grained cohesive mineral sediments carried by tidalwaters <strong>and</strong> accumulation of plant matter generated onsite. Fine-grained sediment budgetsare often poorly understood (Cahoon el al., 2009). The supply of mineral sedimentscan vary widely from high loads in deltaic <strong>and</strong> back-barrier systems to minimal inputsin extensive estuarine marshes.Increasing inundation can lead to higher rates of sedimentdeposition (Marion et al., 2009), sediment trapping, <strong>and</strong> organic matter accretion(Morris et al., 2002). However, the ability of these ecogeomorphic feedbacks to preservesalt marshes under climate change is limited. Based on simulations from five numericalmodels, Kirwan et al. (2010) concluded that coastal marshes would likely survive conservativeprojections of sea-level rise but would be vulnerable under scenarios of rapidsea-level rise linked to ice sheet melting.The regional <strong>and</strong> sub-regional marshes in North America differ significantly in theirability to build elevation. Northeastern U.S. marshes exhibit high rates of accretion,while southeastern Atlantic, Gulf of Mexico, <strong>and</strong> Pacific salt marshes exhibit lower rates
58 <strong>Coastal</strong> <strong>Impacts</strong>, <strong>Adaptation</strong>, <strong>and</strong> <strong>Vulnerabilities</strong>(Cahoon et al., 2006). Even within a single estuary, tidal marshes can be more or lesssusceptible to sea-level rise depending on local sediment availability (Stralberg et al.,2011). Marshes with low accretion rates are vulnerable to present <strong>and</strong> future sea-levelrise, with the exception of those in areas where the l<strong>and</strong> surface is rising, such as on thePacific Northwest coast of the U.S.The natural supply of mineral sediments contributing to wetl<strong>and</strong> accretion can besignificantly altered by human activities. The interruption of sediment supply to wetl<strong>and</strong>scaused by diking along the Mississippi River is the classic example. Organicmatter deposition can be significant in highly productive wetl<strong>and</strong> systems, but decompositionprocesses moderate the relative importance of this source. Chemical componentsin saltwater increase the rate that organic matter decomposes <strong>and</strong> thus reduce thecontribution of organic sediments to soil-building processes in salt marshes compared tofreshwater systems. Disturbance to vegetation on an otherwise stable marsh could alsolead to submergence beyond depths capable of supporting emergent vegetation, with aconsequent shift to an alternative state such as subtidal open water (Kirwan et al., 2008;Marani et al., 2007). Recent vulnerability assessments carried out for the San FranciscoBay <strong>and</strong> Massachusetts Bays regions (EPA, 2012a, b) supplement these findings. Localexperts identified the potential for wetl<strong>and</strong>s to drop below a threshold for sustainabilityby mid-century in both locations. In California, this could be caused by the effects of sealevelrise in combination with increased wind-driven waves <strong>and</strong> sediment starvation. InMassachusetts, wetl<strong>and</strong> loss could result from changes in hydrology <strong>and</strong> l<strong>and</strong> use alongwith increased nutrient runoff.Mangroves: Mangrove range will exp<strong>and</strong> as minimum temperatures increase.Mangroves in the southern U.S. have been affected by lapses in freeze events <strong>and</strong> extremedrought events in recent decades. These represent a threshold change in climatepattern that may account for unprecedented mangrove expansion into subtropical saltmarsh<strong>and</strong> freshwater ecosystems along the northern Gulf of Mexico. Mangrove populationshave long persisted along the coasts of Texas, Louisiana, <strong>and</strong> Florida but areundergoing more recent expansion in latitudes above the tropical Everglades region(Doyle et al., 2010; Michot et al., 2010). An abrupt increase in establishment of blackmangrove, Avicennia germinans, was observed in 2009 based on aerial surveys begunless than a decade earlier, with ground studies showing increased area <strong>and</strong> density oflocal populations since the last damaging freeze two decades ago (Michot et al., 2010).As the periodicity of freeze events lengthens, mangrove expansion is expected to proceedl<strong>and</strong>ward <strong>and</strong> poleward along the northern Gulf Coast, changing the proportion ofsaltmarsh area. Recent field <strong>and</strong> mapping studies in the northern Everglades have documentedupslope migration of mangroves into tidal freshwater wetl<strong>and</strong>s over the lastcentury, concomitant with historical rates of sea-level rise (Doyle et al., 2010; Krauss etal., 2011). L<strong>and</strong>scape simulation models have been used to reconstruct historical migration<strong>and</strong> forecast expansion of mangrove systems in relation to tropical storms <strong>and</strong> sealevelrise along with decreased freeze events <strong>and</strong> increased drought frequencies underclimate change (Doyle & Girod 1997; Doyle et al., 2003, 2010).
Vulnerability <strong>and</strong> <strong>Impacts</strong> on Natural Resources 59(a)(b)(c)Figure 3-4 Regional variation in three factors that contributeto wetl<strong>and</strong> vulnerability as sea-level rises: (a) Verticalaccretion, the potential for wetl<strong>and</strong> surfaces to build upas sea-level rises (from Reed et al., 2008); (b) topographicvulnerability, the area of dry l<strong>and</strong> sufficiently low to beavailable for new wetl<strong>and</strong>s to form, relative to the area ofexisting tidal wetl<strong>and</strong>s (from Titus & Wang, 2008); (c) futurel<strong>and</strong> use, whether lowl<strong>and</strong>s are expected to be developed<strong>and</strong> protected from the rising sea or remain vacant <strong>and</strong>available for wetl<strong>and</strong> formation (from Titus et al., 2009).
60 <strong>Coastal</strong> <strong>Impacts</strong>, <strong>Adaptation</strong>, <strong>and</strong> <strong>Vulnerabilities</strong><strong>Coastal</strong> Forests: <strong>Coastal</strong> forests will tend to migrate upslope <strong>and</strong> poleward wherethey are able to keep pace with changing habitat conditions.Tidal freshwater forests lie at the interface of migrating coastal marsh/mangrove <strong>and</strong>fixed upl<strong>and</strong> forest (Doyle et al., 2007a), <strong>and</strong> those of the Gulf <strong>and</strong> Atlantic coasts areundergoing dieback <strong>and</strong> retreat due to increasing saltwater intrusion attributed to periodicstorm tides, droughts, <strong>and</strong> tidal inundation from high sea level anomalies <strong>and</strong>chronic sea-level rise (Conner et al., 2007a, b; Doyle et al., 2007b; Williams et al., 1999,2007). Research in coastal forests of Louisiana following Hurricanes Katrina <strong>and</strong> Ritain 2005 found an acute threshold link of coincidental drought <strong>and</strong> storm surge inundationabruptly raising soil salinities; this contributed to mortality of less salt-tolerant treespecies <strong>and</strong> advancing forest dieback <strong>and</strong> displacement by more salt-tolerant marsh/mangrove species (Doyle et al., 2007c; Krauss et al., 2009). The cumulative impact of asubsiding coast, rising sea level, elevated tropical cyclone activity, <strong>and</strong> reduced freshwaterflow will result in accelerated forest dieback <strong>and</strong> coastal retreat as the intertidal zone<strong>and</strong> associated marsh/mangrove migrate upslope (Doyle et al., 2010).Estuaries <strong>and</strong> <strong>Coastal</strong> Lagoons: The structure <strong>and</strong> the functioning of thesesystems will change as habitat suitability is modified <strong>and</strong> the timing of longst<strong>and</strong>ingprocesses is altered.In estuaries, climate-driven changes in freshwater inflows can have major effects onturbidity, salinity gradients, water column stratification, <strong>and</strong> nutrient, sediment, <strong>and</strong>pollutant loads. In the northeastern U.S., peak springtime streamflow is projected to increase(Hayhoe et al., 2006) <strong>and</strong> will likely increase turbidity in coastal systems. Turbiditycaused by sediment directly modulates light penetration through the water column<strong>and</strong> therefore affects primary production by phytoplankton <strong>and</strong> submerged aquaticvegetation (Cloern, 1987). Sea-level rise compounds the impacts of increased turbidity<strong>and</strong> stresses vulnerable seagrass habitats that are already threatened due to eutrophication<strong>and</strong> light-limitation (Orth et al., 2006).In contrast, in Suisun Bay, California, Ganju <strong>and</strong> Schoellhamer (2010) quantified futurechanges in potential productivity as a function of light penetration <strong>and</strong> found that,under future scenarios of sea-level rise <strong>and</strong> decreased sediment supply due to reservoirtrapping upstream, light penetration would increase slightly. Schoellhamer (2011)has since demonstrated that reductions in sediment supply to date have already led toa sudden clearing of waters in San Francisco Bay, potentially reducing levels of lightlimitation. Cloern et al. (2007) reported new seasonal algal blooms in San Francisco Bay;these may become recurrent events as turbidity continues to decline in that system.At the same time, changes in temperature influence water-column stratification, alterchemical <strong>and</strong> biological process rates, <strong>and</strong> cue behaviors such as timing of fish spawningruns (Pankhurst & Munday, 2011). Modest changes in annual temperature patternscan be correlated with changes in abundance <strong>and</strong> distribution of many estuarine organismsincluding submerged aquatic vegetation, finfish, shellfish, <strong>and</strong> plankton. Moore<strong>and</strong> Jarvis (2008) identified increased duration of summer water temperature maximaas a causative factor in the disappearance of eelgrass in portions of the Chesapeake Bay,which is near the southern limit of the plant’s current distribution. Although polewardrange shifts are anticipated for many fish species along the mid-Atlantic coast (Najjar et
Vulnerability <strong>and</strong> <strong>Impacts</strong> on Natural Resources 61al., 2010), the abundance of endemic species is also clearly linked to shifts in temperaturepatterns. Moderating winter temperatures increase the overwintering survival ofjuvenile fish like the Atlantic croaker (Hare & Able, 2007) <strong>and</strong> the blue crab (Bauer, 2006).The interactive effects of climate-driven changes in temperature <strong>and</strong> freshwater flowscan reverberate throughout the food web. Increased temperatures combined with highnutrient loads, higher salinities, reduced flushing times, <strong>and</strong> greater stratification favorcyanobacterial blooms (Paerl & Huisman, 2008). Altered patterns of freshwater inflows<strong>and</strong> temperatures also create the potential for trophic uncoupling of the timing of springphytoplankton blooms <strong>and</strong> juvenile fish hatching (Edwards & Richardson, 2004; Kimmelet al., 2006). Purcell <strong>and</strong> Decker (2005) determined that temperature <strong>and</strong> freshwaterflows were important factors in the abundance of the scyphomedusan Chrysaora quinquecirrhain the Chesapeake Bay. This jellyfish feeds on copepods but also eats another,more voracious copepod predator, the ctenophore Mnemiopsis leidyi. When jellyfish areabundant in warm dry years, they limit the abundance of ctenophores <strong>and</strong>, despite theirown predation, generate a net positive effect on the copepod stock available for juvenilefish.<strong>Coastal</strong> lagoons are shallow water bodies separated from the open ocean by barrierswith restricted inlets that limit flushing (Kjerfve, 1994). They tend to be productive systems,but they are susceptible to eutrophication <strong>and</strong> accumulation of pollutants (Kennish& Paerl, 2010). They are vulnerable to a number of climate-related factors, including1) sea-level rise, which can accelerate roll-over of the barriers or simply submerge the entiresystem, 2) increased air temperatures, which elevate water temperatures <strong>and</strong> reducedissolved oxygen concentrations, <strong>and</strong> 3) increased variability in timing <strong>and</strong> intensityof precipitation, which affects spatial <strong>and</strong> temporal patterns of salinity <strong>and</strong> dissolvedoxygen (Anthony et al., 2009). The combination of increased temperature <strong>and</strong> droughtraises concerns for increasing salinities, which could decrease the habitat suitability forkey species such as mangroves <strong>and</strong> seagrasses.Studies have documented acidification of coastal waters (Doney et al., 2009; Feeley etal., 2009) <strong>and</strong> raised concerns for impacts in estuarine <strong>and</strong> lagoonal systems. The solubilityof carbonate minerals that are important for shell-forming organisms is particularlyresponsive to pH. Relatively minor increases in acidity of coastal waters could makethose minerals more likely to dissolve than precipitate. Acidification of estuarine <strong>and</strong>coastal waters can be exacerbated by eutrophication (Howarth et al., 2011). Studies suggestthat pH declines in some estuaries are already capable of causing “death by dissolution”in juvenile bivalves (Green et al., 2009).Barrier Isl<strong>and</strong>s: These dynamic coastal l<strong>and</strong>scapes naturally migrate in responseto storm activity <strong>and</strong> sea-level rise, a process confounded by human alterations.Barrier isl<strong>and</strong>s occur along nearly all of the Atlantic <strong>and</strong> Gulf coastal plains (FitzGeraldet al., 2008), provide a buffer against waves <strong>and</strong> storm surge, <strong>and</strong> create essentialnursery <strong>and</strong> juvenile habitat for many species. They are in an almost continual state ofchange, responding to sediment supply, waves, currents, <strong>and</strong> water levels (Gutierrez etal., 2009) that shape beach <strong>and</strong> dune morphology. Large <strong>and</strong> rapid alterations to barrierisl<strong>and</strong>s can be driven by storm events such as nor’easters or hurricanes where highwaves move large quantities of s<strong>and</strong>. Over the longer term, barrier isl<strong>and</strong>s also move in
62 <strong>Coastal</strong> <strong>Impacts</strong>, <strong>Adaptation</strong>, <strong>and</strong> <strong>Vulnerabilities</strong>response to changes in sea level by migrating l<strong>and</strong>ward <strong>and</strong> conserving mass throughonshore sediment transport.As the effects of storm events <strong>and</strong> sea-level rise intensify under climate change, theresponse of barrier isl<strong>and</strong> systems will depend largely upon s<strong>and</strong> supply <strong>and</strong> transportprocesses (Gutierrez et al., 2009). Human development in the form of coastal construction<strong>and</strong> shoreline engineering structures such as seawalls <strong>and</strong> jetties have significantlyaltered sediment-transport processes in some locations, exacerbating erosion at localsites <strong>and</strong> compromising the sustainability of beaches <strong>and</strong> barriers. For example, the extensivebarrier system along the North Carolina coast is dependent on storm surges <strong>and</strong>waves for movement of the large quantities of s<strong>and</strong> critical for building <strong>and</strong> maintainingisl<strong>and</strong> elevation <strong>and</strong> width (FitzGerald et al., 2008; Riggs et al., 2011). Hardeningof shorelines to protect roads, residential development, <strong>and</strong> other infrastructure has alreadyresulted in reduced s<strong>and</strong> supply <strong>and</strong> compromised the capacity of the naturalbarrier isl<strong>and</strong> system to adapt to sea-level rise.Considerable evidence suggests that the abovementioned effects of human developmentin combination with sea-level rise <strong>and</strong> storm-driven waves can lead to the crossingof a geomorphic threshold <strong>and</strong> consequent irreversible changes to coastal barriersthat can no longer keep pace with environmental changes (Gutierrez et al., 2009). Thesechanges may include rapid l<strong>and</strong>ward migration; decreased barrier width <strong>and</strong> height;barrier breaching <strong>and</strong> inlet formation; <strong>and</strong> barrier segmentation <strong>and</strong> disintegration.Examples of observed or projected threshold crossings for barrier isl<strong>and</strong>s have beendocumented in Louisiana (FitzGerald et al., 2008; Sallenger et al., 2007) <strong>and</strong> Maryl<strong>and</strong>(Morton et al., 2003; Gutierrez et al., 2009). The potential for threshold behavior will increasealong many of the mid-Atlantic barrier isl<strong>and</strong>s under scenarios of future climatechange (Gutierrez et al., 2009).Deltas: Because of altered sediment supplies <strong>and</strong> local subsidence, deltas, <strong>and</strong>the biodiversity they support, are at risk to drowning during rising sea levels.<strong>Coastal</strong> deltas are formed where rivers empty into the ocean <strong>and</strong> deposit sediments,building a shallow, nutrient-rich platform <strong>and</strong> providing a fertile environment for diversepopulations of marine organisms. The morphology is determined by a combinationof physical processes driven by the river, waves, <strong>and</strong> tides (Bird, 2011). A changingclimate, particularly rises in sea level, <strong>and</strong> the impacts of human development along rivers<strong>and</strong> coasts are now playing a significant role in the behavior <strong>and</strong> evolution of deltaregions.In a changing climate, deltaic environments will experience impacts similar to thosein estuaries, mangrove forests, <strong>and</strong> wetl<strong>and</strong>s (Table 1). Changes in temperature <strong>and</strong> precipitationwill affect water quality <strong>and</strong> ultimately, the viability of delta-supported biota<strong>and</strong> fisheries (Overeem & Syvitski, 2009). For example, in the San Francisco Bay-Deltasystem, increasing water temperatures threaten the sustainability of two endangeredspecies: 1) deltaic smelt due to mean daily temperature threshold of 25°C for high adultmortality <strong>and</strong> 2) Chinook salmon due to spawning <strong>and</strong> rearing temperature exceedances(Cloern et al., 2011; Yates et al., 2008). Habitat <strong>and</strong> water quality are also impactedby altered patterns of precipitation, which affect deltaic hydrology <strong>and</strong> the input of sediments<strong>and</strong> pollutants.
Vulnerability <strong>and</strong> <strong>Impacts</strong> on Natural Resources 63Delta survival requires equilibrium between sediment supply <strong>and</strong> rising sea levels.Deltas naturally degrade as sediments subside <strong>and</strong> get reworked by storms, <strong>and</strong>, overthe longer term, deltas, like barrier isl<strong>and</strong>s, are generally self-sustaining systems undernatural conditions given an adequate supply of sediment. However, the constructionof levees <strong>and</strong> dams, <strong>and</strong> navigation activities along major U.S. rivers have alterednatural sediment flows <strong>and</strong>, in some cases, starved the natural environment of the sedimentsupply necessary to keep pace with changing water levels. Deltas world-wide areexperiencing l<strong>and</strong>-loss due to the combined effects of increased human development,subsidence, <strong>and</strong> rising sea levels (Nicholls et al., 2007; Syvitski et al., 2009). The Bird’s-Foot Delta of the Mississippi River provides one of the more striking examples of thesecompounding impacts. Here, sea levels are rising at three times the rate of sedimentaccumulation on the delta, which portends the inevitable drowning of this delta system(Blum & Roberts, 2009).Mudflats: Mudflats are susceptible to threshold changes due to the combinedeffects of sea-level rise, temperature, l<strong>and</strong> use, altered flows, <strong>and</strong> increasednutrient runoff.Sea-level rise is already reducing the intertidal area of mudflat feeding habitat for wadingbirds within estuaries, especially in locations constrained by coastal protective barriers(Galbraith et al., 2005). In a recent assessment of the sensitivities of mudflat communitiesto climate change in the San Francisco Bay estuary (EPA, 2012a), local experts identifiedthe potential for nonlinear losses within benthic communities due to a combination ofnutrient runoff <strong>and</strong> increased temperatures that drive dissolved oxygen levels below athreshold. They also anticipated precipitous losses of wading bird populations due toreduced prey densities <strong>and</strong> shrinking feeding habitat resulting from sea-level rise <strong>and</strong>sediment starvation. Although the potential for such thresholds may be high, patternsof disturbance <strong>and</strong> recovery in mudflats are extremely patchy <strong>and</strong> context-dependent<strong>and</strong> larger-scale behavioral responses of bird populations are unknown, which makespredictions of exactly when <strong>and</strong> where a threshold change may occur difficult to offer(EPA, 2012a; Norkko et al., 2010).Rocky Shores: Complex interactions between physical <strong>and</strong> biological factorshave been demonstrated in rocky-shore communities, which makes responses toclimate change difficult to predict.Although the impacts of sea-level rise are obvious for rocky-shore intertidal communities,temperature <strong>and</strong> ocean acidity are also potentially important. Hawkins et al. (2008)have noted general changes in abundance <strong>and</strong> range of rocky-shore species that can beattributed to climate warming. Although most of these changes involve range expansions,investigators caution that this may simply reflect the preponderance of studies atthe northern limits of species ranges compared to studies in lower latitudes. At a regionalscale, long-term recruitment records for mussels <strong>and</strong> barnacles showed a relationshipto large-scale climate <strong>and</strong> upwelling patterns along the U.S. West Coast (Menge et al.,2011a). The relationship explained approximately 40 percent of the variance in the recruitmentrecord. At the local scale, Harley (2011) determined that climate warming hadthe potential to drive changes in the community structure of rocky shores as it limited
64 <strong>Coastal</strong> <strong>Impacts</strong>, <strong>Adaptation</strong>, <strong>and</strong> <strong>Vulnerabilities</strong>habitat suitability in the high intertidal zone for barnacles <strong>and</strong> mussels. Temperaturetolerances could force these keystone species to live in lower, cooler zones where theyare more vulnerable to predatory sea stars.Increasing ocean acidity may make building <strong>and</strong> maintaining calcium carbonateshells more difficult, <strong>and</strong> this may be detrimental to key shellfish species in rocky shorecommunities (Gaylord et al., 2011). In addition to the loss of structural diversity thismight cause, diminished populations of filter feeders <strong>and</strong> rock-cleaning invertebratescould lead to increased algal populations on rocky shores.Although these findings suggest rocky intertidal communities are affected by climate,the complexity of key species’ individual <strong>and</strong> interactive responses to many otherenvironmental drivers make predicting community responses difficult (Menges et al.,2001b).Sea-ice systems: Sea-ice ecosystems are already being adversely affected by theloss of summer sea ice <strong>and</strong> further changes are expected.Perhaps most vulnerable of all to the impacts of warming are Arctic ecosystems such asthe Bering Sea. This area off the western coast of Alaska produces our nation’s largestcommercial fish harvests as well as providing food for many Native Alaskan peoples.Sea ice, a critical component of this ecosystem, is vanishing more rapidly than earlierprojections <strong>and</strong> may disappear entirely in summertime within this century (ACIA, 2005;Janetos et al., 2008; Royal Society, 2005). Fish populations depend on plankton bloomsthat are regulated by the extent <strong>and</strong> location of the ice edge in spring. As sea ice continuesto decline, the location, timing, <strong>and</strong> species composition of the blooms is changing.The spring melt of sea ice in the Bering Sea has long provided material that feeds clams,shrimp, <strong>and</strong> other life forms on the ocean floor that, in turn, provide food for walruses,gray whales, bearded seals, eider ducks, <strong>and</strong> many fish; however, the earlier ice meltresulting from warming leads to phytoplankton blooms that are largely consumed bymicroscopic animals near the sea surface, which vastly decreases the amount of foodreaching the living things on the ocean floor. This will radically change the species compositionof the fish <strong>and</strong> other creatures with significant repercussions for both subsistence<strong>and</strong> commercial fishing (Janetos et al., 2008).Ringed seals give birth in snow caves on the sea ice, which protect their pups fromextreme cold <strong>and</strong> predators. Warming leads to earlier snow melt, which causes the snowcaves to collapse before the pups are weaned. The small, exposed pups may die of hypothermiaor be vulnerable to predation by arctic foxes, polar bears, gulls, <strong>and</strong> ravens.Gulls <strong>and</strong> ravens are also arriving earlier in the Arctic as springs become warmer, whichincreases the birds’ opportunity to prey on the seal pups (Janetos et al., 2008).Polar bears are the top predators of the sea-ice ecosystem <strong>and</strong> they use the ice as aplatform from which to hunt seals, their primary prey. Polar bears take advantage of thefact that seals must surface to breathe in limited openings in the ice cover. In the openocean, successful hunting is rare because bears lack a hunting platform <strong>and</strong> seals are notrestricted in where they can surface. In addition, the rapid rate of warming in Alaska<strong>and</strong> the rest of the Arctic is sharply reducing the snow cover in which polar bears builddens. Female polar bears hibernate in dens for four to five months each year <strong>and</strong>, whilethere, give birth to their cubs. Born weighing only about 1 pound, the tiny cubs depend
Vulnerability <strong>and</strong> <strong>Impacts</strong> on Natural Resources 65on the snow den for warmth. About two-thirds of the world’s polar bears are projectedto be gone by the middle of this century. In 75 years, projections suggest that the wildpolar bear population will be gone entirely from Alaska (Janetos et al., 2008).ConclusionsThreshold shifts in ecosystems can have severe negative consequences for ecosystemservices, economic sustainability, <strong>and</strong> human health <strong>and</strong> well-being (Harley et al., 2006;Lubchenco & Petes, 2010; MEA, 2005). Recent papers have further advanced the dialogueon key research directions for elucidating threshold mechanisms <strong>and</strong> identifyingearly-warning signals of impending abrupt transitions (Groffman et al., 2006; Schefferet al., 2009); however, even though single-species responses to particular stressors oftenare fairly well known, mechanistic underst<strong>and</strong>ing of cumulative effects of multi-stressorinteractions, especially at the community level, remains elusive. A recent review of topresearch priorities for conservation <strong>and</strong> management cites the need to exp<strong>and</strong> scientificunderst<strong>and</strong>ing of multi-stressor interactions <strong>and</strong> thresholds (Fleishman et al., 2011).This includes methods to identify the triggers of threshold responses <strong>and</strong> to anticipatethe likely trajectory of post-threshold states under a range of future scenarios of climate<strong>and</strong> l<strong>and</strong>-use change (Briske et al., 2006). Such information will be key to managers’ abilityto manage for change when threshold shifts occur (West et al., 2009).As the natural resources of coastal systems respond to changing climatic conditions,human modification <strong>and</strong> management of these systems is a major factor in the characterof the response. In many cases the capacity of coastal systems to reposition or reshapethemselves in response to climate drivers is constrained by the physical modificationsmade to accommodate <strong>and</strong> sustain human uses. This adds an additional level of complexityto forecasts of ecosystem responses. It also highlights the need for system-levelthinking as we work to adapt to the evolving conditions.
Chapter 4Vulnerability <strong>and</strong> <strong>Impacts</strong> on HumanDevelopmentKey FindingsffffffffffffExp<strong>and</strong>ing economic <strong>and</strong> population exposure along the coast significantlyincreases the risk of harm <strong>and</strong> exposes already vulnerable communities to theimpacts of climate change. Since 1980, roughly half of the nation’s new residentialbuilding permits were issued in coastal counties, which substantially increasesvulnerability <strong>and</strong> risk of loss <strong>and</strong> adds to already populated <strong>and</strong> densely developedmetropolitan areas. High Confidence.The full measure of human vulnerability <strong>and</strong> risk is comprised of the vulnerabilitiesof human development, economic sectors, associated livelihoods, <strong>and</strong>human well-being. The interactions of climate-related vulnerabilities with otherstressors in the coastal zone pose analytical challenges when coupled with thelack of quantitative, multi-stressor vulnerability assessments. High Confidence.Storm surge flooding <strong>and</strong> sea-level rise pose significant threats to public <strong>and</strong>private infrastructure that provides energy, sewage treatment, clean water, <strong>and</strong>transportation of people <strong>and</strong> goods. These factors increase threats to publichealth, safety, <strong>and</strong> employment in the coastal zone. High Confidence.Systematic incorporation of climate risk into the insurance industry’s rate-settingpractices <strong>and</strong> other business investment decisions could present a cost-effectiveway to deal with low probability, high severity weather events. Without reform,the financial risks associated with both private <strong>and</strong> public hazard insurance areexpected to increase as a result of expected climate change <strong>and</strong> sea-level rise.High Confidence.Expected public health impacts include a decline in seafood quality, shifts indisease patterns <strong>and</strong> increases in rates of heat-related morbidity. Better predictionsof coastal related public health risks will require sustained multi-disciplinarycollaboration among researchers <strong>and</strong> health practitioners in the climate,oceanography, veterinary, <strong>and</strong> public health sciences. Moderate Confidence.Although the Department of Defense (DoD) has started to consider the impactsof climate change on coastal installations, operations, <strong>and</strong> military readiness, theDoD requires actionable climate information <strong>and</strong> projections at mission-relevanttemporal <strong>and</strong> spatial scales to maintain effective training, deployment, <strong>and</strong> forcesustainment capabilities. High Confidence.66
Vulnerability <strong>and</strong> <strong>Impacts</strong> on Human Development 674.1 Overview: <strong>Impacts</strong> on Human Development <strong>and</strong> SocietalVulnerabilityThe societal vulnerability of U.S. coasts to climate change is multifaceted, includingvulnerabilities of economic sectors, cultural resources, <strong>and</strong> human well-being of a diverseconcentration of people. In addition to the vulnerability <strong>and</strong> potential impacts ofa changing climate on natural resources <strong>and</strong> threats to ecosystem services described inChapter 3, homes <strong>and</strong> other human development in the coastal zone are also increasinglyat risk. This exp<strong>and</strong>ed vulnerability has three dimensions: exposure, sensitivity,<strong>and</strong> resilience or adaptive capacity. The interactions of climate-related vulnerabilitieswith other stresses, such as economic downturn, environmental degradation, loss ofecosystem services, <strong>and</strong> continued pressures for development pose further analyticalchallenges. Current research on societal vulnerability in the coastal area does not yetfully consider or capture these multifaceted attributes of societal vulnerability.Rising sea levels will change accretion <strong>and</strong> erosion patterns <strong>and</strong> increase tidal <strong>and</strong>storm-surge flooding in the coastal zone. Weiss <strong>and</strong> others (2011) report that 160 U.S.municipalities with populations between 50,000 <strong>and</strong> 300,000 <strong>and</strong> 20 major cities withpopulations greater than 300,000 have l<strong>and</strong> areas at or below 6 meters <strong>and</strong> connectivityto the ocean. Figure 4-1 shows the major cities with populations greater than 300,000<strong>and</strong> the percent of l<strong>and</strong> in those cities at elevations between 1 <strong>and</strong> 6 meters. The figuresuggests that the most vulnerable coastal cities in the U.S. are located in the southernarea of the Atlantic Ocean <strong>and</strong> the Gulf of Mexico.Figure 4-1 L<strong>and</strong> area percentagesof major municipalities (2000 censuspopulation greater than 300,000)with elevations at or below 1-6 m<strong>and</strong> connectivity to the sea. Theaverage l<strong>and</strong> area percentage forall 180 municipalities (200 censuspopulation greater than 50,000) withelevations at or below 1-6 meters <strong>and</strong>connectivity to the sea is on the right.Source: Weiss et al., 2011. Used withpermission from Climatic Change.Neumann <strong>and</strong> others (2010) assessed the consequences of sea-level rise on developedcoastal areas of the continental U.S. <strong>and</strong> determined the cost of adaptation to increasedtidal flooding over time. They considered three adaptation options: retreat, beach
68 <strong>Coastal</strong> <strong>Impacts</strong>, <strong>Adaptation</strong>, <strong>and</strong> <strong>Vulnerabilities</strong>nourishment, <strong>and</strong> sea walls (see also Chapter 5, <strong>Adaptation</strong> <strong>and</strong> Mitigation.) For theperiod 2000 to 2100, they determined the value of each property on a 150 meter by 150meter grid <strong>and</strong> calculated the long-term costs of adaptation. Their findings indicate thatthe total discounted costs of adaptation range from $50 billion to $74 billion. The highestcosts are estimated in Florida due to the extent of flooding <strong>and</strong> the value of the property.Costs in the North Atlantic are also relatively high due to property values. Although theGulf coast has much exposed property, the total costs of adaptation are relatively lessthan the North Atlantic <strong>and</strong> Florida because of lower property values.The following sections present an overview of the current underst<strong>and</strong>ing of the potentialimpacts of a changing climate on human developments <strong>and</strong> societal vulnerabilityin the coastal zone. The first section considers the status of efforts to provide integrativeassessments of relative vulnerability, exposure, <strong>and</strong> human loss. Subsequent sections focuson topics of concentrated investigation including potential impacts on urban areas,coastal communities, <strong>and</strong> infrastructure; water-resource infrastructure, transportation,ports, <strong>and</strong> navigation; insurance; tourism <strong>and</strong> recreation; real estate; emergency management<strong>and</strong> recovery; coastal <strong>and</strong> nearshore oil <strong>and</strong> gas; human health; <strong>and</strong> militaryfacilities. Many of the studies are focused on the impacts of sea-level rise in conjunctionwith historical <strong>and</strong> projected impacts from coastal storms <strong>and</strong> flooding. These are not intendedto be comprehensive consideration of all human development impacts but ratherillustrative of socio-economic impacts <strong>and</strong> implications for key sectors.4.2 Relative Vulnerability, Exposure, <strong>and</strong> Human LossesThe physical processes of weather <strong>and</strong> climate, including both extreme events <strong>and</strong> longtermchanges in sea level, occur within a context of increasingly dense human developmentin the coastal regions. The growing human vulnerability in the coastal zone is afunction of these physical forces, but more significant is the exp<strong>and</strong>ing economic <strong>and</strong>population exposure that increase risks that are not proportionally shared by those whobenefit from coastal living (Cutter et al., 2007). The body of research on the vulnerabilityof coastal urban areas to climate change-related threats has increased over the past decade(Birkmann et al., 2010; Colleet et al., 2008; Kleinosky et al., 2007; Lowe et al., 2009).The evidence suggests that societal losses associated with coastal hazards are increasing(Cutter et al., 2007; Hoffman et al., 2010; Pielke et al., 2008; Schmidt et al., 2010), butsome researchers have concluded that the pattern of loss is solely a function of increasedpopulation growth <strong>and</strong> wealth (Pielke et al., 2008; Schmidt et al., 2010) with no long-termclimate signals on normalized damages associated with extreme events. One study haschallenged that assumption by showing that, when controlling for growth <strong>and</strong> wealth,per capita losses have increased instead of remaining steady (Gall et al., 2011), whichindicates the role of other contributing factors such as more frequent disasters or largermagnitude disasters, possibly due to climate variability <strong>and</strong> change, or changes in societalresilience. Hoffman et al. (2010) also show increases in average annualized lossesprojected to 2030 from sea-level rise scenarios normalized by aggregate property value.Other research efforts consider additional losses not often assessed through marketvaluation or fully integrated in studies. For example, Gopalakrishnan et al. (2010)
Vulnerability <strong>and</strong> <strong>Impacts</strong> on Human Development 69evaluated the value of beach width using a hedonic pricing model 8 <strong>and</strong> found that residentialproperty values may decline substantially in places affected by increased erosionrates <strong>and</strong> costs of s<strong>and</strong> nourishment. The analysis suggests that residential housingvalues in coastal regions may be sensitive to the availability of s<strong>and</strong> for maintainingbeaches. Chapter 3 of this report discusses some of the impacts on natural resourcessystems that can also provide ecosystem services that benefit human systems (see alsoReal Estate <strong>and</strong> Tax Revenue, section 4.4.5) Public listening sessions conducted in NorthCarolina in 2010 raised concerns over anticipated community costs of adapting vulnerableinfrastructure in response to potential climate change impacts as well as respondingto increased job losses in fisheries, reduction of agricultural l<strong>and</strong>s <strong>and</strong> the farmingindustry, loss of manufacturing plants along the water, <strong>and</strong> declines in tourism (Brownet al., 2010). On an individual level, inspirational <strong>and</strong> tacit values of coastal lagoons, orsense of place, are difficult to value <strong>and</strong> often overlooked in evaluating impacts (Anthonyet al., 2009).Since the 2009 NCA, considerable advancements have been made towards underst<strong>and</strong>ingthe links between environmental stressors <strong>and</strong> social vulnerability in coastalareas <strong>and</strong> developing the empirical basis for assessing differential impacts. Most ofthe extant research examines a single stressor; for example, Lin <strong>and</strong> Morefield (2011)produced a relative ranking of vulnerability for coastal communities in the NationalEstuary Program, incorporating measures of estuary conditions such as water quality,sediment, contaminants, benthic quality, coupled with human-induced l<strong>and</strong>-use changessuch as impervious surface <strong>and</strong> wetl<strong>and</strong> loss, <strong>and</strong> socio-economics. In the contextof hurricanes, several recent papers examine the relationship between hurricane hazardssuch as windfields <strong>and</strong> storm surge <strong>and</strong> the differential impact on social groupsin coastal areas with case studies of the Mississippi coast after Hurricane Katrina (Burton,2010), Miami (Bjarnadottir et al., 2011) <strong>and</strong> Sarasota, Florida (Frazier et al., 2010a).Frazier <strong>and</strong> others (2010a) concluded that future sea-level rise contributes to the spatialextent of storm-surge impacts even without an increase in intensity or severity ofhurricanes. Bjarnadottir <strong>and</strong> others (2011) also examined storm surge-height <strong>and</strong> windspeeds for various future climate scenarios <strong>and</strong> concluded that more deaths <strong>and</strong> injurieswill be expected because of hurricane frequency <strong>and</strong> higher intensities. As discussed inpreceding chapters, an increase in hurricane frequency is not indicated by recent climatemodels <strong>and</strong> trends.Another area of integrated hazard assessment examines the relationship betweenpopulations displaced by hurricanes <strong>and</strong> their underlying vulnerability, resilience, <strong>and</strong>hurricane risk (Mitchell et al., 2011). In the development of a comparative index of hurricanedisplacement, Esnard <strong>and</strong> others (2011) found that, of the 158 coastal countiesstudied from Texas to North Carolina, coastal Florida counties are the most vulnerable,especially those in South Florida because of the combination of hurricane risk probability<strong>and</strong> extant social vulnerability. Another study examined the relative vulnerability of8 A hedonic model is based on price factors that are determined both by the internal characteristics of thegood being sold <strong>and</strong> the external factors affecting the value of those goods. One example is the housingmarket in which the price of housing is affected by factors such as the size <strong>and</strong> characteristics of the house,the neighborhood, proximity to schools <strong>and</strong> hospitals <strong>and</strong> mortgage interest rates.
70 <strong>Coastal</strong> <strong>Impacts</strong>, <strong>Adaptation</strong>, <strong>and</strong> <strong>Vulnerabilities</strong>coastal counties in terms of the erosion hazard (Boruff et al., 2005) throughout the U.S.based on physical process indicators such as tidal range, slope, shoreline erosion <strong>and</strong> accretionrates, <strong>and</strong> social vulnerability. The intersection of physical <strong>and</strong> social measureshighlighted the differences in relative vulnerability, with the Gulf Coast vulnerabilitymore reflective of social characteristics <strong>and</strong> the Pacific <strong>and</strong> Atlantic coast counties morereflective of physical attributes.Research demonstrates a paucity of multi-peril or multi-stressor vulnerability assessments.One of the most recent studies examined climate-sensitive hazards for thesouthern U.S. using drought, flooding, hurricane winds, <strong>and</strong> sea-level rise (Emrich &Cutter, 2011). The differential spatial impacts were determined as the intersection ofhazards <strong>and</strong> social vulnerability. Using a technique known as bivariate mapping, thestudy found counties with high levels of social vulnerability <strong>and</strong> multiple hazard exposure;these were designated as hotspots. Many of these are located in coastal counties inTexas, Louisiana, <strong>and</strong> Florida.4.3 Socio-economic <strong>Impacts</strong> <strong>and</strong> ImplicationsUrban CentersThe impacts of Hurricane Katrina on New Orleans <strong>and</strong> other coastal communities exemplifiedthe disparities among how people of different racial <strong>and</strong> socio-economic groupsmight be affected differently by extreme weather events. Particular areas of disparityincluded: who lived in neighborhoods that were vulnerable to flooding, which groupswere evacuated during the flood, how different groups were treated during the evacuation,which neighborhoods belonging to which groups were rebuilt, <strong>and</strong> who was representedin the decision-making process (Mohai et al., 2009). Heberger <strong>and</strong> others (2009)also found that communities of color would be disproportionally impacted by coastalflooding in San Francisco Bay, CA. Research in East Boston, MA, (Douglas et al., 2012;Kirshen et al., 2012) found that recent, low income immigrants have few adaptation optionsbecause they are limited by economic, political, or social resources, but the participatoryresearch found that participants appeared to be empowered by the knowledgethey gained during the process <strong>and</strong> wanted to take action.Rosenzweig <strong>and</strong> others (2011) summarized potential storm-surge impacts on infrastructurein the New York City metro area under several scenarios of sea-level rise. Theseinclude flooding of thermal power plants, wastewater treatment plants, transit systems<strong>and</strong> basements, <strong>and</strong> increased combined sewer overflows. They report on a range ofhard <strong>and</strong> soft adaptation strategies under the planning framework of Flexible <strong>Adaptation</strong>Pathways, which is essentially a series of responses tied to changes in knowledgeof the climate <strong>and</strong> socio-economic conditions. They also propose the setting of <strong>Climate</strong>Protection Levels for critical infrastructure; for instance, one proposal plans for 4 feet ofsea-level rise by 2080 with all critical infrastructure designed to be protected to this level.The San Francisco Bay area has 7 million people, 9 counties, <strong>and</strong> 46 cities along theshoreline. If sea level rises 55 inches, the new floodplain of the 100-year coastal stormsurge could potentially flood 270,000 people, over 90 percent of areas of airports, 20percent of areas of ports, <strong>and</strong> 28 percent of areas of water-related industry in addition tostressing public health, <strong>and</strong> flood wastewater treatment plants, rail lines, <strong>and</strong> beaches.
72 <strong>Coastal</strong> <strong>Impacts</strong>, <strong>Adaptation</strong>, <strong>and</strong> <strong>Vulnerabilities</strong>Galveston, TX <strong>and</strong> Mobile, AL found that 27 percent of major roads, 9 percent of raillines, <strong>and</strong> 72 percent of ports are at or below 122 centimeters. A 7-meter storm surge inthis area puts over half of the major highways, nearly half of the railways, 29 airports,<strong>and</strong> nearly all of the ports at risk of flooding (Savonis et al., 2008).Sea-level rise <strong>and</strong> an increase in the intensity of coastal storms could have substantialimpacts on U.S. port facilities (EPA, 2008; Moser et al., 2008; Savonis et al., 2008; US-GCRP, 2009). Major storms cause many types of damage to ports, including: direct damageto port infrastructure, release of hazardous materials stored on the port, loss of jobs,supply chain interruptions, downtime, debris on surrounding waterways <strong>and</strong> neighborhoods,damage to cargo, <strong>and</strong> others (Esteban et al., 2009; Fritz et al., 2008; Joint LegislativeCommittee on Performance Evaluation <strong>and</strong> Expenditure Review, 2006; Lewis et al.,2006; Louisiana Department of Transportation <strong>and</strong> Development Office of Public Works<strong>and</strong> Intermodal Transportation, 2006; Reeve, 2010). Port shutdowns in Mississippi afterHurricane Katrina impacted commerce in 30 states (Joint Legislative Committee on PerformanceEvaluation <strong>and</strong> Expenditure Review, 2006).Hurricane Ike caused $2.4 billion of damage to Texas ports <strong>and</strong> waterways (FEMA,2008). Many ports may require modifications to berths <strong>and</strong> docks <strong>and</strong> associated infrastructureas sea level rises, though few ports have taken such actions yet (Becker et al.,2011). A few ports have begun to conduct assessments of their facilities to evaluate thekinds of impacts that may occur. Along the Gulf Coast, changes in sea levels <strong>and</strong> storminessare exacerbated by l<strong>and</strong> subsidence, causing an even higher rate of relative rise.Due to the linked nature of ports with inl<strong>and</strong> networks <strong>and</strong> climate-sensitive goods,they face a wide array of both direct <strong>and</strong> indirect threats (Stenek et al., 2011). A reportby the International Finance Corporation for The Port of Cartagena, Columbia (Steneket al., 2011) finds that ports are particularly vulnerable due to their long lifetimes <strong>and</strong>their reliance on an extensive global supply chain. Ports in different U.S. regions willface different types of issues due to local conditions <strong>and</strong> the types of products h<strong>and</strong>led.In the New Engl<strong>and</strong> area, Kirshen et al. (2008) project that, by 2050, the current 1-in-100year flooding event could become the 1-in-8 year event under the IPCC’s high-emissionsscenario, which would result in many more catastrophic events to critical port facilitiesalong this stretch of coast.Port managers in the Great Lakes are concerned that decreasing lake levels couldhave severe impacts on navigation (Becker et al., 2011). IPCC (2007) forecasts suggestdecreasing ice flows <strong>and</strong> increased snow fall in the winter months, which would resultin more significant seasonal fluctuations in lake levels. Lower lake levels would impactthe lake-shipping industry <strong>and</strong> could result in the cessation of shipping in very lowlake-level years.<strong>Climate</strong> change impacts on the coastal-shipping industry are less clear. Shippingroutes may need to be altered with changes in storm tracks <strong>and</strong> bridge clearances forlarge ships will be reduced as sea levels rise (Moser et al., 2008). Sea-level rise may resultin greater drafts in shipping channels, which would reduce dredging requirements insome areas; however, this could be offset by increased sediment loads along the coastresulting from increased precipitation <strong>and</strong> erosion from sea-level rise. <strong>Coastal</strong> stormscan have profound impacts on navigation channels. Wind- <strong>and</strong> precipitation-drivencurrents can cause channels to fill in <strong>and</strong> navigational aids such as buoys <strong>and</strong> channelmarkers can be driven off station. Marine debris such as tree limbs, damaged vessels, or
Vulnerability <strong>and</strong> <strong>Impacts</strong> on Human Development 73pieces of shore-side structures can block a channel for days or more (Tirpak, 2009).Melting sea ice will also present new opportunities for transport through areas historicallyblocked by sea ice. The opening of the Northwest Passage could shorten shippingtimes for some routes that currently utilize the Panama Canal; however, new shiptraffic in these pristine wilderness areas could also have consequences for the sensitivearctic environment. In addition, significant legal hurdles need to be overcome beforethis becomes a viable route (Emmerson, 2011).Water Resources <strong>and</strong> InfrastructureWarming associated with climate change is expected to intensify the hydrologic cycle(see Chapter 2), which would increase precipitation in some coastal areas, geographicshifts in hurricane <strong>and</strong> other storm tracks, <strong>and</strong> more frequent <strong>and</strong> intense droughts.Changes in vulnerability to climate extremes in the water sector may result from changesin the volume, timing, <strong>and</strong> quality of available water (Aggarwal & Singh, 2010; Buonaiutoet al., 2010). These physical processes will have profound impacts on water quality<strong>and</strong> quantity for coastal communities <strong>and</strong> serious implications for water-resources infrastructure<strong>and</strong> management regimes.Water SUPPLY <strong>and</strong> Drought. An increase in the variability of precipitation willresult in major challenges for water-resource managers. Most water resource-managementinfrastructure <strong>and</strong> planning is based on assumptions of stationarity <strong>and</strong> the conceptthat historical variability in precipitation can be used to predict future variabilityin the design <strong>and</strong> management of water systems (Milly et al., 2008). If climate changeis accompanied by substantial changes in the variability of precipitation as is projected(Bates et al., 2008; Gutowski et al., 2008), water-resource availability will be affected unlessresource managers develop adaption plans that can accommodate such changes.In some regions, drought will likely be compounded by higher rates evapotranspiration,which could result in increased groundwater withdrawals because of higher irrigationwater dem<strong>and</strong>s (Hatfield et al., 2008). Together, these climatic changes <strong>and</strong> humanadaptations to drought could result in depletion of coastal aquifers <strong>and</strong> saltwater intrusion(Conrad et al., 2010).Riverine <strong>and</strong> COASTAL FLOODING. <strong>Climate</strong> change has the potential to substantiallyaffect risk of flooding <strong>and</strong> associated impacts to human health, infrastructure, <strong>and</strong>agriculture in the Nation’s coastal communities. This includes storm surge, tidal, <strong>and</strong>wave-driven flooding along open coasts <strong>and</strong> estuaries as well as flooding along riversother <strong>and</strong> inl<strong>and</strong> waterways that eventually deposits floodwaters in the coastal zone.The historic flooding in the Mississippi River <strong>and</strong> Tributaries system in 2011 illustratedthe extent to which water infrastructure <strong>and</strong> management across hundreds of milesfrom the coast can have profound impacts on coastal communities <strong>and</strong> resources. Theseverity of the 2011 flooding necessitated emergency modifications to water managementin the area affected by the Mississippi River <strong>and</strong> its tributaries to reduce floodingof local communities. This included the U.S. Army Corps of Engineers’ (USACE’s) controlledbreaching of the Birds Point Levee in Missouri, diverting floodwaters from Cairo,IL onto Missouri farm l<strong>and</strong>s. Floodwaters laden with nutrients such as nitrogen <strong>and</strong>phosphorus <strong>and</strong> sediment derived from agricultural fields <strong>and</strong> other upl<strong>and</strong> sources
74 <strong>Coastal</strong> <strong>Impacts</strong>, <strong>Adaptation</strong>, <strong>and</strong> <strong>Vulnerabilities</strong>were delivered to the Gulf Coast, in some cases more rapidly than normal as the US-ACE operated emergency spillways at Morganza <strong>and</strong> Bonnet Carre in coastal Louisiana(NOAA, 2011a). The floodwaters contributed to an increase in the Gulf’s hypoxic zone toan area nearly equal to the l<strong>and</strong> area of the state of New Jersey <strong>and</strong> threatened the Gulf’svaluable commercial <strong>and</strong> recreational fisheries (NOAA, 2011b).As noted above, increases in the frequency <strong>and</strong> intensity of extreme weather are alsoexpected to impact coastal infrastructure, services in coastal regions <strong>and</strong> particularlyports, <strong>and</strong> key nodes of international supply chains (Oh & Reuveny, 2010). Heavier rainfall,combined with sea-level rise <strong>and</strong> storm surge is expected to substantially increasethe frequency of flooding in major metropolitan areas in the northeastern U.S. in the 21stcentury (Kirschen et al., 2008) <strong>and</strong> in California (Moser & Tribbia, 2006).Although only a single storm, Hurricane Katrina illustrated the vulnerabilities of thenation’s coastal flood-protection infrastructure <strong>and</strong> the ongoing need to consider nonstationarity<strong>and</strong>/or previously unobserved environmental conditions including impactsrelated to sea-level rise, coastal subsidence, <strong>and</strong> changes in storm characteristics. TheUSACE recently updated the sea level-rise curves contained in its primary engineeringguidance for use in its civil works programs (USACE, 2011).Water QUALITY, WASTEWATER, <strong>and</strong> STORMWATER MANAGEMENT. <strong>Climate</strong>change <strong>and</strong> associated effects on patterns of precipitation may result in deterioration ofwater quality (Delpla et al., 2009; Park et al., 2010; Whitehead et al., 2009). Precipitationincreases on l<strong>and</strong> have increased river runoff <strong>and</strong> polluted coastal waters with nitrogen<strong>and</strong> phosphorous as well as sediments <strong>and</strong> other contaminants (Buonaiuto et al., 2010).Storm-water drainage systems, designed with historical patterns of precipitation inmind, may also prove inadequate to new environmental conditions (Mailhot & Duchesne,2010; Rosenberg et al., 2010). Increased precipitation <strong>and</strong> especially increases inextreme precipitation events in coastal areas could lead to an increased frequency ofcombined sewer overflows (CSOs) that could result in beach closures <strong>and</strong> shellfish bedclosures (Bookman et al,. 1999). Mallin <strong>and</strong> others (2001) conclude that increasing rainfall<strong>and</strong> runoff on developed l<strong>and</strong>s with higher impervious surfaces or more septic systemsleads to the transport of more fecal coliform contaminant to shellfish beds <strong>and</strong>subsequent closures (Line et al., 2008).Increases in heavy precipitation combined with sea-level rise in New York could affectthe heights of tide gates designed to prevent the inflow of seawater <strong>and</strong> backing upof outfall sewers (NYCDEP, 2008). According to Buonaiuto et al. (2010: pg. 130), “[m]ore tide gates may need to be installed at outflow locations to prevent such inflows,<strong>and</strong> more frequent repairs of the gates may become necessary. If high tide levels duringstorms cause backup of sewage, more could be forced into wastewater treatment plants,necessitating the throttling of flows to protect the plants from flooding. <strong>Coastal</strong> floodingcould increase salinity of influent into wastewater pollution control plants (WPCPs) <strong>and</strong>lead to corrosion of equipment.”Tourism <strong>and</strong> Recreation<strong>Climate</strong> change may have a significant impact on the global tourism <strong>and</strong> recreation industry.In 2010, the tourism <strong>and</strong> recreation industry constituted an estimated 9.3 percent
Vulnerability <strong>and</strong> <strong>Impacts</strong> on Human Development 75of global gross domestic product (United Nations World Tourism Organization, 2009).In the U.S. alone, total travel expenditures totaled $715.87 billion in 2010 <strong>and</strong> are projectedto reach $815.7 billion in 2011 (U.S. Travel Association, 2011). Significant travel <strong>and</strong>recreation activities in turn produce GHG emissions that are relatively significant <strong>and</strong>likely to increase. The United Nations World Tourism Organization (2008) estimatedthat international <strong>and</strong> domestic tourism represented between 3.9 <strong>and</strong> 6.0 percent, with abest estimate of 4.9 percent, of global greenhouse emissions in 2005.<strong>Climate</strong> change, coupled with other environmental, economic, <strong>and</strong> social factors,could significantly impact travelers’ selection of tourist destinations <strong>and</strong> the quality ofthose destination experiences. Broadly, these climate impacts can be characterized asfollows:• Changes in the length <strong>and</strong> quality of seasons, which could affect climate-dependenttourism such as destinations offering beach vacations;• Direct effects on key tourist attractions such as coral reefs through ocean acidification,which could reduce tourists’ dem<strong>and</strong> for certain locations;• <strong>Climate</strong> change-related impacts on water availability, biodiversity loss,increased severity of extreme weather-related events, increasing incidences ofvector-borne diseases, <strong>and</strong> damages to infrastructure, all of which are likely tohit coastal tourism destinations sensitive to such events particularly hard;• Increased transportation <strong>and</strong> fuel costs associated with efforts to reduce GHGemissions, which could reduce tourism <strong>and</strong> alter travel patterns; <strong>and</strong>• Economic, political, <strong>and</strong> social instability in some coastal regions, which could inturn negatively affect tourism in these areas.<strong>Climate</strong> change impacts on tourism <strong>and</strong> recreation in coastal <strong>and</strong> other vulnerableareas will vary significantly according to region. For instance, some of Florida’s top touristattractions, including the Everglades <strong>and</strong> Florida Keys, are threatened by these challenges(Stanton & Ackerman, 2007). One recent study has estimated that lost tourismrevenue could total $9 billion by 2025 <strong>and</strong> $40 billion by 2050 (Stanton & Ackerman,2007). The effects of climate change on the tourism industry will not be exclusively negative.In Maine, coastal tourism actually could increase due to warmer summer months inwhich more individuals might visit the state’s beaches (Maine Department of EnvironmentalProtection, 2011).In 2010, the World Travel <strong>and</strong> Tourism Council (WTTC) released a report outlining acoordinated effort by the industry to address climate change. The report included someof the following recommendations for travel <strong>and</strong> tourism companies:• Develop <strong>and</strong> implement sustainable business practices;• Provide incentives for customers to reduce their energy usage;• Adopt environmental management systems to continually measure energyusage <strong>and</strong> greenhouse gas emissions; <strong>and</strong>• Encourage the investment community to develop financial products that areclosely linked to sustainable projects in the sector.
76 <strong>Coastal</strong> <strong>Impacts</strong>, <strong>Adaptation</strong>, <strong>and</strong> <strong>Vulnerabilities</strong>Real EstateSince 1980, 43 percent of single-family building permits <strong>and</strong> 51 percent of multi-familybuilding permits in the U.S. were issued in coastal counties (Crossett et al., 2004), whichis nearshore real estate that is susceptible to damages tied to sea-level rise <strong>and</strong> coastalstorms. The assessment of economic impacts associated with accelerated sea-level rise<strong>and</strong> increased storm intensity is an extension of shoreline-change modeling that hasbeen in effect since the 1980s with early studies at Galveston (Leatherman, 1984), OceanCity (Titus, 1985), Sea Bright New Jersey (Kyper & Sorenson, 1985), Charleston (Davidson& Kana, 1988), <strong>and</strong> Myrtle Beach (London & Volonte, 1991). An early effort to exp<strong>and</strong>to larger regional-scale assessments by the U.S. Environmental Protection Agencyentitled “Maps of L<strong>and</strong>s Vulnerable to Sea-level Rise” was developed to identify areasalong the Atlantic <strong>and</strong> Gulf coasts that are vulnerable to sea-level rise. At a 1.5 meter riseit was estimated that 58,000 square kilometers along the Atlantic <strong>and</strong> Gulf Coasts wouldbe inundated (Titus & Richman, 2001).A more recent interagency assessment entitled “<strong>Coastal</strong> Sensitivity to Sea-level rise:A Focus on the Mid-Atlantic Region” simulated a 1 meter sea-level rise across the regionrunning from New York through Virginia (CCSP, 2009a). The assessment estimated thata 1 meter sea-level rise would impact between 837,070 <strong>and</strong> 3,244,670 people in the region,assuming that the population is evenly distributed within the census units. A totalof between 439,480 <strong>and</strong> 1,769,710 owner- <strong>and</strong> renter-occupied houses would be affected<strong>and</strong> between 34,720 <strong>and</strong> 66,590 hectares of l<strong>and</strong> area would be inundated by a one metersea-level rise. The high <strong>and</strong> low estimates are attributed to uncertainty associated withdigital elevation maps that give a range of high <strong>and</strong> low elevations.The difficulty in assessing real estate damages on a larger regional scale is tied to thevariability in capturing both physical <strong>and</strong> socio-economic change at that scale. Averagingdamages across larger geographic areas is difficult because of regional-scale variationsin population density <strong>and</strong> property values <strong>and</strong> inconsistencies between countyassessment data. Studies must advance the geographic coverage beyond local case studiesto address state <strong>and</strong> regional policy issues.In Florida, studies by Stanton <strong>and</strong> Ackerman (2007) <strong>and</strong> Harrington <strong>and</strong> Walton(2007) estimate economic impacts of sea-level rise along the state’s coastline. The Stanton<strong>and</strong> Ackerman study estimates losses for the state as a whole with runs based on twoscenarios: 1) a business-as-usual scenario with a sea-level rise of 45 inches over the 2000baseline by the year 2100 <strong>and</strong> 2) a rapid stabilization scenario that assumes a 50 percentreduction in GHG emissions by the year 2050, which would result in a more modest seveninch sea-level rise. Incorporating trends from recent storm occurrences, Stanton <strong>and</strong>Ackerman estimate $24 billion <strong>and</strong> 18 deaths in the year 2050 under the rapid responsescenario <strong>and</strong> $49 billion in damages <strong>and</strong> 37 deaths in the business-as-usual scenario.The study by Harrington <strong>and</strong> Walton estimated impacts for six coastal counties:Dade, Dixie, Duval, Escambia, Monroe, <strong>and</strong> Wakulla. The low sea level scenario is basedon historical tidal gauge data ranging from 9.96 to 13.56 inches <strong>and</strong> a high scenario of upto 25.56 inches by the year 2080 based on IPCC high-end scenarios. The study estimatedthe value of l<strong>and</strong> at risk due to accelerated sea-level rise for three of the counties: Dade,Duval, <strong>and</strong> Escambia. $70 billion would be at risk in populous Dade County; in Duval<strong>and</strong> Escambia Counties, the property at risk is estimated to be worth $30.6 million <strong>and</strong>
Vulnerability <strong>and</strong> <strong>Impacts</strong> on Human Development 77$210.8 million, respectively. In terms of storm damage to property, the estimates in thesix counties range from $0.08 million to $2.90 billion, with the highest figure in DadeCounty.In California, a study of the economic cost of sea-level rise on selected communitiesby King, McGregor, <strong>and</strong> Whittet (2008) examines the implications of shoreline change<strong>and</strong> increased storm vulnerability for five coastal communities: Ocean Beach in SanFrancisco, Carpinteria City, Zuma <strong>and</strong> Broad Beach at Malibu, Venice Beach in Los Angeles,<strong>and</strong> Torrey Pines City <strong>and</strong> State Beach in San Diego. Sea-level rise scenarios of 1.0meter, 1.4 meters, <strong>and</strong> 2.0 meters by the year 2100 were simulated to estimate shorelineconfigurations <strong>and</strong> economic losses in each of the five communities. Baseline conditionswere established using elevation files as well as property boundaries <strong>and</strong> building footprintsfrom tax maps. Shoreline retreat was then simulated for each of the five case studyareas under each of the three sea-level rise scenarios.On top of the shoreline change scenarios, the second part of the analysis incorporatedstorm surge from coastal storms as sea-level rise makes coastal areas more vulnerableto storm damage by increasing the reach <strong>and</strong> depth of flooding. Under current conditions,populations, <strong>and</strong> building patterns, a 100-year storm would result in particularlyhigh losses at Ocean Beach ($6.5 million), Zuma Beach ($12.6 million), <strong>and</strong> Venice Beach($12.6 million) in 2010 dollars. Those losses increase by the year 2100 under the 1.4 metersea-level rise scenario to $ 19.6 million at Ocean Beach, $28.6 million at Zuma Beach, <strong>and</strong>$51.6 million at Venice Beach. Overall, losses to beachfront recreation as well as upl<strong>and</strong>property due both to shoreline retreat <strong>and</strong> increased storm damage along those stretchesof the California Coast amount to an estimated $100 billion over the next century.One of the methodological issues that arises from the California case for developingthis type of local impact assessment is the distortion of property values by new assessmentrules. In California, Proposition 13 was enacted to dampen the effect of escalatingproperty values in the state. As such, local tax rolls undervalue properties. True marketprices are reflected only where properties have been sold, which forces researchers toestimate true value. Other state property tax initiatives that may lead to a widening gapbetween current market value <strong>and</strong> the values shown on local tax rolls are just starting totake effect.A study by Bin, Dumas, <strong>and</strong> Poulter (2007) estimates the economic impact of climatechange on selected coastal communities in North Carolina from the baseline year 2004.Specific impacts include losses from sea-level rise on the coastal real-estate market, theimpacts of sea-level rise on coastal recreation <strong>and</strong> tourism, <strong>and</strong> the impacts of tropicalstorms <strong>and</strong> hurricanes on business activity.Inundation <strong>and</strong> storm impacts are assessed for four coastal counties ranging fromrural to urban in development intensity: New Hanover, Dare, Carteret, <strong>and</strong> Bertie. Thestudy used high-resolution topographic LIDAR data to establish baseline conditions<strong>and</strong> shoreline change under alternative sea-level-rise scenarios assuming no adaptation.The sea-level-rise scenarios are adjusted upward for regional subsidence <strong>and</strong> range froma 0.11 meter increase in sea level by 2030 to a 0.81 meter increase by 2080. Shorelinechange is superimposed on local assessor’s data at the parcel level including propertyvalue, lot size, building footprint, <strong>and</strong> other attributes. Elevation <strong>and</strong> distance to meansea level are calculated using GIS analysis (Bin et al., 2007).
78 <strong>Coastal</strong> <strong>Impacts</strong>, <strong>Adaptation</strong>, <strong>and</strong> <strong>Vulnerabilities</strong>In addition to inundation, the North Carolina study projected storm intensity basedon the track of Hurricane Fran, which hit the North Carolina coast in 1996. Storm intensitywas estimated based on increased sea-surface temperature <strong>and</strong> wind speeds mappedspatially using a hurricane-wind-speed model. Maximum wind speeds <strong>and</strong> wind gustswere averaged by county. A hedonic model was used to simulate the impacts of sealevelrise on property values for each of the four counties. The results vary across theNorth Carolina coastline with the largest impact occurring in Dare County where potentialresidential property losses ranged from 2-12 percent of the total residential propertyvalue. The property loss in Carteret County ranged from less than 1 percent to almost3 percent. In both New Hanover <strong>and</strong> Bertie Counties, losses were less than one percentof residential property value. In aggregate, the four counties that include the three mostpopulous counties on the coast account for $3.2 billion in lost residential property valuein 2080 discounted at 2 percent. The discounted present value of lost nonresidentialproperty value in 2080 was estimated at $3.7 billion.Information on the potential impact on local real estate provided in these case studiesis particularly useful in informing the public about current <strong>and</strong> projected vulnerabilitiesunder alternative sea-level-rise scenarios. Although the methodologies are similar, theassumptions on which the scenarios are based include:• Sea-level-rise scenarios;• Time frame of assessment;• Variability in property listings at county level;• Approach to assessing partial <strong>and</strong> full property loss;• Procedure for incorporating storm events: timing, flood <strong>and</strong> wind damage; <strong>and</strong>• Discounting of future losses to present value.Some methodological consistency in how assessments are prepared would providea basis to compare impacts across regions <strong>and</strong> help to aggregate results over larger geographicareas. Assessments to date have focused almost exclusively in a business-asusualframework. Future shoreline-change scenarios are overlaid on current real-estateholdings. Given that development continues in most coastal areas <strong>and</strong> certainly in highlydeveloped coastal areas, projected future losses may underestimate actual losses. Conversely,except for the rapid stabilization scenario in Florida by Stanton <strong>and</strong> Ackerman(2007), policy or market forces that reduce vulnerabilities over time are not incorporatedinto the analysis. A much-needed extension to the methodology is the incorporationof adapted response into the analysis including the impact of beach stabilization programs<strong>and</strong> retreat policies. In South Carolina, a recent study of shoreline change sincethe state’s Beachfront Management Act was implemented found that the state lost 1467acres along stretches of its shoreline. That loss was offset by a gain of 903 acres in moredeveloped areas of the shoreline including Myrtle Beach, North Myrtle Beach, KiawahIsl<strong>and</strong>, <strong>and</strong> Hilton Head (London et al., 2009). Differences in geomorphology mean thatresponses, as well as the strategies <strong>and</strong> management costs, will differ across beaches.In the face of retreating shorelines, communities that seek to minimize damages willneed to look to other adaptation measures that limit new development or encouragestrategic retreat. Those measures offer the potential to substantially reduce damages
Vulnerability <strong>and</strong> <strong>Impacts</strong> on Human Development 79to near shore real estate relative to the business as usual development patterns. Betterinformation of potential damages to coastal property, as well as figures on the costavoidance of alternative adaptation measures, will go a long way toward framing thenecessary dialogue on appropriate actions to address climate change in coastal regions.Private <strong>and</strong> Public InsuranceAnalyzing <strong>and</strong> underst<strong>and</strong>ing risks associated with climate change, particularly incoastal regions, can better inform the pricing, capital, <strong>and</strong> reserves that are critical tothe insurance industry’s core business strategies (Geneva Association, 2009). <strong>Climate</strong>implications also can play an important role in shaping the industry’s investment decisions.Incorporating climate risk into the insurance industry’s rate setting <strong>and</strong> investmentdecisions could send a strong price signal to other major industrial sectors; forinstance, imposing risk-based premiums for property construction in coastal regionscould both provide incentives for the adoption of flood-resilient measures <strong>and</strong> discouragesdevelopment in vulnerable areas. <strong>Climate</strong> change-related response strategies thatdo not include insurance solutions or discourage true risk-based pricing of insurancemechanisms have the potential to exacerbate societal exposure to climate change impactsin coastal regions.With regard to weather or climate-related risk in the U.S., the two principal categoriesof insurance in play are federal disaster relief programs such as the National FloodInsurance Program (NFIP) <strong>and</strong> traditional private insurance (Nichols & Bruch, 2008).Private insurance is largely categorized by the ex-ante financing structure by which premiumsare collected <strong>and</strong> managed in a pool in advance of predicted events in amountssufficient to pay for losses at the time of their occurrence. The U.S. International TradeCommission (2008: pg. 1) has described the purpose <strong>and</strong> value of private insurance asfollows:Property <strong>and</strong> Casualty (P&C) insurers manage risk by assessing the likelihood <strong>and</strong>cost of losses, pricing premiums sufficiently to cover all or part of predicted losses, <strong>and</strong>risk pooling. P&C insurers also provide economic incentives, in the form of lower premiums,to encourage policyholders to reduce their exposure to loss.The insurance <strong>and</strong> reinsurance industry have extensive experience in modeling, pricing,<strong>and</strong> managing risk, which can be important in developing a better underst<strong>and</strong>ing of <strong>and</strong>response to climate change risks faced by coastal communities (Nichols & Bruch, 2008).Insurance can aid coastal communities in becoming more resilient by protectingthem against risk from low-frequency, high-severity weather events (Swiss Re, 2010).Insurance reinforces risk-prevention measures by incentivizing investments in activitieswith net economic benefits <strong>and</strong> freeing up resources for other capital intensive investments.Insurance also can support the construction of climate adaptation infrastructurewith engineering covers <strong>and</strong> surety bonds as well as the widespread adaptation to thephysical risks resulting from climate change by supporting the deployment of buildingcode requirements <strong>and</strong> new technologies (Swiss Re, 2010). In these ways, private insurancecan play a valuable role in both the mitigation of <strong>and</strong> adaptation to climate-relatedrisk affecting coastal regions (Zurich Financial Services, 2009).
80 <strong>Coastal</strong> <strong>Impacts</strong>, <strong>Adaptation</strong>, <strong>and</strong> <strong>Vulnerabilities</strong><strong>Climate</strong> change has affected at least one core insurance industry assumption, whichis that underst<strong>and</strong>ing the past enables insurers to predict what will occur in the future.Although historically the past has served as a fairly reliable indicator of future eventswhen calculating the risks associated with insurance coverage in coastal <strong>and</strong> other regions,climate change has introduced new <strong>and</strong> uncertain risks into these calculations(Nichols & Bruch, 2008).Over the last two decades, weather-related losses for the industry steadily increased(Geneva Association, 2009); for instance, 2005 set a record for insured weather-relatedlosses of approximately $100 billion, largely attributable to Hurricanes Katrina, Rita, <strong>and</strong>Wilma. In 2010, weather-related losses totaled $130 billion, $37 billion of which was insured(Munich Re, 2011). These damages make 2010 one of the six most loss-intensiveyears for insurers over the last thirty years.According to NOAA’s National Climatic Data Center, the economic damage costsassociated with weather <strong>and</strong> climate disasters for 2011 totals approximately $55 billion.One major disaster that hit coastal areas particularly hard was Tropical Storm Lee. ThatSeptember 2011 storm inflicted wind <strong>and</strong> flood damage in both the U.S. Southeast <strong>and</strong>Northeast, with total losses exceeding $1.0 billion. Another 2011 disaster, HurricaneIrene, made l<strong>and</strong>fall over coastal North Carolina in August of 2011 <strong>and</strong> moved northwardalong the Mid-Atlantic Coast through North Carolina, Virginia, Maryl<strong>and</strong>, NewJersey, New York, Connecticut, Rhode Isl<strong>and</strong>, Massachusetts, <strong>and</strong> Vermont <strong>and</strong> causedtorrential rainfall <strong>and</strong> flooding across the Northeast. The cost of the damages from HurricaneIrene exceeded $7.3 billion.Where private insurance is not available to cover the full range of losses inflicted byextreme weather events in coastal regions, which is particularly the case when floodingis involved, government insurance programs like the National Flood Insurance Program(NFIP) often are called upon to make up the difference. The sheer magnitude of thelosses associated with Tropical Storm Lee <strong>and</strong> Hurricane Irene have had a significant,negative impact on the fiscal strength of the NFIP (Berkowitz, 2011). Congress continuesto work on a long-term reauthorization of the NFIP, which could provide significant reforms,including rate differentials for second homes, the phasing out of subsidized rates,<strong>and</strong> measures to incentivize policyholders to move out of floodplains.Private insurance companies have in some cases responded with financial strategiesto reduce risk in coastal areas, including by raising premiums, increasing deductibles,<strong>and</strong> sometimes limiting or discontinuing coverage (Nichols & Bruch, 2008). Other insurershave begun adapting their business models to account for the potential impacts ofclimate change by creating <strong>and</strong> delivering new products <strong>and</strong> services to customers <strong>and</strong>by working to identify <strong>and</strong> fill market <strong>and</strong> coverage gaps. The challenges facing the insuranceindustry include a need for convergence between sustainability <strong>and</strong> disaster resilience,greater engagement by insurers in adaptation to unavoidable climate changes,<strong>and</strong> clarification of the role that regulators will play in moving the market (Mills, 2009).Public Insurance. The largest government or public insurance programs includingthe NFIP, Florida Citizens Insurance, <strong>and</strong> Federal Emergency Management Agencyprograms are largely based upon ex-post financing structures planning to pay for lossafter the occurrence of an extreme weather event. As such, these kinds of financing programsoften place the risk <strong>and</strong> ultimate cost of loss with parties who have no control
Vulnerability <strong>and</strong> <strong>Impacts</strong> on Human Development 81over the creation or management of the risk or the recovery of damages caused by therisk. In some cases, the theory of the viability of ex-post financing is being challengedby the economic reality of the imbalance between the risk created, measured as loss-costrecovery <strong>and</strong> repayment needs, <strong>and</strong> the financial value <strong>and</strong> viability of the assets or impactedeconomies themselves (Scism, 2012).In addition to changes in the private-sector insurance market described above, climateconsiderations are also being evaluated by insurance programs that are underwrittenby the public sector. The U.S. Government Accountability Office (GAO, 2007)issued a report recommending that the Secretaries of Agriculture <strong>and</strong> Homel<strong>and</strong> Securityanalyze the potential, long-term fiscal implications of climate change for the FederalCrop Insurance Corporation’s (FCIC’s) crop-insurance program <strong>and</strong> for the NFIP,respectively. The FCIC report was completed by the Department of Agriculture’s RiskManagement Agency (USDA, 2010). An evaluation of the NFIP, which includes an examinationof the impacts of sea-level rise <strong>and</strong> changes in storm characteristics on coastalfloodplains, is nearing completion.At the state level, many coastal states have increased their participation in the insurancemarket as property owners in high-risk areas experience difficulty in obtaininginsurance in the regular private market. To make basic coverage more readily available,special insurance plans known as residual, shared, or involuntary markets havebeen set up by state regulators working with the insurance industry (Insurance InformationInstitute, 2012). Between 1990 <strong>and</strong> 2010, total exposure to loss in the national residualproperty insurance market, comprised of Fair Access to Insurance Requirements[FAIR] Plans, <strong>and</strong> state Beach <strong>and</strong> Windstorm Insurance Plans along the Atlantic <strong>and</strong>Gulf Coasts, increased from $54.7 billion to $757.9 billion, while the number of policiesin force increased from more than 930,000 to 2.8 million (Insurance Information Institute,2012). In terms of existing exposure to impacts of extreme events, which do notinclude increased risks associated with climate change, many state insurance programsare not prepared to cover expected losses. Of 10 state natural-disaster funds investigatedby GAO (2010), six charged rates that were not actuarially sound given today’s knownrisks. With climate change expected to increase losses associated with coastal storms<strong>and</strong> sea-level rise, the financial risks borne by the public sector through these residualprograms may, in fact, be much worse.The current situation in Florida exemplifies this concern. Citizens Property InsuranceCorp. (CPIC), for example, has 1.5 million policyholders <strong>and</strong> a total exposure of $511billion, which is about one-quarter of the Florida homeowners’ insurance market. TheFlorida Hurricane Catastrophe Fund would be required to reimburse insurers operatingin the state up to $18.4 billion in the event of losses from major storms, despite havingonly about $7 billion on its books from accumulated premiums. Observers are concernedthat, following a major hurricane, some insurers could become insolvent, homeownerrepair claims could go unpaid, <strong>and</strong> assessments <strong>and</strong> surcharges on policyholders statewidecould damage the economy if these two entities were unable to sell post-disasterbonds as planned (Scism, 2012).At both the state <strong>and</strong> federal levels, some stakeholders have proposed granting theseentities greater authority to raise insurance rates. Current legislative proposals relatingto the NFIP, for example, would increase the annual limitation on premium increasefrom the current 10 percent level to either 15 percent or 20 percent (U.S. Congress, 2011,
82 <strong>Coastal</strong> <strong>Impacts</strong>, <strong>Adaptation</strong>, <strong>and</strong> <strong>Vulnerabilities</strong>H.R. 1309, proposed). Other measures being explored at the state level include seekingto reduce the size of state disaster-relief funds <strong>and</strong> move more of the funding for lossesto the global reinsurance market (Scism, 2012). Risk can be moved to the global reinsurancemarket for a price that reflects the risk. As such, moving from public funding thatmay subsidize risk takers to private insurance will likely require adaptive steps to increaseresilience of the insured assets to have socially accepted premiums.Historic experience in the insurance industry has shown that subsidies, as contrastedwith rights <strong>and</strong> liability creation, can result in business models that contain an unacceptablelevel of political risk (Cato Institute, 2001; Green, 2011). Subsidies may actuallydiscourage active participation by the financial-services industry in innovative <strong>and</strong>beneficial activities unless the business or technology supported can survive without thesubsidy (Zurich Financial Services, 2009).Zurich Financial Services (2009) concluded that incentives to individually managerisk are undercut by public disaster-relief schemes that are overly broad or significantlyunderprice risks. The prevalence of such schemes may undermine the viability of a privateinsurance market <strong>and</strong> force governments to take on an above-optimal amount ofrisk (Scism, 2012).Emergency Response, Recovery, <strong>and</strong> Vulnerability ReductionAs discussed in Chapter 2, climate change can influence both slow-onset <strong>and</strong> acute naturalhazards, including sea-level rise, coastal-storm flooding, melting permafrost <strong>and</strong>coastal erosion, severe rainfall events <strong>and</strong> flooding, l<strong>and</strong>slides, <strong>and</strong> drought, includingrelated wildfires <strong>and</strong> post-fire floods. Although disasters triggered by extreme weatherevents are disruptive to coastal communities <strong>and</strong> economies, disaster recovery oftenprovides the greatest opportunities for communities to garner the necessary politicalwill <strong>and</strong> sufficient funding to implement actions that will reduce their long-term vulnerabilityto today’s hazards <strong>and</strong> the additional threats posed by climate change.Economic losses resulting from natural disasters worldwide increased from $53.6 billionin the 1950s to $620.6 billion between 2000 <strong>and</strong> 2008, adjusted for inflation (Kunreuther& Michel-Kerjan, 2009a). In 2011, the U.S. experienced 12 disasters exceeding $1billion in losses (NOAA, 2011). As discussed in the earlier sections of this chapter, thedramatic increase in disaster costs reflects a combination of factors including increasesin the urbanization of the population <strong>and</strong> the value at risk <strong>and</strong> density of insurancecoverage as well as possible impacts of global warming on the frequency or severity ofhurricanes (Kunreuther & Michel-Kerjan, 2009b).<strong>Climate</strong> change has significant implications for many aspects of emergency management<strong>and</strong> each phase of the disaster lifecycle (Box 4-2). A recent national evaluation of localdisaster-risk-reduction plans shows that risk assessment findings are not effectivelydriving the development of policies or the identification of projects intended to reducevulnerabilities (Berke et al., in press). Further, the ability to effectively link disaster-riskreduction <strong>and</strong> climate change adaptation remains in the early stages of development.More data are needed to demonstrate the return on investment associated with incorporatingclimate impacts into the planning, design, <strong>and</strong> implementation of long-termrisk-reduction measures, including data on losses avoided <strong>and</strong> social, economic, <strong>and</strong>environmental benefits.
Vulnerability <strong>and</strong> <strong>Impacts</strong> on Human Development 83Box 4-2The Disaster LifecycleDuring discrete weather-related events <strong>and</strong> emergencies,climate change affects disaster preparedness,response, <strong>and</strong> recovery actions. One of themost immediate <strong>and</strong> direct economic impacts ofclimate-related changes in extreme events is inthe form of increased financial burden on governments,businesses, <strong>and</strong> individuals to react to <strong>and</strong>respond more frequently. The Federal government,states, <strong>and</strong> communities incur substantialcosts when activating emergency operations <strong>and</strong>services, including immediate pre-event preparednessactions such as evacuations <strong>and</strong> flood fighting.Evacuation estimates for the NortheasternU.S. related to sea-level rise <strong>and</strong> storm floodingduring a single event range from $2 billion to $6.5billion (Univ. of Maryl<strong>and</strong> CIER, 2007). Hurricaneevacuation costs for ocean counties in North Carolinarange from $1 to $50 million, depending onstorm intensity <strong>and</strong> emergency management policy(Whitehead, 2000). <strong>Climate</strong> change is expectedto double combined state <strong>and</strong> Federal costs for firepreparedness <strong>and</strong> response activities in WashingtonState from a historical average of $62 millionannually to $124 million (Washington Departmentof Ecology, 2006).
84 <strong>Coastal</strong> <strong>Impacts</strong>, <strong>Adaptation</strong>, <strong>and</strong> <strong>Vulnerabilities</strong>During disasters, states <strong>and</strong> municipalities rely extensively on mutual aid agreementswith other jurisdictions, spreading the financial footprint of extreme weather events farbeyond the directly impacted communities. With more frequent events, communitieshave a greater likelihood of having to respond to multiple events simultaneously, overtaxingthese mutual-aid agreements <strong>and</strong> other emergency-response systems <strong>and</strong> funding(Washington Department of Ecology, 2006).Recovery from weather-related extreme events, including those exacerbated by climatechange, is a complicated, long-term process involving virtually every aspect of acommunity’s social <strong>and</strong> economic fabric (see section 4.2). As with response, more intense<strong>and</strong>/or frequent events will lead to more damages <strong>and</strong> thus require more resourcesfor recovery, which will divert those resources from other community functions <strong>and</strong> potentiallystifle economic growth. For example, although the construction sector benefitsfrom engagement in post-disaster rebuilding, the funds <strong>and</strong> workers supporting reconstructionare not available to new-building <strong>and</strong> infrastructure projects, limiting the communityor state’s economic growth potential (University of Maryl<strong>and</strong>, 2007). Althoughinsurance is a vital resource to fund recovery from disasters (see Section 4.4.6), it doesnot cover all losses; the balance is borne by the public sector at Federal, state, <strong>and</strong> locallevels, the private sector, <strong>and</strong> individuals.<strong>Coastal</strong> <strong>and</strong> Nearshore Oil <strong>and</strong> GasAs climate change intensifies during the coming decades, changes in marine <strong>and</strong> coastalsystems are likely to affect the potential for energy resource development in the coastalzone <strong>and</strong> the Outer Continental Shelf (OCS). The capacity for exp<strong>and</strong>ing <strong>and</strong> maintainingonshore <strong>and</strong> offshore support facilities <strong>and</strong> transportation networks is also likely tobe affected. The relative importance of climate variables <strong>and</strong> impacts to the energy sectorwill vary among regions <strong>and</strong> the context in which they are considered, <strong>and</strong> perspectiveson the relative importance of climate change impacts will differ among those whoare responsible for developing adaptation strategies in sectors ranging from industry toregulatory (Burkett, 2011).In this section we summarize the potential energy-sector impacts <strong>and</strong> adaptation effortswith respect to the following climate drivers: temperature change, sea-level rise,<strong>and</strong> changes in storm surge <strong>and</strong> wave patterns. <strong>Climate</strong> change impacts can cascadeamong different oil <strong>and</strong> gas facilities <strong>and</strong> operations from exploration to processing <strong>and</strong>transportation in a way that is similar to the cascading effects that have been observed inmany ecosystems with interactions <strong>and</strong> outcomes that are difficult to predict without apurposeful assessment that considers all relevant drivers (Burkett, 2011).Warming of the ocean can propagate into seafloor sediments. Methane clathrates occuron the continental shelf both in deep sedimentary structures <strong>and</strong> as outcrops on theocean floor. They are common in relatively shallow shelf sediments of the Arctic Ocean<strong>and</strong> the Gulf of Mexico continental slope. The stability of methane clathrate in marinesediments is controlled by the combination of pressure <strong>and</strong> temperature. Seafloor carbonatedeposits reveal several ancient hydrate dissociation events that appear to haveoccurred in connection with rapid global warming events (Archer, 2007; Dickens, 2001;Sassen et al., 2002). Clathrate instability may lead to problems for oil <strong>and</strong> gas exploration<strong>and</strong> development operations ranging from pipeline emplacement to the anchoring of
Vulnerability <strong>and</strong> <strong>Impacts</strong> on Human Development 85drilling facilities.The influence of rising temperatures on the rate of sea-ice decline <strong>and</strong> the thawing ofpermafrost in the Arctic coastal zone are likely to result in a number of impacts on theenergy sector, including:• Longer ice-free season for OCS exploration <strong>and</strong> production activities;• Opening up of navigation routes through the Northwest <strong>and</strong> NortheastPassages, even if ice simply thins to the point that shipping lanes can bemechanically maintained by icebreakers (Valsson et al., 2011);• Decline in the availability of ice-based transportation such as ice roads <strong>and</strong>offshore loading facilities;• Frost heave <strong>and</strong> settlement of pipelines set on pilings or buried in permafrost;• Settlement of buildings set on piles or foundations laid directly upon permafrostor a decrease in load-bearing capacity of such structures;• Rapid, widespread environmental impacts could have substantial effects on theregulatory environment for OCS energy development (Ahmad et al., 2009);• Damage to onshore support facilities, waste-disposal sites, <strong>and</strong> roads as coastalerosion <strong>and</strong> l<strong>and</strong> loss accelerates (Mars & Houseknect, 2007; Prowse et al.,2009); <strong>and</strong>• Hazards associated with the formation of thermokarst lakes in the coastal zone<strong>and</strong> the stability of shelf <strong>and</strong> slope sediments due to thawing ice in sediments<strong>and</strong> the release of gas from clathrates (Figure 4-2).Alternate waste-disposal practices in the Arctic, including down-hole injection ortransportation of waste to more stable environments, are among the adaptations thatcould offset impacts <strong>and</strong> allow continued energy-resource development (Burkett, 2011).Several other adaptation strategies to the impacts of temperature change on Arctic explorationhave been proposed; for example, recent exploratory drilling in the BeaufortSea suggests that decreasing sea-ice cover may require design changes to counter effectsof increased wave action <strong>and</strong> storm surges. The use of barges for production, rather thana l<strong>and</strong>-based facility, has been proposed for the Canadian coast (Prowse et al., 2009).Domestic offshore <strong>and</strong> inshore oil <strong>and</strong> gas facilities are vulnerable to accelerated sealevelrise due largely to the fact that the more than 4000 platforms <strong>and</strong> onshore supportfacilities that have been installed on the OCS in the Gulf of Mexico <strong>and</strong> along the westerncoast of the U.S. were not generally designed to accommodate a permanent increasein mean sea level or an increase in storm intensity. Relative sea-level rise (see Chapter 2),poses the greatest danger to the dense network of OCS marine <strong>and</strong> coastal facilities inthe central Gulf Coast region between Mobile Bay, AL <strong>and</strong> Galveston, TX. These facilitiesinclude ports, marinas, <strong>and</strong> OCS industry-support facilities such as tank batteries<strong>and</strong> gas-processing plants. An increase in relative sea level of 61 centimeters has the potentialto affect 64 percent of the region’s port facilities; a 122 centimeter rise in relativesea level would affect nearly three-quarters of port facilities (CCSP, 2008).Hurricanes have been shown to have substantial <strong>and</strong> costly impacts on offshoreplatforms in the Gulf of Mexico. Storm surge effects include flooding <strong>and</strong> structural
86 <strong>Coastal</strong> <strong>Impacts</strong>, <strong>Adaptation</strong>, <strong>and</strong> <strong>Vulnerabilities</strong>Figure 4-2 Increase in the rate of coastal erosion <strong>and</strong> thermokarst lake development along the NorthCoast of Alaska between 1955-1985 <strong>and</strong> 1985-2005. Source: Mars & Houseknect, 2007.damages to drilling <strong>and</strong> production platforms as well as onshore support facilities. HurricanesKatrina <strong>and</strong> Rita made l<strong>and</strong>fall in the central Gulf Coast in 2005, shutting downhundreds of oil-drilling <strong>and</strong> production platforms, eight refineries, <strong>and</strong> many otheronshore oil <strong>and</strong> gas facilities (CCSP, 2008). The storms also caused a record numberof mobile offshore-drilling units to be set adrift. Subsequent to the 2005 hurricane season,changes were proposed in regulatory operating <strong>and</strong> emergency procedures, maintenancerequirements, <strong>and</strong> design practices, including mooring techniques for mobileoffshore-drilling units (Cruz & Krausmann, 2008).The oil <strong>and</strong> gas industry is investigating new designs for offshore platforms to reducethe potential impacts of changing storm patterns <strong>and</strong> hurricanes. Technologiessuch as computational fluid dynamics are being used to evaluate the performance ofoffshore platforms under extreme operating conditions. Computational fluid dynamicshas been used by some oil <strong>and</strong> gas companies to simulate storm surge, aerodynamiceffect of winds, <strong>and</strong> hydrodynamic effect of waves on platforms using super-computertechnology (Ferguson, 2007).Storm surge <strong>and</strong> high winds historically have not had much impact on U.S. onshoretransmission lines or offshore pipelines because they are buried underground (CCSP,
Vulnerability <strong>and</strong> <strong>Impacts</strong> on Human Development 872008); however, offshore pipelines were damaged in relatively large numbers duringHurricanes Andrew, Ivan, <strong>and</strong> Katrina. Hurricane Andrew damaged more than 480pipelines <strong>and</strong> flow lines, most of which were in less than 30 meters of water. HurricaneIvan resulted in approximately 168 pipeline damage reports, although the vast majorityof Gulf of Mexico offshore pipelines performed well during its passage. The Bureauof Ocean Energy Management, formerly known as the U.S. Minerals Management Service,indicates that 457 offshore oil <strong>and</strong> gas pipelines were damaged as a result of HurricanesKatrina <strong>and</strong> Rita (CCSP, 2008). Examples of the potential effects of increasingwave heights <strong>and</strong> storm surge on energy-related operations in the OCS <strong>and</strong> coastal zoneinclude:• Damage to offshore <strong>and</strong> coastal drilling <strong>and</strong> production platforms as well asonshore support facilities due to higher surge, winds, <strong>and</strong> waves;• Wave energy impacts on transportation infrastructure such as bridge decks <strong>and</strong>supports; <strong>and</strong>• Pipeline exposure <strong>and</strong> damage.4.4 Human Health <strong>Impacts</strong> <strong>and</strong> Implications<strong>Climate</strong>-driven changes in temperature, precipitation, sea level, <strong>and</strong> the hydrologic cycleaffect coastal-related human health <strong>and</strong> well-being. Direct health impacts <strong>and</strong> risksare those resulting from the climate-related environmental exposure itself, which includeextreme weather events. Indirect health impacts <strong>and</strong> risks result from exposure toclimate-driven changes in ecological systems <strong>and</strong> habitats, which in turn affect humanhealth <strong>and</strong> well-being. Both direct <strong>and</strong> indirect pathways affect health <strong>and</strong> well-beingacross time scales from days to decades <strong>and</strong> depend on complex interactions among <strong>and</strong>between environmental exposures, human-risk factors, social behavior, <strong>and</strong> the cultural,economic, <strong>and</strong> political contexts (Frumkin, 2008; Portier, 2010).• Direct climate-related changes that affect coastal health outcomes includeextreme weather events such as heat <strong>and</strong> cold extremes; drought <strong>and</strong> flooding;hurricanes, cyclones, <strong>and</strong> tropical storms; <strong>and</strong> sea-level rise <strong>and</strong> storm surges.Health outcomes include changes in heat-related illness <strong>and</strong> death; illness <strong>and</strong>injury during drought; flood or emergency response; injury <strong>and</strong> death fromhurricane, cyclones, sea level, <strong>and</strong> storm surge directly; <strong>and</strong> related impacts onfood supply <strong>and</strong> mental health during <strong>and</strong> after an emergency evacuation orextreme weather event.• Indirect climate-related changes that affect coastal health outcomes includechanges in coastal water temperature, quality, <strong>and</strong> chemistry; coastal watershedrunoff; coastal habitats <strong>and</strong> species; <strong>and</strong> l<strong>and</strong>-use patterns. These can lead toecologically mediated health risks such as water-borne illnesses, vector-bornedisease, <strong>and</strong> altered availability <strong>and</strong> quality of the coastal food supply. In additionto these health outcomes, long-term changes can affect livelihoods, communitystructures, <strong>and</strong> aesthetic values, which can affect the local <strong>and</strong> regionaleconomies <strong>and</strong> community resilience in turn.
88 <strong>Coastal</strong> <strong>Impacts</strong>, <strong>Adaptation</strong>, <strong>and</strong> <strong>Vulnerabilities</strong>Underpinning the extent of the human health impact of climate change are the socialstructure, which could include close family or community ties; the cultural context,which includes socio-economic status, cultural traditions, family <strong>and</strong> communitydynamics, gender, <strong>and</strong> religion; <strong>and</strong> the economic <strong>and</strong> political context, which includepopulation demographics, <strong>and</strong> the roles of community <strong>and</strong> political leaders. In additionto long-term oceanographic <strong>and</strong> biological data, social <strong>and</strong> public health data includingemergency room visits, reported illnesses, recreational usage of beaches <strong>and</strong> coastalwaters, livelihood <strong>and</strong> economic growth data, <strong>and</strong> household income is needed. The followingdiscussion outlines the potential direct <strong>and</strong> indirect environmentally mediatedimpacts of climate change on human health <strong>and</strong> well-being as well as sentinel species<strong>and</strong> habitats that can serve as integrative indicators of ecosystem level risks to humanhealth.Direct <strong>Impacts</strong>Heat <strong>and</strong> HEAT WAVES. Health outcomes from increasingly frequent <strong>and</strong> severeheat events include heat exhaustion, heat stroke, severe cramps, <strong>and</strong> death. Exposureto increased average temperatures alone may exacerbate pre-existing conditions relatedto chronic respiratory, neurological, or cardiovascular diseases (Luber, 2008). Duringthe 2006 California heat wave, over 160 Californians died, <strong>and</strong> 16,166 excess emergencyroom visits <strong>and</strong> 1,182 excess hospitalizations occurred statewide. Children aged 0-4years of age <strong>and</strong> adults over 65 years of age were at greatest risk. Emergency room visitsalso showed significant increases for acute renal failure, cardiovascular diseases, diabetes,electrolyte imbalance, <strong>and</strong> nephritis (Knowlton, 2006). Chronically ill individuals 65<strong>and</strong> older are more susceptible to heat effects than the general population. As coastalpopulations increase, <strong>and</strong> the demographics include higher risk populations, the healtheffects from prolonged heat exposure can be expected to increase as well. This is welldemonstrated in coastal urban environments such as New York City, but additional researchis needed to further differentiate expected impacts specifically in coastal environments(Knowlton et al., 2008).Drought <strong>and</strong> FLOOD. In a recent report, the CDC (2010) noted that drought effectscan be manifested in a number of health-related impacts including compromised quality<strong>and</strong> quantity of potable water <strong>and</strong> food, diminished living conditions, increased risksassociated with recreation, impacts to mental health, increased incidence of disease,<strong>and</strong> additional stress on vulnerable populations. In addition, drought leads to parchedhabitats, <strong>and</strong> some coastal areas may be more prone to forest fires, which can exacerbateasthma <strong>and</strong> other aero-allergenic <strong>and</strong> respiratory diseases. In addition to the impacts tohuman development discussed in the preceding sections, flooding events pose the directrisk of death. Longer term human health impacts are related to infrastructure--ensuringthat hospitals <strong>and</strong> urgent care facilities are accessible to the local population during extremeevents, that evacuation plans are in place <strong>and</strong> successfully communicated, <strong>and</strong>that emergency personnel <strong>and</strong> first responders are prepared.Hurricanes <strong>and</strong> STORM Surge. <strong>Coastal</strong> storm-related health outcomes includechanges in heat-related illness <strong>and</strong> death, injury <strong>and</strong> death from hurricane <strong>and</strong> storm
Vulnerability <strong>and</strong> <strong>Impacts</strong> on Human Development 89surge directly, illness <strong>and</strong> injury during emergency response, <strong>and</strong> mental health effectsduring <strong>and</strong> after an emergency evacuation or other extreme weather events. Longertermhealth implications include potential effects on mental health <strong>and</strong> food supply.Hurricanes <strong>and</strong> floods can lead to st<strong>and</strong>ing water <strong>and</strong> accumulated debris that createnew habitats for mosquitoes <strong>and</strong> other disease-carrying agents like rats or roaches thathumans had less exposure to <strong>and</strong> that were not abundant in that ecosystem before. Illnessalso increases in extreme situations in which local populations have to be housedin large, temporary-living spaces such as the Superdome during <strong>and</strong> after HurricaneKatrina. Existing water sanitation <strong>and</strong> hygiene systems are not generally designed toprovide clean water <strong>and</strong> h<strong>and</strong>le waste under these circumstances. Given the chaos, disruption,dislocation, potential unemployment, <strong>and</strong> general uncertainty during extremeclimatic events, a potential longer-term impact is an increase in mental-health issuesassociated with natural disasters <strong>and</strong> other sources of dislocation, unemployment, orforced migration (Berry, 2010; Portier, 2010).After hurricanes <strong>and</strong> floods, a lack of confidence in fish <strong>and</strong> coastal food supply canaffect both health <strong>and</strong> economic interests. After Hurricane Katrina, consumers had ahard time believing that Gulf of Mexico seafood was safe to eat even though extensivesampling <strong>and</strong> chemical analysis showed that was the case (Hom et al., 2008). A lack ofconsumer confidence in fish <strong>and</strong> food from the sea, such as in the aftermath of HurricaneKatrina, has both human health <strong>and</strong> economic consequences (see S<strong>and</strong>ifer et al., 2012 formore details). Ensuring access to safe food supply from the sea necessitates establishingbaselines <strong>and</strong> trustworthy monitoring <strong>and</strong> evaluation <strong>and</strong> communication tools, especiallyas our habitats <strong>and</strong> ecosystems are impacted by more frequent or severe events.Indirect <strong>Impacts</strong>Water-RELATED ILLNESS. Human-health risks include changes in the concentration,distribution, or virulence of pathogens, biological toxins, <strong>and</strong> chemical contaminantsin our coastal waters. These can directly impact recreational use; drinking-waterquality: the quantity <strong>and</strong> quality of the food supply from coastal waters <strong>and</strong> wetl<strong>and</strong>s;the economic productivity <strong>and</strong> livelihoods of fisheries, tourism, <strong>and</strong> real estate; <strong>and</strong> aesthetic<strong>and</strong> cultural use (Portier, 2010).Pathogens. The capacity of water sanitation <strong>and</strong> hygiene infrastructure is an importantdeterminant of climate-related human-health impacts; for example, combinedsewer overflows (CSOs) occur when rainwater runoff, domestic sewage, <strong>and</strong> industrialwastewater that are collected in the same pipe overflow during heavy precipitation orstorm surge events. Runoff during CSOs can contain pathogen <strong>and</strong> chemical contaminantsthat end up directly in our coastal waters (Fong, 2010). In addition, livestock <strong>and</strong>agricultural feedlots are known sources of coastal pollution that directly affect coastalwater quality <strong>and</strong> recreational use. Water sanitation facilities are another source of pollutant.If the intensity of rainfall or flooding events are expected to increase, then coastalpollution from these sources can be expected to increase as well unless management <strong>and</strong>infrastructure changes are made.Over 40 million Americans in approximately 772 cities rely on combined sewer systemsfor stormwater <strong>and</strong> snowpack runoff as well as untreated domestic <strong>and</strong> industrial
90 <strong>Coastal</strong> <strong>Impacts</strong>, <strong>Adaptation</strong>, <strong>and</strong> <strong>Vulnerabilities</strong>waste management (EPA, 2011). In the Great Lakes, extreme precipitation events mayoverwhelm the combined sewer systems <strong>and</strong> lead to overflow events that can threatenboth human health <strong>and</strong> recreation in the region. Projected increases in heavy rainfall<strong>and</strong> lake water temperatures, in addition to decreased lake levels, would all be expectedto contribute to beach contamination in the future (McLellan, 2007; Patz, 2008).Biological Toxins. Certain species of marine algae are considered harmful, eitherthrough direct consumption or inhalation of aerosolized biological toxins like those thatoccur during Red Tide events in Florida. Harmful algal blooms (HABs) are increasingin frequency, intensity, <strong>and</strong> duration in freshwater <strong>and</strong> marine environments globally(Gilbert, 2005; van Dolah, 2000). The role of climate change in this expansion is unclear<strong>and</strong> the physical <strong>and</strong> biological ocean interactions are extremely complex, but currentresearch indicates that: 1) the range expansion of warm-water species occurs at the expenseof cold-water species that are driven poleward; 2) the seasonal window of growthof some species will increase, leading to earlier <strong>and</strong>, possibly longer <strong>and</strong> more intenseblooms; 3) these changes in the timing <strong>and</strong> location of blooms will have secondary effectsfor marine food webs <strong>and</strong> the transfer of toxins through marine food webs (Hallegraeff,2010). A growing body of literature suggests that the geographic incidence,frequency, <strong>and</strong> intensity of harmful algal blooms are likely to increase in the future as aresult of an anthropogenically changing climate (Moore et al., 2008, 2010, 2011). In thePuget Sound, sea-surface temperatures affect the timing <strong>and</strong> onset of certain harmfulalgae. The window of opportunity for harmful blooms of Alex<strong>and</strong>rium canenella, whichcauses paralytic shellfish poisoning, is likely to shift by up to two months over the nextten years based on climate-driven changes in the coastal ecosystem (Moore, 2010, 2011).Some effects may be seen within the next 30 years <strong>and</strong> perhaps as early as the next decade(Moore et al., 2011). Underst<strong>and</strong>ing algae <strong>and</strong> related biotoxin production will leadto better predictions of risks related to climate change (Moore, 2008).Chemical CONTAMINANTS. Alterations in the timing <strong>and</strong> intensity of storm eventsassociated with climate change are expected to deliver different, <strong>and</strong> in many cases, increasedloadings of chemical contaminants to surface waters (Kundzewicz et al., 2009).These contaminants will be transported downstream <strong>and</strong> enter coastal ecosystems wherethey can be taken up by marine fish <strong>and</strong> shellfish <strong>and</strong> both directly <strong>and</strong> indirectly affectson human health <strong>and</strong> well-being. Dickhoff <strong>and</strong> others (2007) describe many direct risksto human health posed by chemical contamination of seafood. These risks come primarilyfrom persistent <strong>and</strong> bioaccumulative substances such as polychlorinated biphenyls<strong>and</strong> methylmercury. In addition, the presence of contamination can often result in regulatory<strong>and</strong> advisory actions aimed at reducing consumption of seafood from affectedcoastal areas. Because consumption of seafood is generally believed to confer substantialhuman-health benefits, reduced human consumption of seafood presumably has anegative, indirect effect on human health (Dickhoff et al., 2007).Vector-Borne <strong>and</strong> ZOONOTIC DISEASE (VBZD). The incidence of VBZD in theU.S. will likely increase under anticipated climate change scenarios. Efficient vector <strong>and</strong>reservoir life cycles <strong>and</strong> transmission dynamics depend on optimal temperatures, humiditylevels, <strong>and</strong> habitats, including coastal waters <strong>and</strong> shoreline habitats. Changes in
Vulnerability <strong>and</strong> <strong>Impacts</strong> on Human Development 91precipitation, temperature, <strong>and</strong> humidity will shift habitats that allow insect <strong>and</strong> animalvectors to survive <strong>and</strong> transmit disease in new, previously unsuitable areas. <strong>Coastal</strong><strong>and</strong> marine changes will affect ocean <strong>and</strong> coastal ecosystems by influencing communitystructure, biodiversity, <strong>and</strong> the growth, survival, persistence, distribution, transmission,<strong>and</strong> severity of disease-causing organisms, vectors, <strong>and</strong> marine <strong>and</strong> terrestrial animalreservoirs (CDC, 2009).Changes in climate will affect the habitat, reproduction rates, <strong>and</strong> transmission dynamicsfor: mosquitoes that carry malaria, yellow fever, <strong>and</strong> dengue; ticks that carryLyme disease; <strong>and</strong> rodents that carry a variety of diseases such as those related to HantaVirus <strong>and</strong> plague. As the habitats for these disease vectors are expected to shift northward,so too does the disease risk (Portier et al., 2010). The range of mosquito vectorsis expected to shift northward with warmer temperatures <strong>and</strong> humidity, coupled withchanges in coastal habitats <strong>and</strong> sea level. For instance, the habitat for two malaria vectors,Anopheles albimanus <strong>and</strong> Anopheles pseudopunctipennis, which is currently restrictedto warmer climates, will exp<strong>and</strong> northward into the U.S., but extreme conditions suchas prolonged drought or excessively elevated temperatures can also bring that cycle to astop <strong>and</strong> reduce risk in those areas. With the loss of predators, which changes predatorpreyrelationships, insect <strong>and</strong> marine <strong>and</strong> terrestrial animal vectors <strong>and</strong> reservoirs mayincrease or shift their range, which would necessitate either chemical or mechanical controls(CDC, 2009).How much the recent dengue outbreaks in the U.S. are related to climate variabilityis unclear, but climate is likely one of the drivers (CDC, 2012). Similarly, the role ofmarine animals in zoonotic transmission under changing climate regimes is not well understood(Portier, 2010). A lack of underst<strong>and</strong>ing of these complex VBZD transmissiondynamics makes predicting climate-related changes difficult (CDC, 2009).Food <strong>and</strong> NUTRITION. <strong>Climate</strong> also poses several direct human-health risks specificallyassociated with food from oceans <strong>and</strong> estuaries from consumption of contaminatedfood, decreased nutritional value of compromised or stressed food, lack of availabilityor change of access to food, which will be especially impactful for subsistence-food animals(Portier et al., 2010). <strong>Climate</strong> change is expected to impair seafood safety throughchanges in chemical <strong>and</strong> biological risks; in particular, toxic metals, organic chemicalsresidues, algal toxins <strong>and</strong> pathogens of both humans <strong>and</strong> marine organisms (Marques,2010). <strong>Climate</strong> change may lead to changes the occurrence of Vibrio species, a type ofbacteria ubiquitous in the marine environment, some of which can cause cholera, gastrointestinalillness, <strong>and</strong> serious, if not fatal, wound infections. Vibrio outbreaks have beenrelated to changes in water temperature <strong>and</strong> changes in salinity (Colwell ,2008; Emch,2008; Johnson, 2010; Turner, 2009) <strong>and</strong> can be monitored <strong>and</strong> predicted with a combinationof in-situ <strong>and</strong> satellite observations (Blackwell, 2008; Phillips, 2007).The abundance <strong>and</strong> distribution of fish stocks are known to change as water temperatures<strong>and</strong> circulation patterns change. This affects human health directly in termsof available protein as well as economic productivity <strong>and</strong> cultural or tribal aspects ofcoastal-community health. In addition, little is known about the changes in nutritionalquality or health of the fish as related to climate (Portier et al., 2010).Sentinel HABITATS <strong>and</strong> SPECIES. Key habitats <strong>and</strong> certain marine mammals can
92 <strong>Coastal</strong> <strong>Impacts</strong>, <strong>Adaptation</strong>, <strong>and</strong> <strong>Vulnerabilities</strong>signal climate-related change in coastal conditions that can affect human health (Bossart,2011; Rose, 2009). Sentinel marine mammals can serve as integrative integrators of human-healthrisks; for instance, domoic acid (DA) exposure <strong>and</strong> related str<strong>and</strong>ing <strong>and</strong>health risks in sea lions off the coast of California provide insight into human-healthrisks of DA exposure (Goldstein, 2009). Information from monitoring sentinel tidalcreeks can demonstrate the need for screening of shellfish <strong>and</strong> other seafood for biotoxins,pathogens, or chemical pollutants (Garner, 2009).In summary, the impacts on human health <strong>and</strong> well-being are complicated, are mediatedby our individual- <strong>and</strong> social-behavioral constructs, <strong>and</strong> must be considered inthe larger social, political, <strong>and</strong> cultural context. Although scientific advances in this fieldare being made, they are slow, incremental, <strong>and</strong> insufficient in size, scope, <strong>and</strong> durationto inform the science <strong>and</strong> policy choices that lie ahead. This is due in large part to thelong-term nature <strong>and</strong> extent of the research collaborations required as well as the lack ofsustained assistance, which should include the collection <strong>and</strong> maintenance of long-termphysical, biological, <strong>and</strong> public health data that can be used for monitoring <strong>and</strong> researchto give us early warning indications <strong>and</strong> inform longer-term risk predictions (Jochens,2010; Portier, 2010).4.5: Implications for <strong>Coastal</strong> Military Installations <strong>and</strong> Readiness<strong>Climate</strong>-related changes in global <strong>and</strong> regional temperatures, precipitation patterns, <strong>and</strong>sea level, as well as increasing coastal storm extremes <strong>and</strong> extended polar ice melt seasons,can impact Department of Defense (DoD) coastal installations <strong>and</strong> associated militaryreadiness in numerous ways, including:• Diminished capacity to sustain troop combat operational readiness if training<strong>and</strong> testing opportunities are reduced at coastal military installations;• Comprised readiness, especially during extreme climatic events, of militarypersonnel, facilities, <strong>and</strong> materiel assets for global power projection via combatservice support, which is dependent, in part, on secure <strong>and</strong> properly functioningcoastal installations <strong>and</strong>, in some cases, supporting civil transportationinfrastructure; <strong>and</strong>• Increased costs, inefficiencies, <strong>and</strong> response time for military operations in thecoastal zone due to loss or degradation of natural resources <strong>and</strong> infrastructureat coastal installations as a result of sea-level rise or changes in the intensity ofclimate extremes.In addition, sprawl, incompatible l<strong>and</strong> use <strong>and</strong> other forms of encroachment on- <strong>and</strong>off-installation may operate in synergistic combination with climate change <strong>and</strong> havethe potential to overwhelm the adaptive capacity of installations (DoD, 2011).<strong>Coastal</strong> Military Installation <strong>Climate</strong>- <strong>and</strong> Global-change ChallengesThe National Intelligence Council (NIC, 2008) explored the national security implicationsof climate change in select countries <strong>and</strong> regions to characterize the extent that
Vulnerability <strong>and</strong> <strong>Impacts</strong> on Human Development 93anticipated effects may contribute to inter- <strong>and</strong> intra-state migrations, cause economichardships, result in escalated social tensions, <strong>and</strong> lead to state instabilities. The onset ofsuch crises has the potential for impacting <strong>and</strong> evolving DoD’s roles <strong>and</strong> missions. Moreresearch <strong>and</strong> study is needed to assess climate-environment-migration relationships.With a better underst<strong>and</strong>ing of these relationships, the readiness roles <strong>and</strong> missions ofsupporting military installations may need re-alignment to maintain U.S. national security(NIC, 2008).<strong>Coastal</strong>-installation readiness, in particular, can be challenged as a result of climaterelatedenvironmental stressors <strong>and</strong> drivers that include:• Changing weather patterns <strong>and</strong> extreme temperature, precipitation, <strong>and</strong> coastalstorm events;• Rising sea levels <strong>and</strong> subsiding or eroding l<strong>and</strong> masses;• Disruptions to the biosphere that have complex repercussions on ecologicsustainability;• Evolving l<strong>and</strong> <strong>and</strong> water resources use patterns <strong>and</strong> management practices on<strong>and</strong> off installation;• Production, accumulation, <strong>and</strong> migration of environmental contaminants onl<strong>and</strong>s <strong>and</strong> waters; <strong>and</strong>• Loss <strong>and</strong> degradation of habitats for protected threatened <strong>and</strong> endangered fish<strong>and</strong> wildlife species (DoD, 2011).Although DoD leadership has recognized <strong>and</strong> is continuing to study these challenges,military comm<strong>and</strong>ers often are consumed with addressing daily tactical missionrequirements, which limits the opportunity to strategically incorporate the issuesof climate change over extended future time scales. Technical guidance <strong>and</strong> capabilitiesneeded to distill climate change information, whether as explicit predictions of futureconditions or as scenarios, to the impact level at military installations is currently insufficient,although DoD is actively pursuing study of these needs. Recent interviewsamong DoD personnel at selected installations including Fort Benning, GA <strong>and</strong> NavalBase Norfolk, VA suggest that climate change is not fully realized as an inevitable threatin the near future. Although climate change forecasts are being discussed with higherfrequency among DoD managers, a low level of awareness exists of the empirical knowledgebase supporting global climate change predictions or scenario use nor any recognitionof the need for contingency planning (Noblis, 2010). Moreover, climate change isconsidered to be a regional phenomenon with insufficient relevance for consideration atspecific local installations; in other words, most DoD managers believed that not enoughinformation was available to implement climate change planning into current managementactivities (Noblis, 2010).Deferring actions to manage potential climate change risks <strong>and</strong> uncertainties mayexacerbate future impacts; however, the impact of delayed action can be addressed toenable:1. Sustaining development of effective plans, programs, <strong>and</strong> budgets;
94 <strong>Coastal</strong> <strong>Impacts</strong>, <strong>Adaptation</strong>, <strong>and</strong> <strong>Vulnerabilities</strong>2. Carrying out effective systems analysis;3. Developing credible cost estimates; <strong>and</strong>4. Creating timely <strong>and</strong> meaningful future defense plans (Cordesman, 2009).A comprehensive, integrated, <strong>and</strong> science-based approach is needed to quantify systems-scaleoperational risks of climate change for achieving military decision-makingeffectiveness (Noblis, 2010).<strong>Coastal</strong> Installation <strong>Vulnerabilities</strong> <strong>and</strong> Combat Service Support ReadinessThe 2010 Quadrennial Defense Review calls for a comprehensive assessment of all installationsto assess the potential impacts of climate change on DoD missions <strong>and</strong> toadapt as required (DoD, 2010). <strong>Vulnerabilities</strong> of coastal installations can be manifestedthrough impacts to natural resources that support operations <strong>and</strong> training exercises,deterioration of built infrastructure <strong>and</strong> equipment that support combat service supply,<strong>and</strong> direct <strong>and</strong> indirect impacts of climate-related disasters (Pollner et al., 2009). Allof these vulnerabilities have practical implications for military readiness. Diminishedquality of training <strong>and</strong> testing could lead to degradation of military personnel underst<strong>and</strong>ing<strong>and</strong> skill in executing combat strategies <strong>and</strong> tactics, whereas impairments to acoastal installation’s combat service supply mission has the potential to diminish globalpowerprojection capability during a crisis response.<strong>Coastal</strong> storms <strong>and</strong> sea-level rise in combination have the potential to impair installationinfrastructure that supports combat service support missions. Accelerated sea-levelrise will exacerbate the episodic effects of coastal storms, cause inundation of low-lyingl<strong>and</strong> areas, induce sustained geomorphologic <strong>and</strong> environmental changes, <strong>and</strong> alter harbortopography, bathymetry, currents <strong>and</strong> salinity. These events may impact access to<strong>and</strong> use of military installation assets <strong>and</strong> increase maintenance requirements for coastalfacilities. Resulting requirements may include increased dredging operations, dredgedmaterials placement needs, modification of dock facilities, <strong>and</strong> the need to harden facilities<strong>and</strong> coastal zones against hazard effects. Installations in which assets are locatedclose to current sea levels will be subject to increased groundwater salinity, higher watertables, <strong>and</strong> increases in periodic flooding, which will require increased stormwaterpumping <strong>and</strong> drainage capacity, maintenance for corrosion control, <strong>and</strong> flood riskreduction. In addition, the regional interdependency of installations during extremecoastal-storm events with surrounding civil electrical power <strong>and</strong> communication networks,roads, railways, <strong>and</strong> potable water distribution systems may result in increasedinstallation vulnerability due to climate impacts on systems <strong>and</strong> facilities external to theinstallation.<strong>Coastal</strong> storm risk assessment <strong>and</strong> management of military assets can be informed bythe characterization of extreme storm events based on historical experience <strong>and</strong> stormsurgemodeling. By contrast, sea-level rise is gradual even though the rates of changethat are expected this century (see Chapter 2) are unprecedented in terms of historicalU.S. military experience. Moreover, the uncertainties about future sea-level-rise ratespreclude the establishment of a best estimate of sea-level rise during the remainder ofthis century; hence, a single, most probable trajectory for adaptation to sea-level rise isnot available. This poses a non-stationary risk to coastal military installations, because
Vulnerability <strong>and</strong> <strong>Impacts</strong> on Human Development 95the fundamental operation requirements of many of these facilities are coastal- or waterside-dependent.A range of global sea-level change scenarios (see Chapter 2) was developedby an expert panel convened as part of the NCA to provide Assessment teams withscenarios for risk-based vulnerability <strong>and</strong> impact assessment. The four sea-level-changescenarios provided range from 0.2 meter to 2.0 meters through 2100. Based on the risktolerance of their decisions, stakeholders such as DoD can decide which of these scenariosto use to guide their vulnerability impact assessment <strong>and</strong> adaptation decisions.Increasingly, many coastal installations are taking on additional missions <strong>and</strong> tenantunits with force restructuring <strong>and</strong> dem<strong>and</strong>s of overseas contingency operations. Increasednumbers of installation tenants <strong>and</strong> training mission requirements may furtherexacerbate training capacity <strong>and</strong> scheduling flexibility limits imposed by ongoing climatechange. The potential for climate change-related installation realignment or closure,which also could translate into regional economic losses, is also a risk.Operations <strong>and</strong> Training Readiness <strong>and</strong> Natural Resource <strong>Impacts</strong><strong>Impacts</strong> of climate change on natural resources can reduce the capacity of military installationsto support operations <strong>and</strong> training by changing training conditions <strong>and</strong> degradingthe utility of these assets for training. Physical constraints on access to training l<strong>and</strong>s<strong>and</strong> waters resulting from extreme weather events have short-term effects on training<strong>and</strong> operations <strong>and</strong> also can damage roads <strong>and</strong> other infrastructure. Extreme heat eventscan require reductions in personnel activity levels. Extreme heat <strong>and</strong> drought events <strong>and</strong>high fire risk conditions also can preclude use of pyrotechnics, grenade simulators, <strong>and</strong>live-fire training with tracers to reduce the chance of wildfires. Extreme storm events<strong>and</strong> associated lightning, wind, <strong>and</strong> flooding risks can temporarily limit access to <strong>and</strong>degrade coastal l<strong>and</strong>s <strong>and</strong> waters for training as well as personnel <strong>and</strong> materiel transit.<strong>Impacts</strong> of climate change on installation natural resources can reduce the ability ofinstallations to meet environmental regulatory requirements, which can lead to restrictionson access to training <strong>and</strong> testing l<strong>and</strong>s <strong>and</strong> waters. Because current research indicatesthat global climate change is already having significant impacts on both vegetationpatterns across North America (Coops & Waring, 2001; Waring et al., 2011) <strong>and</strong> globalbird-population distributions (Wormworth & Mallon, 2006), underst<strong>and</strong>ing this situation<strong>and</strong> providing better training <strong>and</strong> information to DoD managers is relevant. Habitattransition or modification as a result of climate change may result in increased challengesfor installation managers to maintain the population status of species that arelisted as endangered or threatened under the U.S. Endangered Species Act of 1973 (7U.S.C. § 136, 16 U.S.C. § 1531 et seq.), while avoiding the increased potential for listingsof species that are not currently listed. The construction of compensatory natural resourcesmanagement features can be costly <strong>and</strong> has the potential to escalate. Terrestriall<strong>and</strong> management <strong>and</strong> training exercises could become restricted spatially <strong>and</strong>, as a result,cause increased local ground disturbances <strong>and</strong> changes that degrade water qualityby increasing waterway sedimentation <strong>and</strong> nutrient loading. In addition, amphibioustraining space could become restricted as habitats <strong>and</strong> buffers critical for sea turtles <strong>and</strong>shore birds decrease or as changes in barrier isl<strong>and</strong> <strong>and</strong> coastal marsh configuration dueto sea-level rise <strong>and</strong> storm activity reduce available training space. These changes inquality, quantity, <strong>and</strong> distribution of natural assets may affect the DoD’s ability to meet
96 <strong>Coastal</strong> <strong>Impacts</strong>, <strong>Adaptation</strong>, <strong>and</strong> <strong>Vulnerabilities</strong>operational tempos <strong>and</strong> reduce scheduling flexibility, such as in reduction of installationcapacity to support l<strong>and</strong>-based <strong>and</strong> amphibious training exercises.Increased temperatures <strong>and</strong> potential changes in precipitation patterns may requiremodification of prescribed burn programs, which are an important component of listed<strong>and</strong> at-risk species management on many installations. Increased coastal storm intensity<strong>and</strong> sea-level rise may cause losses <strong>and</strong> conversions of wetl<strong>and</strong>s, barrier isl<strong>and</strong>s, <strong>and</strong>shorelines to open water <strong>and</strong>, if accompanied by high runoff events, could result in synergisticimpacts to natural <strong>and</strong> built infrastructure.DoD Requirements <strong>and</strong> Programs for Vulnerability <strong>and</strong> Impact Assessments <strong>and</strong><strong>Adaptation</strong> PlanningThree levels of risk-based impacts on DoD installations can be identified. At the highestlevel of impact, an installation may no longer be able to support current <strong>and</strong> futuremission requirements. At an intermediate level of impact, missions could still beaccomplished but would require adaptive actions to prevent or remediate impacts,which could carry high costs <strong>and</strong> require significant time for planning <strong>and</strong> implementation.Other impacts at this level could be acute, such as coastal-flooding events, withhigh short-term costs <strong>and</strong> short-term disruption, but would not prevent mission accomplishmentover the long-term. At the lowest level of impact, operations may need to bemodified but could be accomplished within established processes with no significantcommitment of additional resources.DoD requires actionable climate information <strong>and</strong> projections at mission-relevant temporal<strong>and</strong> spatial scales for installation planning <strong>and</strong> adaptation. <strong>Climate</strong> information<strong>and</strong> decision tools are needed to support priority installation functions for maintainingeffective testing, training, deployment, <strong>and</strong> force-sustainment capabilities, sustainingthe built environment, complying with regulatory requirements, <strong>and</strong> keeping personnelsafe. This will require increased underst<strong>and</strong>ing of the extent to which DoD planning <strong>and</strong>decision processes are influenced by climatic <strong>and</strong> meteorological factors. For climatedata <strong>and</strong> analyses tools to be most relevant to DoD needs, they must be scalable acrossall DoD comm<strong>and</strong> echelons <strong>and</strong> provide comprehensive <strong>and</strong> comparable analysesacross installations <strong>and</strong> regions for effective decision making. Effective use of available<strong>and</strong> new information <strong>and</strong> decision-support capabilities will require inter-agency coordinationregionally <strong>and</strong> nationally. In addition, interdependencies of installation facilitieswith surrounding areas will require close coordination with other affected stakeholders.With proactive vulnerability <strong>and</strong> impact assessment, asset vulnerabilities <strong>and</strong> theirsensitivities to changing stressors can be identified <strong>and</strong> serve as the necessary basis forplanning <strong>and</strong> implementing resilient <strong>and</strong> adaptive management actions. Challengesinclude:• Scientifically informing critical decisions that must be made through expertanalysis of spatial-temporal complexities <strong>and</strong> uncertainties of stressor impactson objectives-based installation mission performance that can serve the need forbaseline assessment characterization at both the screening <strong>and</strong> detailed levels;• Formulation, technical evaluation, distinctive comparison, <strong>and</strong> selection ofcompeting alternative management actions;
Vulnerability <strong>and</strong> <strong>Impacts</strong> on Human Development 97• Developing <strong>and</strong> transferring a decision-support framework for effective applicationin the military community of practice; <strong>and</strong>• Specifying protocols for collection <strong>and</strong> management of site-specific monitoringdata <strong>and</strong> status metrics while minimizing time <strong>and</strong> expense requirements forcontinual focusing <strong>and</strong> application in assessment <strong>and</strong> management cycles.DoD is currently developing policy, guidance, <strong>and</strong> technical knowledge <strong>and</strong> capabilitiesto effectively assess vulnerabilities <strong>and</strong> impacts <strong>and</strong> to plan for <strong>and</strong> adapt topotential climate change impacts. Development of technical support capabilities for vulnerability<strong>and</strong> impact assessment <strong>and</strong> adaptation planning have been initiated througha range of efforts under the DoD Strategic Environmental Research <strong>and</strong> DevelopmentProgram, Legacy Resource Management Program, <strong>and</strong> the U.S. Army Corps of Engineers’Institute of Water Resources <strong>and</strong> Engineer Research Development Center.
Chapter 5<strong>Adaptation</strong> <strong>and</strong> MitigationKey FindingsffffffffffffAlthough adaptation planning activities in the coastal zone are increasing, theygenerally occur in an adhoc manner <strong>and</strong> at varied spatial scales dictated byon-the-ground needs <strong>and</strong> adaptation drivers in the particular area. Efficiency ofadaptation can be improved through integration into overall l<strong>and</strong> use planning<strong>and</strong> ocean <strong>and</strong> coastal management. High Confidence.In some cases, adaptation is being directly integrated, or mainstreamed, intoexisting decision-making frameworks regarding zoning <strong>and</strong> floodplain, coastal,<strong>and</strong> emergency management, but these frameworks are not always perfect fit <strong>and</strong>sometimes existing laws pose a barrier to implementation. Very High Confidence.Tools <strong>and</strong> resources to support adaptation planning are increasing but technical<strong>and</strong> data gaps persist. As adaptation planning has evolved, recognitionhas grown regarding the need for detailed information that is compatible withorganizational decision-making processes <strong>and</strong> management systems. Very HighConfidence.Although adaptation planning has an increasingly rich portfolio of case studiesthat contribute to shared learning, the implementation of adaptation plans hasproceeded at a much slower pace. Very High Confidence.Elements commonly found in adaptation plans include vulnerability assessments,monitoring <strong>and</strong> indicators, capacity building, education <strong>and</strong> outreach,regulatory <strong>and</strong> programmatic changes, implementation strategies, <strong>and</strong> a sectorby-sectorapproach. Very High Confidence.Although state <strong>and</strong> federal governments play a major role in facilitating adaptationplanning, most coastal adaptation will be implemented at the local level.Local governments are the primary actors charged with making the critical,basic l<strong>and</strong>-use <strong>and</strong> public investment decisions <strong>and</strong> with working with communitystakeholder groups to implement adaptive measures on the ground. VeryHigh Confidence.5.1: <strong>Adaptation</strong> Planning in the <strong>Coastal</strong> ZoneIn the ten years since the first National Assessment of the Potential Consequences of <strong>Climate</strong>Variability <strong>and</strong> Change, the science <strong>and</strong> policy l<strong>and</strong>scape for adaptation has evolved significantly.<strong>Adaptation</strong> is emerging as an essential strategy for managing climate risk <strong>and</strong>98
<strong>Adaptation</strong> <strong>and</strong> Mitigation 99a broad range of adaptation initiatives are being pursued across a range of geopoliticalscales. This interest in adaptation has emerged from an increased awareness that climateimpacts are unavoidable (Wetherl<strong>and</strong> et al., 2001); a growing availability of knowledge,data, <strong>and</strong> tools for the assessment of climate risk; <strong>and</strong> the interest of government agencies,businesses, <strong>and</strong> communities in increasing their resilience to both current climatevariability as well as future climate change. However, adaptation strategies are notgenerally mainstreamed into the policy apparatus of governments or the developmentplans of the private sector; in other words, adaptation strategies supplement existingplanning efforts but often involve an effort on their own rather than being integratedinto existing management <strong>and</strong> policy regimes. Also, although adaptation planning hasan increasingly rich portfolio of case studies contributing to shared learning (Gregg etal., 2011), the implementation of adaptation plans has proceeded at a much slower pace.Background on <strong>Adaptation</strong> Planning<strong>Coastal</strong> adaptation planning will generally identify vulnerable coastal resources <strong>and</strong>likely impacts to these resources; define goals <strong>and</strong> specific adaptation actions based onthe best available information; outline an implementation strategy; <strong>and</strong> create a plan forevaluating <strong>and</strong> monitoring results. Elements commonly found in adaptation plans areincluded below (see Box 5-1; Hansen & Hoffman, 2011; Heller & Zavaleta, 2009).Inventory of <strong>Adaptation</strong> Planning<strong>Adaptation</strong>-planning processes vary across spatial <strong>and</strong> jurisdictional scales. Because impactsfrom climate change will cross jurisdictional <strong>and</strong> sectoral boundaries, both planning<strong>and</strong> implementation will generally require coordination at all levels of governmentincluding state, local, regional, <strong>and</strong> national <strong>and</strong> among a range of public <strong>and</strong> privateentities. Planning processes typically involve coordination both vertically across local,state, <strong>and</strong> federal offices <strong>and</strong> horizontally across agencies <strong>and</strong> between counties, municipalities,or states.All major levels of government have an important role to play in facilitating adaptation.At the federal level, agencies develop climate science <strong>and</strong> models, initiate pilotefforts with hundreds of local governments to plan for sea-level rise (Titus & Hudgens,2010), <strong>and</strong> provide important technical support, data, <strong>and</strong> mapping that policymakersneed for planning. As detailed in examples below, the federal government also allocatesbillions of dollars in public funds to pay for critical projects <strong>and</strong> services necessary foradaptation throughout the coastal zone such as hazard preparedness, disaster response,infrastructure development, <strong>and</strong> conservation projects. Similarly, state agencies distributestate funds <strong>and</strong> provide oversight <strong>and</strong> technical support for adaptation planning; oftenmanage state-owned coastal l<strong>and</strong>s <strong>and</strong> can acquire vulnerable properties; <strong>and</strong> haveregulatory authority in all or parts of the state’s coastal zone. However, most adaptationwill occur at the local level; local governments are the primary actors charged with makingthe basic l<strong>and</strong>-use <strong>and</strong> public investment decisions that will be critical, along withworking with community stakeholder groups, to implementing adaptive measures onthe ground. The private sector also has a role; corporations, insurance companies, l<strong>and</strong>trusts, <strong>and</strong> private individuals will have to make changes in how they manage assets
100 <strong>Coastal</strong> <strong>Impacts</strong>, <strong>Adaptation</strong>, <strong>and</strong> <strong>Vulnerabilities</strong>Box 5-1Elements Commonly Found in <strong>Adaptation</strong> Plans<strong>Adaptation</strong> plans employ several formats <strong>and</strong> includea variety of elements depending on the need<strong>and</strong> context in which they are undertaken. Elementsor outcomes that often characterize planninginclude:Assessing Vulnerability• The vulnerability of a system is the degree towhich it is susceptible to or unable to copewith climate-change effects (See definitions onpage xviii of this report).• Vulnerability assessments often focus on exposure<strong>and</strong> sensitivity to impacts as well as capacityto adapt. Dem<strong>and</strong> for this is increasedin policy-relevant formats.Monitoring <strong>and</strong> Indicators:• Environmental indicators measure the effectsof natural <strong>and</strong> manmade stressors on a system<strong>and</strong> convey scientific information on the currentstatus of conditions as well as changes <strong>and</strong>trends in these conditions over time (EPA <strong>Climate</strong>Ready Estuaries Progress Report, 2010).• Indicators can measure progress of implementationof process-based adaptation measuresor the effectiveness of the outcome-basedadaptive policies <strong>and</strong> activities.• Research, observations, <strong>and</strong> modeling willcontinue to improve forecasts of regional- <strong>and</strong>local-scale climate impacts <strong>and</strong> inform adaptationefforts.Regulatory <strong>and</strong> Programmatic Changes• Laws, regulations, <strong>and</strong> programmatic changescan promote or remove barriers to adaptation;however, regulations <strong>and</strong> policies must be responsiveas the science <strong>and</strong> underst<strong>and</strong>ing ofclimate change evolves, which is often a difficulttask.• Governments can adopt new policies such asan Executive Order or use existing authorityby amending state regulations to account forclimate change.Implementation Strategies• Including elements for implementation is criticalin moving a plan forward.Sector-by-Sector Approach• A sector-by-sector approach allows for thebreakdown of complex problems with plansanalyzing vulnerability <strong>and</strong> needs within sectorsmost important to the state or region.• Common sectors include: Public Health, Habitat/NaturalResource Management, WaterManagement, Agriculture, Forestry, Transportation<strong>and</strong> Energy Infrastructure, <strong>and</strong> <strong>Coastal</strong>Communities.• A sector-by-sector approach can also miss importantbetween-sector linkages, resulting inless effective actions or cross-purpose actionsbetween sectors.Capacity Building, Education, <strong>and</strong>Outreach• The engagement of diverse stakeholdersthroughout the process increases access to expertknowledge, technical skills, <strong>and</strong> financialresources <strong>and</strong> helps build public support foran adaptation plan.
<strong>Adaptation</strong> <strong>and</strong> Mitigation 101<strong>and</strong> l<strong>and</strong>s, build facilities, <strong>and</strong> manage risks. Finally, the nongovernmental sector hastaken a lead role in gathering critical information <strong>and</strong> developing on-the-ground approachesto foster adaptation.Because of differences in scale, adaptation planning has taken many different forms:certain jurisdictions developed separate multi-sectoral adaptation plans (CA), developedadaptation plans for individual sectors or impacts (MD), or included adaptationin plans to reduce greenhouse gas emissions (AK, FL, NY), while others mainstreamedadaptation by including consideration of climate impacts in other types of planningdocuments, laws, or regulations such as hazard-risk reduction plans (Lewes, DE) <strong>and</strong>coastal plans (RI <strong>and</strong> San Francisco, CA) (Arroyo & Cruce, 2012). This section providesexamples of different types of planning efforts at several different spatial scales <strong>and</strong> levelsof government. Because offering a comprehensive list is beyond the scope of thisreport, the authors selected efforts that highlighted different approaches, regions, <strong>and</strong>successes <strong>and</strong> challenges.Federal: The Federal Interagency <strong>Climate</strong> change <strong>Adaptation</strong> Task Force. In a 2009 ExecutiveOrder, President Obama created the Task Force to coordinate adaptation planningamong federal agencies, tribes, <strong>and</strong> communities <strong>and</strong> to recommend how federalagencies can mainstream climate change considerations in programs <strong>and</strong> operations. Ina 2011 progress report, the Task Force made key recommendations to the federal government:1) provide <strong>and</strong> translate data for decision-makers; 2) review the role of bothprivate insurance <strong>and</strong> the National Flood Insurance Program in promoting resilience;3) encourage pilot projects where federal agencies support local adaptation initiativessuch as the EPA, HUD, <strong>and</strong> DOT Sustainable Communities Program; <strong>and</strong> (4) examinecross-cutting issues related to ocean <strong>and</strong> coastal resilience, such as ocean acidification<strong>and</strong> ecosystem-based management.Regional: West Coast Governors’ Agreement on Ocean Health (WCGA). After recognizingin September 2006 that adaptation will require a transboundary response, the governorsof California, Oregon, <strong>and</strong> Washington signed the WCGA <strong>and</strong> created a regional partnershipfor coastal management. The WCGA created ten Action Coordination Teamscomposed of state-agency staff <strong>and</strong> federal partners to study <strong>and</strong> develop approachesfor cross-jurisdictional management of coastal resources. Teams are developing strategiesto adapt to sea-level rise, coordinate on sediment management, <strong>and</strong> implement ecosystem-basedmanagement approaches. The three states combined financial resourcesto commission an independent study of localized sea-level-rise projections from the NationalResearch Council. This regional collaborative will be exp<strong>and</strong>ed to include Alaska<strong>and</strong> British Columbia through the Pacific Coast Collaborative.State: North Carolina—Sea-level-rise Risk Management Study. North Carolina <strong>and</strong> FEMAare working to map future shoreline changes. This project will study hazard-mappingtools to evaluate how sea-level rise will change flooding along the state’s coast <strong>and</strong> proposerisk management strategies to reduce or avoid those flood risks.Local: Southeast Florida Regional <strong>Climate</strong> Change Compact. Palm Beach, Broward,Miami-Dade, <strong>and</strong> Monroe counties in Southeast Florida are collectively addressingadaptation. The counties developed a uniform approach to estimating <strong>and</strong> mapping
102 <strong>Coastal</strong> <strong>Impacts</strong>, <strong>Adaptation</strong>, <strong>and</strong> <strong>Vulnerabilities</strong>sea-level-rise scenarios <strong>and</strong> leveraged support from federal agencies that otherwisemight have been split between individual counties.Tribal: Swinomish Tribe, Washington—<strong>Climate</strong> <strong>Adaptation</strong> Action Plan. The SwinomishTribe of Washington developed an adaptation plan for its reservation located where thelower Skagit River empties into Puget Sound. The Swinomish used scenario- <strong>and</strong> riskbasedplanning to assess vulnerabilities to their natural <strong>and</strong> human systems <strong>and</strong> culturalresources. Of particular concern to the Tribe are the impacts to natural resources fromhard-armored responses to sea-level rise. The Reservation has 2,900 acres of tidel<strong>and</strong>sthat are integral to maintaining the Tribe’s fishing traditions. The plan recommends theTribe use long-term planning to avoid environmental impacts to these resources.Private: Northrop Grumman—<strong>Climate</strong> <strong>Impacts</strong> on the Newport News Shipyard. NorthropGrumman is studying vulnerabilities to its Hampton Roads, VA shipyard, which builds<strong>and</strong> maintains nuclear aircraft carriers. Hampton Roads is considered one of the mostvulnerable regions to sea-level rise. The shipyard has 20,000 employees <strong>and</strong> has servicedapproximately 800 ships <strong>and</strong> 30 carriers. Potential impacts to the shipyard include floodingof dry-docks, <strong>and</strong> inundation of residences, business, <strong>and</strong> transportation facilitiesThe Status of <strong>Coastal</strong> <strong>Adaptation</strong> PlanningWith adaptation planning proliferating as a strategy for managing the risks of climatechange to coastal systems, attention is beginning to shift toward evaluating how effectivesuch planning has been. The following sections demonstrate some strengths of adaptationplanning to date, the emerging practices that are advancing the practice, <strong>and</strong>those aspects of adaptation planning that appear to be persistent challenges.Strengths of <strong>Coastal</strong> <strong>Adaptation</strong> PlanningOne of the most significant developments in coastal adaptation in recent years is theemergence of guidance that can support state- <strong>and</strong> local-level adaptation planning. Forexample, the International Council for Local Environmental Initiatives (ICLEI) – LocalGovernments for Sustainability, the University of Washington, <strong>and</strong> King County inWashington state prepared a guide entitled Preparing for <strong>Climate</strong> Change to lead stakeholdersthrough the adaptation-planning process (Snover et al., 2007). In addition, ICLEIhas developed an <strong>Adaptation</strong> Database <strong>and</strong> Planning Tool (ADAPT) to support adaptationplanning in local governments. Similar guidance has been developed to address thespecific circumstances of coastal communities <strong>and</strong> ecosystems. For example, NOAA’s(2010) report entitled Adapting to <strong>Climate</strong> Change: A Planning Guide for State <strong>Coastal</strong> Managersprovides an overview of the implications of climate change for the coastal communities<strong>and</strong> outlines a range of key considerations for decision making. Other guidance,such as the EPA’s report entitled Rolling Easements (Titus, 2011), is designed to providedetailed information on specific coastal adaptation strategies. Despite variation amongthese different types of guidance regarding the appropriate approach to take to adaptationplanning (Preston et al., 2009), the availability <strong>and</strong> accessibility of such guidanceprovides a foundation for enhancing the capacity of federal, state, <strong>and</strong> local organizationsto take the first steps in planning for climate change on America’s coasts.
<strong>Adaptation</strong> <strong>and</strong> Mitigation 103By initiating coastal adaptation planning, government agencies <strong>and</strong> local communitiesare educating themselves <strong>and</strong> others while building networks to share that knowledgeamong researchers, decision makers, <strong>and</strong> community members. One of the areas inwhich adaptation planning has been instrumental in exp<strong>and</strong>ing knowledge has been inthe assessment of vulnerabilities <strong>and</strong> risks associated with climate change. For example,the Partnership for the Delaware Estuary undertook a series of case studies to examinethe estuary’s vulnerability to climate change (Kreeger et al., 2011). Meanwhile, the Stateof New Jersey assessed the potential impacts of sea-level rise <strong>and</strong> coastal inundationfor the state’s coastline as well as the associated socio-economic impacts (Cooper et al.,2005). Similar assessments have been conducted for individual municipalities includingthe City of New York <strong>and</strong> the City of Punta Gorda, Florida (Beever et al., 2009; New YourCity Panel on <strong>Climate</strong> Change, 2010, also see Box 4.1).Assessments of vulnerability <strong>and</strong> risk are also emerging from individual utilities <strong>and</strong>infrastructure managers. For example, as part of its adaptation planning, the City ofNew York’s Metropolitan Transit Authority assessed the potential impacts of climatechange to the agency’s infrastructure <strong>and</strong> operations (Jacob et al., 2008). Meanwhile,King County, Washington assessed the implications of sea-level rise for waste-watermanagement infrastructure (King County, 2008). Although the goals of adaptation planningare broader than a simple assessment of potential vulnerabilities <strong>and</strong> risks associatedwith climate change, such assessment activities are a key entry point for adaptationplanning. Accordingly, researchers <strong>and</strong> practitioners have contributed to the expansionof methods <strong>and</strong> tools for assessing coastal risk (also see Section 5.3).Emerging Planning PracticeAs adaptation planning has evolved, recognition has grown regarding the need for detailedinformation that is compatible with organizational decision-making processes<strong>and</strong> management systems. In recent years, progress has been made in the integration ofadaptation into spatial planning at the state, regional, <strong>and</strong> local levels. This has allowedadaptation planning to advance beyond the identification of potential policies <strong>and</strong> optionsto more practical explorations of those options at spatial scales relevant to decisionmakers; for example, Miami/Dade County has developed a series of spatial flood-risk<strong>and</strong> sea-level-rise visualizations. Increasingly, spatial planning is integrating informationon coastal risk with l<strong>and</strong>-use planning; for example, regional planning agencies inPennsylvania (Linn, 2010), Georgia (Concannon et al., 2010), <strong>and</strong> Florida (Merritt, 2010)have collaborated with local governments to create maps depicting which l<strong>and</strong>s are likelyto receive shore protection <strong>and</strong> which l<strong>and</strong>s would be given up to the rising sea. TheNOAA Sea Grant programs have conducted similar efforts in New York (Tanski, 2010)<strong>and</strong> North Carolina (Clark & Kassakian, 2010). A spatial planning exercise conductedby the U.S. Department of Transportation (U.S. DOT) in Cape Cod, Massachusetts exploredmultiple scenarios of future development on the cape to explore interactionsamong coastal vulnerability, development, <strong>and</strong> maintenance of environmental amenity(U.S. DOT, 2011). Integrated approaches to spatial planning have also been applied inthe cities of Punta Gorda, Florida (Beever et al., 2009); New York, New York (New YorkCity Panel on <strong>Climate</strong> Change, 2010); <strong>and</strong> Boston, Massachusetts (<strong>Adaptation</strong> AdvisoryCommittee, 2011).
104 <strong>Coastal</strong> <strong>Impacts</strong>, <strong>Adaptation</strong>, <strong>and</strong> <strong>Vulnerabilities</strong>The aforementioned Cape Cod study highlights another advance in adaptation planning:the expansion of collaborative networks <strong>and</strong> stakeholder participation in the planningprocess. Robust adaptation planning necessitates both expert knowledge regardingbiophysical climate change impacts <strong>and</strong> regional <strong>and</strong> local knowledge regarding howthose changes might impact valued human <strong>and</strong> ecological systems <strong>and</strong> the range ofrelevant policy responses. <strong>Adaptation</strong> planning is therefore increasingly undertakenthrough partnerships among federal, state, <strong>and</strong> local government agencies, research institutions,<strong>and</strong> non-profit organizations. Such partnerships have facilitated knowledgetransfers <strong>and</strong> supported adaptation planning efforts in Oregon (State of Oregon, 2010)<strong>and</strong> California (California Natural Resources Agency, 2009) as well as the cities of NewYork (New York City Panel on <strong>Climate</strong> Change, 2010) <strong>and</strong> Boston (<strong>Adaptation</strong> AdvisoryCommittee, 2011). This has created greater opportunities for learning <strong>and</strong> enhanced thepractical utility of adaptation planning.<strong>Adaptation</strong> Planning ChallengesDespite the rapid expansion of coastal adaptation planning, challenges remain in translatingsuch planning efforts into increased coastal-systems resilience to the impacts ofclimate change (Berrang-Ford et al., 2011; Preston et al., 2011a). A central challenge isthe availability of knowledge <strong>and</strong> tools that enable confident planning for the future;for example, considerable uncertainty persists with respect to projections of future sealevelrise as well as information regarding future demographic <strong>and</strong> economic trajectories(Preston et al., 2011b, see also Section 2.2). Guidance on flexible decision pathways isneeded to assist decision makers with evaluating <strong>and</strong> staging adaptation decisions whilerecognizing that underst<strong>and</strong>ing of the future will always be imperfect. Constraints onfinancial <strong>and</strong> human resources within organizations may hinder attempts to managesuch uncertainties (Moser & Ekstrom, 2010). Developing strategies for overcoming suchconstraints is therefore an important but often overlooked component of adaptationplanning. In one constructive example, the City of Homer, Alaska intends to enact a sustainabilityfund to recruit staff <strong>and</strong> finance adaptation measures (City of Homer, 2011).The challenges in implementing adaptation plans extend beyond the resourcing oforganizations. Although many adaptation actions for coastal areas can be categorizedas “no regrets” actions that pose few opportunity costs (California Natural ResourcesAgency, 2009), more substantive actions may have larger policy or legal hurdles. Forexample, restrictions on development in vulnerable areas or the implementation ofplanned retreat may be challenged as regulatory “takings” that require just compensation(Craig, 2010), which may force tradeoffs between coastal protection <strong>and</strong> propertyrights. Overlapping <strong>and</strong> sometimes conflicting laws, often designed without considerationof a changing climate, can prevent the adoption of adaptive measures. In the AlligatorRiver National Wildlife Refuge/Albemarle-Pamlico Peninsula <strong>Climate</strong> <strong>Adaptation</strong>Project, the Nature Conservancy <strong>and</strong> the U.S. Fish <strong>and</strong> Wildlife Service set out to evaluatethe effects of different adaptation strategies on areas likely to be impacted by sea-levelrise. The strategies included constructing oyster reefs to buffer shorelines from waves<strong>and</strong> storm surges, restoring the natural hydrologic regime <strong>and</strong> associated wetl<strong>and</strong> systems,<strong>and</strong> planting salt- <strong>and</strong> flood-tolerant species, several of which required federal <strong>and</strong>state permits. The permit required through the state’s <strong>Coastal</strong> Area Management Act
<strong>Adaptation</strong> <strong>and</strong> Mitigation 105took eight months to acquire because the materials used to construct the oyster reef didnot conform to the state’s concept of fill material <strong>and</strong> the permit was elevated to a majorpermit (Gregg et al., 2010).Although some adaptation-planning efforts acknowledge these governance challenges<strong>and</strong> articulate the actors <strong>and</strong> actions needed to implement particular policies, morecomprehensive policy frameworks for adaptation implementation are needed to createthe enabling conditions for coastal adaptation. Finally, although available guidance foradaptation planning emphasizes the need for monitoring <strong>and</strong> evaluation of implementation(Snover et al., 2007), these elements are often missing from adaptation plans inpractice (Preston et al., 2011a).5.2 <strong>Coastal</strong> Resource Management <strong>and</strong> Restoration in theContext of <strong>Climate</strong> ChangeMany issues that coastal managers are dealing with already on a daily basis are likelyto be exacerbated by climate change; therefore, in a certain sense, planning for climatechange will not require a new set of tools or planning strategies but is rather a matter ofrethinking existing coastal management <strong>and</strong> restoration priorities in light of a new set ofclimate endpoints or scenarios. Of major concern are:• Ecosystems that are already experiencing stress associated with l<strong>and</strong>-use change,hydrologic alteration, <strong>and</strong> other non-climate perturbations;• Already vulnerable coastal resources that are also highly sensitive to changes inclimate such as temperature increase <strong>and</strong> precipitation change; <strong>and</strong>• Natural <strong>and</strong> cultural resources at risk due to their geography.With an emphasis on the priorities listed above, coastal managers are beginning tospecifically consider climate change in planning <strong>and</strong> on-the-ground implementation ofcoastal resource management <strong>and</strong> restoration efforts. In some instances, coastal managersare assessing how climate change will affect the ability of a given restoration projectto achieve existing restoration goals <strong>and</strong> objectives (NWF, 2011); in other cases, managersare thinking about climate change from a broader perspective with an aim towardsdeveloping <strong>and</strong> implementing resource management or restoration practices to protectagainst, remedy, or increase ecosystem resilience to the impacts of climate change.<strong>Climate</strong> Change Considerations for <strong>Coastal</strong> Resource Management <strong>and</strong>RestorationSome of the most challenging elements associated with natural, cultural, <strong>and</strong> economiccoastal resource management in light of climate change are associated with coastal <strong>and</strong>watershed influences of storms <strong>and</strong> extreme events, sediment management, <strong>and</strong> theimpacts of sea-level rise on tidal wetl<strong>and</strong> ecosystems <strong>and</strong> cultural resources. <strong>Climate</strong>change considerations for such management needs are highlighted below.Managing for STORMS <strong>and</strong> EXTREME EVENTS. Prudent coastal resource management<strong>and</strong> restoration strategies will consider the gradual change expected to occur
106 <strong>Coastal</strong> <strong>Impacts</strong>, <strong>Adaptation</strong>, <strong>and</strong> <strong>Vulnerabilities</strong>due to climate change as well as likelihood of moderate-to-severe damage to result fromepisodic extreme events such as hurricanes, tropical storms <strong>and</strong> nor’easters.Although the damage to human infrastructure from hurricanes <strong>and</strong> tropical stormscan be substantial, both tropical <strong>and</strong> extra-tropical systems have the potential for significantdamage to coastal natural resources as well. The persistent loss of more than 135square miles of coastal wetl<strong>and</strong> throughout the Louisiana coastal zone in the two yearsbetween November 2004 <strong>and</strong> October 2006 is associated primarily with the passagesof Hurricanes Katrina <strong>and</strong> Rita (Couvillion et al., 2011). By October 2008, HurricanesGustav <strong>and</strong> Ike resulted in the additional persistent loss of almost 95 square miles ofwetl<strong>and</strong> in Louisiana (Couvillion et al., 2011).Disruption of coastal resources from storms goes beyond the physical disruptionfrom storm surge. In 1972, a weak Hurricane Agnes, combined with a non-tropical lowpressure system over the U.S. Mid-Atlantic region, dumped more than 10 inches of rainthroughout much of the Chesapeake Bay watershed. Agnes-induced runoff delivered 32million metric tons of dry sediment from the Susquehanna River into the ChesapeakeBay <strong>and</strong> the Bay’s salinity gradient was moved downstream more than 30 miles (NOAA,2003). The influx of nutrients <strong>and</strong> sediments killed upwards of two-thirds of the Bay’ssubmerged aquatic vegetation <strong>and</strong> caused significant impacts to its oyster <strong>and</strong> clampopulations.Sediment MANAGEMENT. The acceleration of global sea-level rise, coupled withstorm impacts <strong>and</strong> hydrologic alteration of rivers that drain to the coast, calls for agreater emphasis on regional sediment management planning (Gulf of Mexico Alliance,2009). Regional sediment management is a strategy employed to improve managementof sediment resources in many coastal areas. Strategies such as beach nourishment areused in many areas to supplement natural-sediment transport mechanisms <strong>and</strong> maintainbuffers between public <strong>and</strong> private infrastructure <strong>and</strong> coastal waters. Additionally, therelocation of sediment is a large element of many coastal management strategies. Thisincludes moving sediment out of undesirable places as well as placing sediment intodesirable areas. In general, improving the management of available sediment resourcescould minimize costs for moving sediment while concurrently creating <strong>and</strong> maintainingcoastal features to decrease coastal risk. As our knowledge of climate, sea-level rise, <strong>and</strong>sediment dynamics increases, <strong>and</strong> the tools available to identify <strong>and</strong> quantify sedimentresources improve, coastal regions will be able to more strategically manage availablesediment resources.One significant climate change impact for the entire Gulf of Mexico coastal regionis increased sea-level rise leading to increased coastal erosion <strong>and</strong> wetl<strong>and</strong> loss. Theneed for sediments is substantial now <strong>and</strong> is likely to increase significantly in futuredecades as sea-level rise accelerates over current rates (Gulf of Mexico Alliance, 2009).In light of such climate forces, sediment is often viewed as a resource for building wetl<strong>and</strong>sthat offset the losses that many coastal areas are experiencing; for example, the<strong>Coastal</strong> Protection <strong>and</strong> Restoration Authority (CPRA) of Louisiana has constructed increasinglylarger <strong>and</strong> more comprehensive marsh creation projects utilizing a numberof sediment sources. Barrier isl<strong>and</strong>s are maintained <strong>and</strong> marsh areas are constructed inareas that have eroded or degraded. These areas provide important ecosystem servicesrelated to recreation <strong>and</strong> fisheries <strong>and</strong> storm-risk reduction for coastal communities <strong>and</strong>
<strong>Adaptation</strong> <strong>and</strong> Mitigation 107infrastructure. When deltaic processes are re-established by reconnecting these marshareas to the Mississippi River, evidence from past projects indicates that they may besustainable even under some accelerated sea-level rise scenarios (DeLaune et al., 2003;Lane et al., 2006).Tidal WETLAND RESTORATION. By their nature, intertidal wetl<strong>and</strong> ecosystems occurwithin a narrow tidal range <strong>and</strong> are extremely vulnerable to even small changes insea level. <strong>Coastal</strong> wetl<strong>and</strong>s also sequester carbon at rates three to five times greater thanmature tropical forests (Murray et al., 2011); therefore, tidal wetl<strong>and</strong> restoration has implicationsfor minimizing the impacts of climate change on ecosystem services as well asmitigating climate change caused by greenhouse gas emissions.Recognizing this, Louisiana has been considering climate with regards to the sustainability<strong>and</strong> resilience of wetl<strong>and</strong>s restoration projects (CPRA, 2012). In the mid-Atlantic,coastal managers are strategically targeting restoration <strong>and</strong> protection efforts to ensurespace for wetl<strong>and</strong>s to migrate inl<strong>and</strong> as sea level rises <strong>and</strong> in many other areas of thecountry, coastal managers are working to create or restore tidal marsh to protect communities<strong>and</strong> assets from some coastal storm risk (Gregg et al., 2011) <strong>and</strong> evaluating theprojected resilience of individual marsh restoration projects in the context of acceleratedsea-level rise <strong>and</strong> sediment availability projections (Stralberg et al., 2011).Protecting Cultural RESOURCES. The above strategies are key to protectingbuilt infrastructure in the coastal zone. Wetl<strong>and</strong> restoration <strong>and</strong> the nourishment of barrierisl<strong>and</strong>s with sediment have the potential to reduce some of the impacts from sea-levelrise <strong>and</strong> storms to cultural resources. Cultural resources require unique managementstrategies because they are non-renewable. Some key areas of research, including materialsvulnerability, change monitoring, cultural heritage management, <strong>and</strong> damageprevention (UNESCO, 2008), are still needed to help identify the most relevant managementstrategies in the coastal zone. Increased flooding in the coastal zone will damagebuildings not designed to withst<strong>and</strong> prolonged immersion. Increases in storm intensity<strong>and</strong> high winds can lead to structural damage (UNESCO, 2008). In coastal communitiesin Alaska, diminished sea ice <strong>and</strong> melting of thermal coastal features are leadingto increased rates of erosion <strong>and</strong> are increasing the vulnerability of communities likeShishmaref <strong>and</strong> Kivilina. The challenges faced by some coastal communities <strong>and</strong> culturalresources will be to identify the relevant management strategy such as relocation/retreat, undertaken for the Cape Hatteras Lighthouse in North Carolina; protect in place,undertaken at Fort Massachusetts in Mississippi; or accommodate <strong>and</strong> allow coastalprocesses to alter the configuration of the coast at the site of these coastal resources (Caffrey& Beavers, 2008).Challenges, Needs, <strong>and</strong> OpportunitiesThe ability of institutions to conduct resource management <strong>and</strong> restoration in the contextof climate change is determined by many factors that collectively affect the institution’scapacity for dealing with change. These factors include the institution’s structure<strong>and</strong> mechanisms to affect change, ability to address complex technical information, recognitionof ecosystem service values, <strong>and</strong> need for actionable climate science.
108 <strong>Coastal</strong> <strong>Impacts</strong>, <strong>Adaptation</strong>, <strong>and</strong> <strong>Vulnerabilities</strong>Institutional STRUCTURE/MECHANISMS.It will be crucial to imbue all of our decisions (research, management, communications,<strong>and</strong> policy) with clear recognition as to the role climate change will play in their successor failure, <strong>and</strong> to incorporate uncertainty about the future into our planning.Hansen & Hoffman, 2010: pg. 33As discussed in the prior sections, consideration of climate change in coastal resourcemanagement <strong>and</strong> restoration efforts is growing in practice through a range of focused<strong>and</strong> exploratory efforts; however, in order to realize consideration of climate change,policies <strong>and</strong>/or directives are necessary to institutionalize consideration of climatechange in coastal management <strong>and</strong> restoration. Policies <strong>and</strong> directives have been established,such as the Maryl<strong>and</strong> Department of Natural Resources’ <strong>Climate</strong> Change Policythat directs the agency to “proactively pursue, design <strong>and</strong> construct habitat restorationprojects to enhance the resilience of bay, aquatic <strong>and</strong> terrestrial ecosystems to the impactsof climate change <strong>and</strong>/or increase on-site carbon sequestration” (Maryl<strong>and</strong> Departmentof Natural Resources, 2010: pg 14). Many more directives like this one will beneeded, particularly at the national scale, in order for climate resilience to be realized.Technical INFORMATION. Underst<strong>and</strong>ing the interactions between climatechange <strong>and</strong> the range of physical, chemical, <strong>and</strong> biological characteristics of coastal resourcesis complex (see Chapters 2 <strong>and</strong> 3 for an explanation of the nature of these complexities).Likewise, ascertaining how to incorporate consideration of climate changeinto coastal resource management <strong>and</strong> restoration efforts is difficult. Although sizablescientific confidence supports the need for activities that reduce non-climate stressors,the effectiveness of the measures that help systems adapt to climate change is not as evident,<strong>and</strong> their consideration requires a clear underst<strong>and</strong>ing of how a system functions<strong>and</strong> how it might be affected by climate change (Julius & West, 2008). In recognition ofthis need, a number of organizations, including non-profit, federal, state, <strong>and</strong> regionalpartners, have begun to develop frameworks (Figure 5-1) <strong>and</strong> exploratory guides to supportthe integration of climate change considerations into the restoration efforts (Glick etal., 2011; Hansen & Hoffman, 2010; Kane et al., 2011).Valuing ECOSYSTEM SERVICES. Recently, emphasis has been placed on the servicesthat ecosystems provide, such as storm surge buffers, clean water, <strong>and</strong> migratorybird habitat. In some cases an actual dollar value can be placed on the services provided,which has created new incentives for financial investments by the government, private,<strong>and</strong> corporate sectors in coastal resource protection <strong>and</strong> restoration (Cooley & Ol<strong>and</strong>er,2011). When managed effectively, protection or restoration of coastal ecosystems canprovide mutual societal, ecological, <strong>and</strong> financial co-benefits. This is an important newconcept because connecting the ecosystem services provided for greenhouse gas mitigationpurposes with adaptation needs is now conceptually possible. This may result innew mechanisms to fund costly adaptation strategies; for example, salt marsh restorationdesigned to be eligible for financial benefits such as carbon offset credits must demonstrate,among other factors, a life-expectancy of 75-100 years. In order to meet thesecriteria, the project design must take into account such external forces as sea-level rise,
<strong>Adaptation</strong> <strong>and</strong> Mitigation 109Figure 5-1 Framework for making restorationprojects in the Great Lakes climate smart.Source: Glick et al., 2011.which ensures long-term ecological benefits such as the ecological viability of the marsh.The third concomitant benefit to ecosystem services realized by the salt marsh restorationis the societal benefit of living-shoreline protection provided to upl<strong>and</strong> propertiesby existence of the marsh.Actionable CLIMATE Science. With the growing awareness of the need for adaptation,coastal resource managers are searching for immediate guidance on how to considerthe implications of climate change, including sea-level rise, temperature increase,<strong>and</strong> precipitation change, on key resource management issues. Although many haveassumed that progressively higher resolution climate models will solve this problem,information at the community, local, or site level is a long-term goal <strong>and</strong> ideal climateinformation will likely not be available in the near future (Kerr, 2011). Another gap isan underst<strong>and</strong>ing of how to make management decisions given the science we do have.5.3 Tools <strong>and</strong> ResourcesOne of the recommendations from the 2009 NCA (pg. 154) was to “Exp<strong>and</strong> capacity toprovide decision makers <strong>and</strong> the public with relevant information on climate change<strong>and</strong> its impacts.” Improved tools <strong>and</strong> trainings are essential to acting on this recommendation,supporting process st<strong>and</strong>ardization, replicability, simplification, <strong>and</strong> streamlining,<strong>and</strong> enhancing stakeholder engagement.In the context of climate change impacts <strong>and</strong> adaptation, the term “tools” has beenused to describe climate data, models, <strong>and</strong> sensitivity analysis to molecular markers <strong>and</strong>assays, GIS methods, step-by-step decision-making frameworks, regulatory <strong>and</strong> policymechanisms, <strong>and</strong> more. Here, we do not attempt to catalogue or capture the breadth of
110 <strong>Coastal</strong> <strong>Impacts</strong>, <strong>Adaptation</strong>, <strong>and</strong> <strong>Vulnerabilities</strong>climate-related decision support tools that exist <strong>and</strong> have not addressed more complexgeneral circulation models that project different climate scenarios. Instead, we focus onpolicy tools <strong>and</strong> what might broadly be considered assessment <strong>and</strong> decision supporttools <strong>and</strong> attempt to categorize different types of tools, illustrate trends in their utility<strong>and</strong> application <strong>and</strong> identify resources for helping to select appropriate tools.Assessment <strong>and</strong> Implementation ToolsA decade ago, the absence of applicable tools was a major impediment to climate-relatedefforts by coastal planners <strong>and</strong> managers; today, the issue is often a lack of familiaritywith available tools or the availability of an overwhelming number of tools. A growingnumber of efforts seek to catalog, classify, <strong>and</strong> organize tools relevant to climate assessment<strong>and</strong> adaptation (Center for Ocean Solutions, 2011; EBM Tools Network; Hagemannet al., 2011; IPCC WG2, 2007). Below, we highlight four categories of tools gearedtowards planning <strong>and</strong> implementation or towards assessment <strong>and</strong> analysis 9 .1. Planning <strong>and</strong> Implementation: These tools help planners, decision makers, <strong>and</strong>citizen groups step through a planning process that incorporates the informationneeded to assess climate risks to assets of local or regional importance while engaginga range of audiences.• Process Management such as guidance instruments (see Section 5.1). Examples:ICLEI ADAPT, NOAA CSC Roadmap for Adapting to <strong>Coastal</strong> Risk• Communication <strong>and</strong> Engagement. Examples: CanViz,NOAA <strong>Coastal</strong> CountySnapshots, The Nature Conservancy’s <strong>Coastal</strong> Resilience Tool for New York/Connecticut2. Assessment <strong>and</strong> Analysis: These tools help planners <strong>and</strong> natural resource managersto investigate how current <strong>and</strong> future conditions for the built <strong>and</strong> natural environmentmay be affected by climate change.• Mapping <strong>and</strong> Visualization. Examples: NOAA Sea-level rise <strong>and</strong> <strong>Coastal</strong>Flooding <strong>Impacts</strong> Viewer; The Nature Conservancy’s <strong>Coastal</strong> Resilience Tool forthe Gulf of Mexico• Data Access/Management/Analysis. Examples: Pacific Northwest <strong>Climate</strong>Sensitivity Database, Northeast <strong>Climate</strong> Data tool, USGS <strong>Coastal</strong> Vulnerabilityto Sea-level Rise Project• Projection, Simulation, <strong>and</strong> Modeling. Examples: Sea Level Affecting MarshesModel, <strong>Climate</strong> Wizard• Vulnerability Assessment. Examples: NatureServe <strong>Climate</strong> Change VulnerabilityIndex, USFS System for Assessing Vulnerability of Species (reviewed inBeardmore & Whitmore, 2011; Rowl<strong>and</strong> et al., 2011)• Scenario Development/Option Evaluation. Examples: MARXAN Software,COAST9 Inclusion of a specific tool as an example does not necessarily indicate endorsement.
<strong>Adaptation</strong> <strong>and</strong> Mitigation 1113. Advances in Technology: We highlight five trends in climate change tools. Table4-1 shows examples of tools that typify each trend.• Variety: The past three decades has seen a proliferation of tools used in a varietyof tasks from city planning to conservation. Much of this growth can be attributedto the rise of desktop computers <strong>and</strong> the introduction of geographic informationsystems (GIS).• Accessibility. Web-based <strong>and</strong> open-source tools have to fill the “digital divide”created by the need for proprietary GIS, software or highly specialized training.(Rozum, et al., 2005)• Sophistication of tools: Increasingly, tools address multiple factors such asthe combined effects of l<strong>and</strong> use <strong>and</strong> climatic change on water quality or integratinginformation <strong>and</strong> assessment across biomes or taxa by exploring theprojected distribution of tree <strong>and</strong> bird species under several climate changescenarios.• Sophistication of tool use: Some users are combining tools into interoperabletoolkits for analyses <strong>and</strong> decision support that single tools cannot provide,including assessing multiple scenarios for management decisions, outcomes, orclimate impacts.4. Locally specific applications: Tools specifically addressing climate change in thecontext of particular sectoral or regional needs are also being developed at a rapidpace.Selecting <strong>and</strong> Using Tools AppropriatelyAs more tools are developed, mechanisms to guide users to the most appropriate toolsfor their context <strong>and</strong> question are increasingly important. The dearth of effective guidancehas been frequently noted (e.g., Mcleod et al., 2010); common complaints includeoutdated information or guidance that is either too generic, too specific to particular sectorsor geographies, or too complex.Growing attention has focused on addressing this need, including the developmentof case studies focused on tool selection <strong>and</strong> use such as NOAA’s Digital Coast, EBMTools Network, workshops or “tools cafes” targeting particular sectors or regions (Culveret al., 2010, regional workshops in California <strong>and</strong> the Great Lakes, <strong>and</strong> tools cafes inthe National Conservation Training Center’s Vulnerability Assessment trainings), <strong>and</strong>tools guidebooks (COS, 2011). The 2008 revision of UNFCCC’s Compendium on Methods<strong>and</strong> Tools to Evaluate <strong>Impacts</strong> of, <strong>and</strong> Vulnerability <strong>and</strong> <strong>Adaptation</strong> to, <strong>Climate</strong> Change is themost comprehensive effort to date, providing information on more than 100 tools ina st<strong>and</strong>ardized format. The sheer scope of such a comprehensive compendium makesit difficult to search in a static format; consequently, several groups have developedsearchable on-line tools databases such as the <strong>Climate</strong> <strong>Adaptation</strong> Knowledge Exchange<strong>and</strong> the EBM Tools Online Database.Despite the above efforts, few, if any, systematic assessments have been made of howgroups or individuals select <strong>and</strong> access tools or of the degree to which particular toolsare actually useful in various settings (Center for Ocean Solutions, 2011; Hagemann et
112 <strong>Coastal</strong> <strong>Impacts</strong>, <strong>Adaptation</strong>, <strong>and</strong> <strong>Vulnerabilities</strong>Table 5-1: Examples of the trends in tool development for climate adaptation planningTrend Type Tool ReferenceVarietyHabitat Modeling Sea Level Affecting Marshes Model Chu-Agor et al., 2011Game-based engagement Coast Ranger MS Pontee <strong>and</strong> Morris, 2011<strong>Climate</strong> Downscaling <strong>Climate</strong>Wizard Girvetz et al., 2009AccessibilityScenario Planning<strong>Coastal</strong> Resilience Tool for NewYork/ConnecticutFerdaña et al., 2010MultistressorNonpoint Source Pollution <strong>and</strong>Erosion Comparison Tool(NSPECT)NOAA <strong>Coastal</strong> ServiceCenterSophistication ofToolsMultispecies <strong>Climate</strong> Change Atlas Iverson et al., 2011MultihabitatMarxanGreen et al., 2009, Gameet al., 2008Sophistication ofTool UseCommunication <strong>and</strong>EngagementCommunityViz (Placeways),NatureServe Vista, NOAACommunity VulnerabilityAssessment ToolCrist et al., 2009Oil spill remediation<strong>Climate</strong> Assessment <strong>and</strong> ProactiveResponse Initiative (CAPRI)Industrial Economic,Incorporated, 2011Specificity of ToolsWater Utilities<strong>Climate</strong> Resilience Evaluation <strong>and</strong>Awareness Tool (CREAT)EPA, 2012cRegional ecosystemclimate impactsSan Francisco Bay Sea-level Rise Tool Veloz et al., 2011
<strong>Adaptation</strong> <strong>and</strong> Mitigation 113al., 2011). Such systematic assessments will be essential to supporting informed tool selectionby potential users (NRC, 2009).Although specifics vary, most guidance on tool selection centers on roughly the samecore idea: the importance of selecting tools based on an assessment of user goals, objectives,context, resources, <strong>and</strong> skills rather than trying to make management or researchproblems fit within the framework of a previously selected tool. Commonly expressedconcerns are that users will select inappropriate tools based on what sounds impressive,seems easy, or has been used by others they know (for example, using a rankingtool when the management question is how to reduce the vulnerability of a particularspecies), or will seek or put too much emphasis on projections for species distributionchanges or similar ecological shifts when data are insufficient to support such analyses.These problems clearly occur; what is unclear is how common they are <strong>and</strong> how muchtime is wasted, both of which could lead to poor decision-making. Further, no clearthreshold has been established for when data or analyses are too limited or flawed to bevalid; increasing guidance on how to decide when available data cannot support the desiredtool or what caveats must be included with the outputs would be extremely useful.Another commonly expressed concern relates to the need to provide support <strong>and</strong>guidance for decision making under conditions of uncertainty. Tools can be designed<strong>and</strong> used to facilitate <strong>and</strong> improve vulnerability assessment <strong>and</strong> adaptation planning regardlessof gaps or flaws in the data (NRC, 2009). By using a variety of tools or runningthem multiple times with a range of different parameters such as sea-level-rise rates,exploring a range of plausible future scenarios is possible. Formal or informal sensitivityanalyses can help to identify the variables with the largest uncertainty as well as thosevariable that have the greatest influence on the decisions at h<strong>and</strong> or, for purely scientificendeavors, the variables with the greatest influence on the system under consideration(Stralberg et al., 2011).Policy <strong>and</strong> Regulatory ToolsPolicy options for adapting to climate change include both a broad array of governmentalauthorities <strong>and</strong> a range of possible pathways. The governmental activities includeregulatory, taxation, planning, spending, <strong>and</strong> the general facilitation of private action(Grannis, 2011). The possible pathways include protecting existing l<strong>and</strong> uses from thesea, which includes shoreline armoring; relocating human activities through retreat; <strong>and</strong>modifying human activities to enhance adaptive natural capacity of ecosystems by reducingstressors).Governments are evaluating how to factor climate change into spending decisionsto conserve public funds over the long-term <strong>and</strong> ensure that public assets such as roadways<strong>and</strong> wastewater treatment facilities are resilient. Maryl<strong>and</strong>’s plan recognizes thatpublic investments in shore protection will be needed to protect critical facilities. Otherstates, such as California, are examining how they can direct funding to protect coastalresources to acquire vulnerable l<strong>and</strong>s for conservation, to provide room for ecosystemsto migrate inl<strong>and</strong> to keep pace with sea-level rise, to provide a buffer for infrastructure,<strong>and</strong> to buy out vulnerable property owners.Governments are also re-evaluating how they regulate coastal areas. Regulatoryoptions include using zoning powers to require additional setbacks from shorelines,
114 <strong>Coastal</strong> <strong>Impacts</strong>, <strong>Adaptation</strong>, <strong>and</strong> <strong>Vulnerabilities</strong>density restrictions, clustered subdivisions, <strong>and</strong> building-size limits (NOAA, 2010). InMaryl<strong>and</strong>, the state is instituting regulatory measures through its Living Shorelines ProtectionAct to encourage l<strong>and</strong>owners to use soft alternatives to shoreline armoring wherefeasible. Some authors have suggested the use of the “rolling easement” approach inwhich l<strong>and</strong>owners are entitled to build <strong>and</strong> use their l<strong>and</strong> as long as it remains dry buthave no expectation of preventing the rising sea from reclaiming their l<strong>and</strong> (Titus, 1998).Some states, such as Oregon, Texas, South Caroline, Rhode Isl<strong>and</strong>, Massachusetts, <strong>and</strong>Maine, have applied this approach in statutes or regulations. A recent federal report emphasizesthat rolling easements can also be implemented by the private sector throughconservation easements or traditional property law arrangements (Titus, 2011). Thesereports acknowledge that the timing for implementing any regulatory approach will becritical; although coastal armoring is well understood <strong>and</strong> generally requires a lead timeof a decade or less, nonstructural pathways, such as a gradual retreat from the coast, areless tested <strong>and</strong> may require a lead time of several decades.Governments are also considering tax- <strong>and</strong> market-based incentives to promote differentpathways. Some examples include incentives such as conservation easements toencourage l<strong>and</strong>owners to conserve vulnerable l<strong>and</strong>s, density bonuses <strong>and</strong> transferrabledevelopment rights to develop sites upl<strong>and</strong>, or tax rebates for homeowners who designstructures to exceed building code requirements by elevating structures to increaseresiliency.Several different approaches have been proposed for evaluating responses to employ<strong>and</strong> evaluating the tradeoffs. In choosing options, some of the issues that policymakersare weighing include: the relative economic costs <strong>and</strong> benefits of a particular responses;how protective the response is for the health, safety, <strong>and</strong> welfare of the community;<strong>and</strong> the environmental benefits or impacts of a response (NOAA, 2010). To be successful,chosen responses must also be administratively <strong>and</strong> legally feasible. Administrativechallenges to this include budget <strong>and</strong> staffing constraints, <strong>and</strong> technical complexity(IPCC, 1990; NOAA, 2010); government actors also must have legal authority to implementa response <strong>and</strong> responses must be consistent with existing laws <strong>and</strong> constitutions(Grannis, 2011).5.4 <strong>Coastal</strong> Mitigation OpportunitiesThe coastal zones of the U.S. have the potential to host many of our climate changemitigation efforts. This includes siting of non-greenhouse emitting energy generationthrough off-shore wind, tidal, <strong>and</strong> wave generation <strong>and</strong> ocean thermal conversion todisplace or replace fossil fuel combustion methods of generation. Recent Departmentof Energy reports indicate that about one-third of the country’s annual electricity needscould be generated through wave <strong>and</strong> tidal current (EPRI, 2011; Haas et al., 2011). Additionally,initial exploration of the concomitant carbon sequestration benefit may be realizedwhen new resource management practices are employed in coastal habitats such assalt marshes, seagrasses, <strong>and</strong> mangroves.<strong>Coastal</strong> Renewable TechnologiesAs the U.S. develops strategies to reduce greenhouse gas emissions <strong>and</strong> foster energy
<strong>Adaptation</strong> <strong>and</strong> Mitigation 115independence, siting of renewable energy installations will become a growing issue.Due to the density of coastal populations <strong>and</strong> the unique features of coastal systems,much of this development will continue to occur on America’s coastlines <strong>and</strong> nearshorewaters. Some of this potential is discussed here.Offshore Wind. U.S. offshore winds resources (Figure 5-2) have an estimated grosspotential to generate capacity of more than 4,000 GW or roughly four times the generatingcapacity currently carried on the U.S. electric grid (NREL, 2010). The NationalRenewable Energy Laboratory (NREL, 2010) projects that U.S. coastline <strong>and</strong> Great Lakeswind facilities could provide 20 percent of the nation’s electricity by 2030.Figure 5-2 U.S. offshorewind resource by region<strong>and</strong> depth for annualaverage wind speed sitesabove 7.0 m/s. Source:NREL, 2010.Ocean Energy. Wave, tidal/current, <strong>and</strong> ocean thermal energy conversion (OTEC)technologies remain an emerging, although relatively untapped, opportunity to diversifyU.S. energy resources. Estimations of the energy available from these sources issignificant to the U.S. energy budget. Pilot generation projection of wave <strong>and</strong> tidal energyexists in the U.S., with over sixty more having received preliminary Federal EnergyRegulatory Commission permits (DOE, 2011).<strong>Coastal</strong> Renewable Energy Science GapsIn the report U.S. Marine <strong>and</strong> Hydrokinetic Renewable Energy Roadmap, the Ocean RenewableEnergy Coalition (OREC, 2011) identified the following 6 priority research areas:Seabed Attachments: Foundations, anchors, <strong>and</strong> mooring for floating <strong>and</strong> bottomfixedinstallations;Engineering Design: Develop design st<strong>and</strong>ards <strong>and</strong> best practices for designs coveringstructural, mechanical, <strong>and</strong> electrical systems with failure modes analysis;
116 <strong>Coastal</strong> <strong>Impacts</strong>, <strong>Adaptation</strong>, <strong>and</strong> <strong>Vulnerabilities</strong>Table 5-2: Total vs. recoverable wave energy in the U.S.Total wave energy(TWh/yr)Recoverable waveenergy (TWh/yr)Total 2,640 1170West Coast 590 250East Coast 240 160Gulf of Mexico 80 60Alaska 1570 620Hawaii 130 80Puerto Rico 30 20Source: EPRI, 2011.Materials: Develop environmentally friendly protection coatings, biodegradablelubricants,<strong>and</strong> oils as well as advanced structural <strong>and</strong> foundation materials <strong>and</strong> characterizestructural <strong>and</strong> fatigue properties;Lifecycle <strong>and</strong> Manufacturing: Manufacturing processes for low-cost <strong>and</strong> high-volumetransportation <strong>and</strong> h<strong>and</strong>ling as well as rapid low-cost assembly <strong>and</strong> installation;Power Takeoff <strong>and</strong> Control: Develop highly efficient power take-off systems with innovative<strong>and</strong> adaptive control strategies to maximize energy capture <strong>and</strong> minimizedamaging loads; <strong>and</strong>Installation, Operations <strong>and</strong> Maintenance (O&M): Develop low-cost rapid installationtechnologies for arrays, <strong>and</strong> methods to perform O&M during short weatherwindows.Managing Living <strong>Coastal</strong> Resources for Carbon CaptureIn addition to technology-based climate change mitigation efforts, the adoption of newresource management strategies (see section 5.3) for coastal <strong>and</strong> estuarine ecosystemservices, including habitat protection <strong>and</strong> active restoration efforts, may also result incarbon sequestration.
<strong>Adaptation</strong> <strong>and</strong> Mitigation 117The variety of ecosystem services <strong>and</strong> ecological, economic, <strong>and</strong> societal benefits ofhealthy coasts <strong>and</strong> estuaries are well-documented in a new report, Jobs <strong>and</strong> Dollars: BigReturns from <strong>Coastal</strong> Habitat Restoration (Restore America’s Estuaries, 2011). Our nationhas lost more than half of its wetl<strong>and</strong>s in the past 200 years (Dahl & Johnson, 1991), <strong>and</strong>the planet has lost a quarter of its salt marshes <strong>and</strong> freshwater tidal marshes <strong>and</strong> continuesto lose 1-2 percent per year, making these ecosystems some of the most threatened inthe world (Convention on Biological Diversity, 2010). Moreover, between 2004 <strong>and</strong> 2009,the U.S. lost 110,000 acres of coastal wetl<strong>and</strong>s (Dahl, 2011).However, recent science has demonstrated that some of these same endangeredcoastal resources—coastal marshes, mangroves <strong>and</strong> sea grasses—may be able to sequester<strong>and</strong> store large quantities of carbon dioxide (CO2) in plants <strong>and</strong> the soils below themin a process termed blue carbon (Crooks et al., 2011). In the first meter of coastal wetl<strong>and</strong>sediments alone, soil organic carbon averages 500 t CO2e/ha (tonnes of carbon dioxideequivalent per hectare) for sea grasses, 917 t CO2e/ha for salt marshes, 1060 t CO2e/ha forestuarine mangroves, <strong>and</strong> nearly 1800 t CO2e/ha for oceanic mangroves (Murray et al.,2011). If destroyed, degraded, or lost, these coastal ecosystems become globally significantsources of carbon dioxide emitted into the atmosphere <strong>and</strong> the ocean. For example,in California’s Sacramento/San Joaquin Delta, drainage of 1,800 kilometers 2 of wetl<strong>and</strong>shas released 0.9 giga tons, or billion tons, of carbon dioxide over the last century. An additional5 to 7.5 million tons of CO2continue to be released on average from this Deltaeach year (Crooks et al., 2011). Additionally, the stresses of climate change, increasingtemperature, sea-level rise, <strong>and</strong> acidification could challenge these ecosystems <strong>and</strong> leadto the release of this carbon.In addition to the loss of carbon stores, when wetl<strong>and</strong>s are degraded or destroyed,the ongoing sequestration capacity of wetl<strong>and</strong>s is lost as well. <strong>Coastal</strong> wetl<strong>and</strong>s sequestercarbon at rates three to five times greater than global rates observed in mature tropicalforests: 6 to 8 t CO2e/ha compared to 1.8–2.7 t CO2e/ha (Murray et al., 2011). Althoughthe capacity of the systems to sequester carbon may be diminished when the systems arestressed by climate change. For example, when a coastal marsh is stressed due to risingsalinities associated with sea-level rise, the capacity for the wetl<strong>and</strong> to store carbon maydiminish through time.Protecting the remaining coastal wetl<strong>and</strong>s in the U.S. <strong>and</strong> globally <strong>and</strong> restoring thosethat have been degraded or destroyed (McLeod et al., 2011) may provide meaningfulcontributions to climate change mitigation strategies. Carbon storage, when consideredas an ecosystem service provided by coastal wetl<strong>and</strong>s, could provide a strong incentivefor protection <strong>and</strong> restoration through payments for blue carbon (Sifleet et al., 2011).However many of these ecosystems have been shown to release greenhouse gases underthe conditions associated with climate change (Shindell et al., 2004; Vann & Megonigal,2003), indicating that the permanence of coastal carbon must be carefully evaluated. Furthermore,oceans <strong>and</strong> coastal ecosystems have not been part of the policy dialogue forreducing greenhouse gases (Nellemann et al., 2009).A key impediment to coastal conservation such as wetl<strong>and</strong>s protection <strong>and</strong> restorationefforts is adequate assistance to undertake projects. In the U.S., the restorationcommunity is well established but has a backlog of high-priority, shovel-ready projectsthat amount to billions of dollars; for example, under the American Recovery <strong>and</strong>
118 <strong>Coastal</strong> <strong>Impacts</strong>, <strong>Adaptation</strong>, <strong>and</strong> <strong>Vulnerabilities</strong>Reinvestment Act of 2009, NOAA was provided $167 million for coastal habitat restorationbut received project applications totaling more than $3 billion (NOAA press release,June 7, 2011).Carbon Sequestration <strong>and</strong> Capture Science GapsThe following recommendations were developed by the International Working Groupon <strong>Coastal</strong> “Blue” Carbon (IWGCBC, 2011): 10• Develop inventory <strong>and</strong> accounting methodologies for coastal carbon to facilitatetheir inclusion in incentive agreements for conservation <strong>and</strong> effective managementof coastal systems;• Conduct carbon inventories in coastal areas identified as likely having highcarbon storage <strong>and</strong> sequestration capacity. Include existing <strong>and</strong> at-risk potentialareas of high carbon emissions;• Conduct targeted research <strong>and</strong> monitoring to more accurately quantify thegreenhouse gas emissions resulting from degradation, conversion, <strong>and</strong> destructionof all relevant coastal ecosystems;• Establish a network of field projects that demonstrate:1. The capacity for carbon storage in coastal systems <strong>and</strong> the emissionsresulting from degradation, conversion, <strong>and</strong> destruction of those systems;<strong>and</strong>2. The feasibility of community monitoring approaches, management intervention,<strong>and</strong> incentives for maintaining carbon-rich systems;• Conduct research quantifying the consequences of different coastal restoration<strong>and</strong> management approaches on carbon storage <strong>and</strong> emissions in coastal <strong>and</strong>nearshore marine ecosystems; <strong>and</strong>• Develop st<strong>and</strong>ards <strong>and</strong> methods to translate remote sensing measurements intoaccurate estimates of carbon in coastal ecosystems, because remote sensing iscurrently the only method to efficiently map <strong>and</strong> monitor mangrove <strong>and</strong> tidalmarshes at regional <strong>and</strong> global scales.Additional gaps not mentioned in the IWGCBC report include:• Assessing the effects of climate change on these coastal ecosystems, the potentialefficacy of adaptation measures to ameliorate these effects, <strong>and</strong> the permanenceof blue carbon due to the projected change;• Evaluating the implications of coastal development plans on storage <strong>and</strong>permanence; <strong>and</strong>• Underst<strong>and</strong>ing the carbon cycle <strong>and</strong> residence times in coastal habitats.10 This working group was formed in 2011 by Conservation International (CI), the International Union forConservation of Nature (IUCN), <strong>and</strong> the Intergovernmental Oceanic Commission (IOC) of UNESCO.
Chapter 6Information Gaps <strong>and</strong> Science Neededto Support Sustainable CoastsAs discussed in the prior chapters, climate change is altering ecosystems on a globalscale <strong>and</strong> impacting human welfare <strong>and</strong> health. The effects are highly varied <strong>and</strong> mostpronounced along coasts. Furthermore, impacts to coastal regions are likely to be highlyvariable <strong>and</strong> accelerated in decades ahead. A key issue for coastal resource managersis to identify how, where, <strong>and</strong> when to adapt to the changes that will result from sealevelrise <strong>and</strong> changes in climate. These require cost-effective methods that benefit orminimize impacts to both the natural environment <strong>and</strong> human populations. Another importantissue is deciding how to fund such measures. To facilitate adaptation decisions,policy makers need credible scientific information. Predicting sea-level rise impactssuch as shoreline change, wetl<strong>and</strong> loss, <strong>and</strong> other ecosystem impacts with a high degreeof confidence <strong>and</strong> precision is not possible at this time although the general scientificunderst<strong>and</strong>ing of coastal response to climate change is well established.Related effects of climate change, including changed storm regimes, temperature,precipitation, runoff, drought, <strong>and</strong> sediment supply add to the difficulty of providingplace-specific, accurate, <strong>and</strong> reliable information. Lack of underst<strong>and</strong>ing of cumulativemulti-stressor interactions in ecosystems <strong>and</strong> the mechanisms of thresholds shifts alsoinhibits predictions of future conditions. An integrated scientific program of sea levelstudies that seeks to learn from the historic <strong>and</strong> recent geologic past <strong>and</strong> monitors ongoingphysical <strong>and</strong> environmental changes will improve the level of knowledge <strong>and</strong>reduce the uncertainty about potential responses of coasts to sea-level rise <strong>and</strong> otherdrivers of coastal change. Outcomes of both natural- <strong>and</strong> social-scientific research willalso support decision making <strong>and</strong> adaptive management for the coastal zone. The mainelements of a potential science strategy <strong>and</strong> their interrelationships are shown in Figure6-1, which was adapted from CCSP 4.1, Thieler et al., Chapter 14 (CCSP, 2009), followedby key research needs <strong>and</strong> tools for coastal adaptation planning that result from this assessment<strong>and</strong>/or are adapted from publications shown below.Science Research Needs to Support Sustainable <strong>Coastal</strong>Management 11• An assessment of the potential impacts of climate change on coastal <strong>and</strong>OCS energy development is confounded by a lack of baseline information,11 (CCSP, 2009; Culver et al., 2010; NRC, 2010a,b; <strong>and</strong> resulting from this assessment <strong>and</strong>/or adapted fromMoser et al. in review;)119
120 <strong>Coastal</strong> <strong>Impacts</strong>, <strong>Adaptation</strong>, <strong>and</strong> <strong>Vulnerabilities</strong>Figure 6-1 Schematic flowdiagram summarizing a sciencestrategy for improvementof scientific knowledge <strong>and</strong>decision-making capability thatcan address the impacts offuture sea-level rise. Source:CCSP, 2009.modeling uncertainties, <strong>and</strong> complex interactions among climate drivers <strong>and</strong>impacts that are only partially understood. Considering the current importanceof coastal <strong>and</strong> offshore energy production to the social <strong>and</strong> economic securityof the U.S., a methodical climate change vulnerability <strong>and</strong> impact assessment isneeded to support adaptation in this sector of the national economy.• Resolving uncertainties about the rates of l<strong>and</strong>-ice decline is a major hindrancein modeling the rate of future sea-level rise. Although advances in observing<strong>and</strong> predicting the decline of major ice sheets have been made since thepublication of the last international assessment (IPCC, 2007), confidence inpredicting future sea-level rise has not increased substantially. The effect of
Information Gaps <strong>and</strong> Science Needed to Support Sustainable Coasts 121this uncertainty is illustrated in the wide range of end points in the projectedamount of sea-level rise through the end of this century (described in Chapter2.3). Confidence in predictions of regional change in mean sea level is evenlower, as are projections at decadal scales. Advancing our underst<strong>and</strong>ing of thedrivers of sea-level change <strong>and</strong> moving beyond the semi-empirical approachpresented in this report are research needs that are shared among all U.S.coastal communities <strong>and</strong> sectors of the coastal economy described in Chapter 4of this report.• Improved monitoring <strong>and</strong> collection of baseline data for coastal environmentsthrough linking networks of observing systems, developing time series dataon environmental <strong>and</strong> l<strong>and</strong>scape changes, <strong>and</strong> assembling fully accessible<strong>and</strong> searchable baseline data on coastal l<strong>and</strong>forms, topography/bathymetry,animals, <strong>and</strong> plants for the coastal zone. This includes data on processes, tides,water level, waves, currents, precipitation, shoreline change, ocean circulationpatterns, ocean chemistry, temperature, coastal processes, <strong>and</strong> sedimentbudgets.• Improved underst<strong>and</strong>ing of ecosystems’ <strong>and</strong> species’ responses to basic environmentalforces such as changes in temperature, precipitation, <strong>and</strong> chemistryof oceans <strong>and</strong> water bodies.• Improved underst<strong>and</strong>ing of natural <strong>and</strong> human-influenced coastal systemsthrough use of historic <strong>and</strong> geologic records of coastal change, increasedknowledge of sea-level rise <strong>and</strong> coastal change over the past few millennia,identification of tipping points in coastal systems, <strong>and</strong> records that more closelyrelate past changes in climate to coastal change.• Improvements in predictive capabilities of coastal change through improvedquantitative assessment methods <strong>and</strong> integrating studies of the past <strong>and</strong>present into predictive models. Improved models are needed to assemble <strong>and</strong>process environmental data <strong>and</strong> aid in analysis as well as to make reliableprojections of future conditions such as rates of sea-level rise <strong>and</strong> ice-sheetmelting, changes in storm characteristics, <strong>and</strong> rates of shoreline retreat <strong>and</strong>wetl<strong>and</strong> change.• Improved place-based underst<strong>and</strong>ing of the societal drivers of vulnerability<strong>and</strong> impacts of sea-level rise <strong>and</strong> related coastal changes through improveddata collection <strong>and</strong> integration, which must be followed up by communicatingthese findings to decision-makers. This includes generating consistent sea-levelrisescenarios <strong>and</strong> projections across federal agencies to support local planning<strong>and</strong> includes projection on the amount of sea-level rise within a region as wellas on storm information <strong>and</strong> the general time frame within which these changesare anticipated.• Research on adaptation, hazard risk reduction, <strong>and</strong> avoidance measures,including the cost, feasibility, side-effects, barriers, <strong>and</strong> acceptability, to supportadaptation planning <strong>and</strong> decision making.• Providing improved access to data, resources, <strong>and</strong> integrated assessmentsfor decision makers, thus facilitating the transfer of knowledge about risks,
122 <strong>Coastal</strong> <strong>Impacts</strong>, <strong>Adaptation</strong>, <strong>and</strong> <strong>Vulnerabilities</strong>vulnerabilities, <strong>and</strong> adaptation choices, <strong>and</strong> educating the public about consequences<strong>and</strong> alternatives.• Improved coastal vulnerability assessments, including human infrastructure<strong>and</strong> ecosystems, by including all coastal regions <strong>and</strong> incorporating multiplefactors such as population, l<strong>and</strong> use, critical infrastructure, natural resources,economic information, social vulnerability <strong>and</strong> other community characteristicsso that potential outcomes can be examined in a holistic framework of environmental,social, economic, <strong>and</strong> other non-climate factors that influence overallexposure <strong>and</strong> adaptive capacity.• Research on the scientific underst<strong>and</strong>ing of cumulative multi-stressor interactions<strong>and</strong> threshold shifts in ecosystems. This includes methods to identifythe triggers of threshold responses <strong>and</strong> to anticipate the likely trajectory ofpost-threshold states under a range of future scenarios of climate <strong>and</strong> l<strong>and</strong>-usechange.• Improved long-term, homogeneous, observational datasets <strong>and</strong> geologic proxyrecords for monitoring <strong>and</strong> measuring climate changes. The science of underst<strong>and</strong>ingclimate change <strong>and</strong> being able to make reliable projections of futureconditions will benefit from an array of linked observations <strong>and</strong> monitoringof basic factors such as temperature, rainfall, ocean circulation, waves <strong>and</strong>currents, ocean chemistry, sea level elevation, shoreline change, storm characteristics,<strong>and</strong> changes to glaciers <strong>and</strong> ice sheets. Maintaining an array of satellitesystems for observations is critical.• Developing advanced statistical analysis techniques for examining observations<strong>and</strong> models of the climate system <strong>and</strong> for rigorously comparing observationswith models results.• Improving the integration of existing long-term climate, ocean, <strong>and</strong> ecosystemobservations with human-health surveillance is necessary to predict <strong>and</strong> reducehuman-health risks related to climate change in coastal areas.• Providing collaboration teams of researchers <strong>and</strong> practitioners across multipledisciplines including oceanography, climate, biology, <strong>and</strong> public health arecritical to develop <strong>and</strong> apply useful decision-support tools that reduce publichealthrisks.• Improving legal frameworks <strong>and</strong> administrative structure <strong>and</strong> tools as well asdata on zoning, permitting regimes, legislative restrictions, etc.Science-Based Tools Needed for <strong>Coastal</strong> Management <strong>and</strong> <strong>Adaptation</strong> PlanningThe tools necessary for adaptation planning are difficult to prioritize because they willdepend upon the community needs as well as where each community is in the planningprocess. <strong>Adaptation</strong> tools need to be understood in terms of input data requirements,assumptions of the method, <strong>and</strong> the reliability <strong>and</strong> utility of the outputs. A suite of toolsthat work together to support planning <strong>and</strong> decision making is described below.Communication Tools. The tools that can facilitate coastal stakeholder engagement,visioning, <strong>and</strong> consensus building include:
Information Gaps <strong>and</strong> Science Needed to Support Sustainable Coasts 123• Definitions to establish a common language to discuss climate impacts <strong>and</strong>adaptation strategies;• Tools to educate the public on the science, impacts, probability, <strong>and</strong> risk;• Guidance <strong>and</strong> best practices for the planning process; <strong>and</strong>• Tools for facilitation <strong>and</strong> conflict management.Monitoring <strong>and</strong> MODELING Tools. Tools for monitoring <strong>and</strong> modeling current<strong>and</strong> future environmental conditions include:• Estimates of sea-level rise that are useful at regional <strong>and</strong> local levels for comparabilityacross jurisdictional boundaries;• St<strong>and</strong>ards <strong>and</strong> data architecture to integrate existing databases of observationsof water levels <strong>and</strong> other relevant data;• Advanced models to improve scientific underst<strong>and</strong>ing <strong>and</strong> allow for betterquantification of uncertainities:−−Storm surge models with wave measurements;−−Advanced climate <strong>and</strong> earth-system models;−−Improved estimates of past <strong>and</strong> projected future climate-forcing agents;−−Geomorphic models;−−Geospatial models for sea-level rise;−−Flooding/inundation models;−−Habitat models;−−Long-term erosion <strong>and</strong> accretion models; <strong>and</strong>−−El Niño Southern Oscillation/climatological impact projections.• Downscaling techniques for these models for use in regional or smaller scalescenarios.Visualization <strong>and</strong> SCENARIO-BUILDING Tools. The tools that would helpcommunities identify <strong>and</strong> explore alternative adaptation solutions include:• Visualizations using familiar viewers such as Google Earth for different sea-levelrise, storm frequency, <strong>and</strong> inundation scenarios that are interactive, offer planar<strong>and</strong> oblique views, <strong>and</strong> show critical infrastructure, relevant l<strong>and</strong>marks, <strong>and</strong>other information that allows communities to underst<strong>and</strong> impacts;• Definitions <strong>and</strong> analysis of economic impacts <strong>and</strong> loss;• Conversions of vulnerability into risk information;• Assessments of economic, social, <strong>and</strong> physical risk;• Valuations of ecosystem services in monetary <strong>and</strong> nonmonetary terms; <strong>and</strong>• Scenario evaluations that:−−Identify key assumptions;−−Test alternative outcomes;
124 <strong>Coastal</strong> <strong>Impacts</strong>, <strong>Adaptation</strong>, <strong>and</strong> <strong>Vulnerabilities</strong>−−−−Identify signposts <strong>and</strong> thresholds based on monitoring data; <strong>and</strong>Evaluate policy tradeoffs based on key unknowns.Implementation Tools. Tools useful to build institutional capacity <strong>and</strong> implementadaptation include:• Long-term policy analysis tools to help choose among options;• Database of case studies <strong>and</strong> best practices that can be queried;• Resources such as a clearinghouse or points of contact to underst<strong>and</strong> agencyactivities <strong>and</strong> potential funding sources;• Evaluation tools to assess the effectiveness of adaptation strategies;• Operational tools that address current conditions <strong>and</strong> short-term risk;• Engineering tools for coastal protection, relocation, <strong>and</strong> restoration; <strong>and</strong>• Evaluation tools to assess the effectiveness of implementation of adaptationstrategies.Future Research – Local vs. Regional Studies, Infrastructure, Monitoring, <strong>and</strong>Co-BenefitsThe research on coastal vulnerability includes some regional studies using comparableindicators <strong>and</strong> methods <strong>and</strong> an array of locally-oriented case studies. Although thesetwo approaches provide valuable information about social vulnerability, an importantresearch gap remains regarding their ability to inform decision making about risk-basedadaptation. The local case studies generally engage the more specific issues within acommunity but fail to offer comparability across larger areas (Frazier et al., 2010b; Noss,2011; Tang et al., 2011). The regional approaches provide that comparability by relyingon commonly collected indicators such as demographics, but they are simultaneouslylimited in the types of locally-specific considerations they are able to incorporate consistently.Addressing the need for comparability <strong>and</strong> specificity to inform adaptation decisionmaking at local, regional, <strong>and</strong> national scales is a key challenge in this area.A robust coastal monitoring, surveillance, <strong>and</strong> observation system that integratesphysical, biological, <strong>and</strong> key social parameters, <strong>and</strong> delivers early warning <strong>and</strong> predictiveinformation, will also be critical to better prepare for changes in climate across timescales. A sustained integrated system establishes baseline information, which is sorelyneeded to underst<strong>and</strong> the impact of climate <strong>and</strong> to provide trustworthy guidance tocoastal populations following natural disasters <strong>and</strong> other climate-related changes (Jochens,2010).
Appendix AChesapeake Bay Case StudyTable of Contents1: Introduction2: <strong>Climate</strong> Change <strong>Impacts</strong> on Water Quality <strong>and</strong> EquaticEcosystems for the Chesapeake Bay2.1 Changes in Physical <strong>Climate</strong>2.2 <strong>Impacts</strong> on Biochemistry <strong>and</strong> Water Quality2.3 <strong>Impacts</strong> on Ecosystems3: <strong>Climate</strong> Change Scenarios for the ChesapeakeBay4: Overview of State Level <strong>Adaptation</strong> Planning <strong>and</strong>Implementation Across the Chesapeake Bay4.1 Maryl<strong>and</strong>4.2 Pennsylvania4.3 Virginia5: References1: IntroductionThe Chesapeake Bay (the Bay) is located in the Mid-Atlantic <strong>and</strong> is the largest estuaryin the U.S. The watershed is approximately 64,000 square miles <strong>and</strong> covers parts of theDistrict of Columbia <strong>and</strong> six states: New York, Pennsylvania, Delaware, Maryl<strong>and</strong>, WestVirginia, <strong>and</strong> Virginia . About 17 million people live in the watershed, with approximately10 million people along or near the shores.Since the 1600s, l<strong>and</strong> cover in the Bay has changed significantly due to development,with 1.7 million acres of the Bay watershed developed between 1600 <strong>and</strong> 1950 <strong>and</strong>125
126 <strong>Coastal</strong> <strong>Impacts</strong>, <strong>Adaptation</strong>, <strong>and</strong> <strong>Vulnerabilities</strong>another 2.7 million acres between 1950 <strong>and</strong> 1980. With development, the Bay has losthalf of the forested shorelines, over half of the wetl<strong>and</strong>s, about 80 percent of underwatergrasses, <strong>and</strong> more than 98 percent of the oysters. The result has been a general decline inthe health of the Bay.Several states in the watershed have made a voluntary pledge to “Save the Bay” bycreating a blueprint for restoring the Bay’s health. On May 12, 2009, President Obamasigned the Chesapeake Bay Protection <strong>and</strong> Restoration Executive Order (Executive Order13508) to “protect <strong>and</strong> restore the health, heritage, natural resources, <strong>and</strong> social <strong>and</strong>economic value of the Nation’s largest estuarine ecosystem <strong>and</strong> the natural sustainabilityof its watershed.” The restoration of the water quality <strong>and</strong> aquatic ecosystems inthe Bay has proven to be difficult <strong>and</strong> will only become more complex with the addedimpacts of climate change.The selection of the Bay as a case study in this chapter of the NCA was based on severalfactors. Managing the Bay requires coordination among several states, making it atruly regional effort spanning a large geographic area. The Bay is a nationally importantresource that is in critical condition; a significant regulatory commitment has been madeto this area <strong>and</strong> substantial monitoring efforts are underway to support its restoration.Although future climate conditions are likely to be warmer, the magnitude <strong>and</strong> rateof warming over the 21st century is uncertain. The location of the Bay is also interestingfrom a precipitation st<strong>and</strong>point, with considerable uncertainty surrounding futureconditions; in other words, the area could be wetter or drier. Given the enormity of theBay <strong>and</strong> the issues it faces, this case study focuses more narrowly on the climate changeimpacts <strong>and</strong> adaptation measures relevant to managing water quality <strong>and</strong> aquatic ecosystemsin Maryl<strong>and</strong>, Pennsylvania, <strong>and</strong> Virginia.The following sections provide an overview of the climate impacts anticipated to occurin the Bay (Section 2), a snapshot of a set of plausible climate futures (Section 3), <strong>and</strong>,finally, an overview of state-level adaptation planning across the Bay (Section 4).2: <strong>Climate</strong> Change <strong>Impacts</strong> on Water Quality <strong>and</strong> EquaticEcosystems for the Chesapeake Bay2.1 Changes in Physical <strong>Climate</strong>A high level overview of the projected changes in the Bay’s physical climate is shownin Table A-1. These changes, along with related changes in streamflow, are discussed inmore detail below.Temperature changes are relative to the 1971-2000 average, with results shown forboth the lower B2 <strong>and</strong> higher A2 emission scenarios, averaged from seven climate models(Najjar et al., 2009). Ranges represent the multi-model mean ±1 st<strong>and</strong>ard deviation.For the earlier periods of 2010 to 2039 <strong>and</strong> 2040 to 2069, only the A2 are shown, becausethe differences between the multi-model averages for the two scenarios are lessthan 0.2°C. These scenarios were examined by Najjar et al. (2009) because they bracketthe range of emissions from the IPCC Third Assessment Report (Nakićenović & Swart,2000). Sea-level changes are relative to 1990. End-of-century projections are from Najjaret al. (2010), which is based on the statistical model presented in Rahmstorf (2007). The
Chesapeake Bay Case Study 127Table A-1: Projected changes in the Bay’s temperature, precipitation, <strong>and</strong> sea levelImpactProjected shorttermchange(2010-2039)Projected mediumtermchange (2040-2069)Projected longtermchange (2070-2099)Remarks about UncertaintyTemperature +0.9°C to +1.5°C+1.7°C to +3.7°C+2.7°C to +6.7°C (A2)+2.1°C to 4.9°C (B2)Very likely; warming simulatedfor all models in all future periodsAnnualPrecipitation -1% to +3% -5% to -9% -9% to +15% (A2)-4% to +10% (B2)Although annual precipitationprojections from single modelsinclude both increases <strong>and</strong>decreases, the consensus ofmodels calls for increases in thewinter <strong>and</strong> springSea-level riseNot available forChesapeake BayNot available forChesapeake Bay700-1600 mm(global+localsubsidence, by2100)Very likely; projection includesChesapeake Bay subsidence(estimated at 2 mm/yr)range in sea-level rise primarily reflects the range in warming projected by various emissionscenarios. Uncertainty language in Table A-1 is taken from Najjar et al. (2010); “verylikely” corresponds to changes with 90-99% likelihood.Temperature. Temperatures in the Bay are likely to increase throughout the 21stcentury (Table A-1). The range of projected temperature changes reflects both differencesin projected warming across climate models in response to a single greenhousegas emissions scenario <strong>and</strong> differences due to multiple emissions scenarios. The latter isa particularly important driver of the relatively large range in the projections for the endof the 21st century.Although specific projections for water temperatures in Chesapeake Bay are not currentlyavailable, regional atmospheric temperatures are well correlated to water temperatures;therefore, increases in water temperature are also expected (Najjar et al., 2010).In addition to changes in mean temperature, the frequency <strong>and</strong> intensity of extremeheat events are likely to increase. Heat waves, defined as the longest period in the yearof at least five consecutive days with maximum temperature at least 5°C higher than theclimatology of the same calendar day, are projected to increase along the east coast ofNorth America, including the mid-Atlantic, by more than two st<strong>and</strong>ard deviations by2100 under the A1B emissions scenario (Meehl et al., 2007).
128 <strong>Coastal</strong> <strong>Impacts</strong>, <strong>Adaptation</strong>, <strong>and</strong> <strong>Vulnerabilities</strong>Precipitation. Although the means of several climate model projections show anincrease in annual precipitation in the Bay, the spread is relatively wide across the models(see Figure A-1). The range in precipitation projections is likely due to the Bay’slocation; the Mid-Atlantic region is positioned between subtropical areas expected tobecome drier <strong>and</strong> higher-latitude regions expected to become wetter (Najjar et al., 2010).Although most models project these broad changes, the precise latitude that dividesareas of increasing <strong>and</strong> decreasing precipitation is uncertain.Figure A-1 Annual <strong>and</strong> seasonal temperature (top) <strong>and</strong> precipitation (bottom) changes averaged overthe Chesapeake Bay Watershed, 2070–2099. The period 1971–2000 is used as the baseline for calculatingchange. Projections correspond to the A2 emission scenario. (Source: Najjar et al., 2010, 2009).Consensus among models exists regarding precipitation increases in the winter <strong>and</strong>spring seasons. In addition, consensus exists that precipitation intensity, defined as theamount of rain falling during a season or year divided by the number of rainy days,will increase, consistent with expected changes for most of the mid- <strong>and</strong> high-latitudes(Meehl et al., 2007). Projections also suggest a greater number of droughts arising froman increase in the number of dry days <strong>and</strong> enhancement of evapotranspiration fromhigher temperatures (Hayhoe et al., 2007; Najjar et al., 2010).Sea level. Rates of local sea-level rise in the Bay in the 21st century are likely to begreater than globally-averaged sea-level rise. During the 20th century, the average rateof sea level in the Bay was 3.5 mm/yr with a range of 2.7 to 4.5 mm/yr, which was nearlydouble the globally-averaged rate (Zervas, 2001). The enhanced rate of sea-level rise inthe Bay is likely due to long-term l<strong>and</strong> subsidence (Davis & Mitrovica, 1996).
Chesapeake Bay Case Study 129Table A-1 presents sea-level-rise estimates for the Bay for the end of the 21st century.The estimates of 700 to 1600 mm are based on the statistical model presented in Rahmstorf(2007), which equates the rate of sea-level rise to the amount of warming occurringsince the late 20th century. It also includes consideration of l<strong>and</strong> subsidence around theBay of 2 mm/yr (Najjar et al., 2010). The relatively large range in the sea-level estimatesreflects the uncertainty in the magnitude of warming occurring by 2100, which stemsfrom the use of different emission scenarios.Streamflow. Projections for streamflow span a wide range from decreases of 40 percentto increases of 30 percent associated with a doubling of the concentration of carbondioxide (Najjar et al., 2010; Najjar et al., 2009). In part, this range reflects uncertaintyin projections of precipitation, which is the primary driver of interannual variability ofstreamflow; however, it also reflects the large uncertainty in modeling the evapotranspirationresponse associated with higher temperatures, especially for scenarios involvingsubstantial temperature change (Najjar et al., 2010).The seasonality of streamflow across the Northeast is likely to change, with higherflows projected for the winter, earlier peak flows projected for the spring, <strong>and</strong> reducedflows projected for the summer (Hayhoe et al., 2007). These changes arise from increasedwinter rainfall, a shift to a greater proportion of precipitation as rain rather than snow inthe winter, earlier snow melt in the spring, less groundwater recharge in the spring, <strong>and</strong>increased evapotranspiration across the seasons (Hayhoe et al., 2007). Najjar at al. (2010)indicate that such a shift in peak streamflow might occur in the Bay, but such temporalshifts have not been detected in the Chesapeake system <strong>and</strong> the role of snowmelt mayonly be important for watersheds farther north of the Chesapeake (Murphy et al., 2011).2.2 <strong>Impacts</strong> on Biogeochemistry <strong>and</strong> Water QualityNutrients. Nitrogen <strong>and</strong> phosphorus are important components of the biogeochemicalprocesses in the Bay. Although these nutrients are important for aquatic life,additions of these nutrients from non-point sources, especially those associated withanthropogenic activities such as agriculture <strong>and</strong> runoff from impervious surfaces, representa challenge to maintaining water quality. Temperature <strong>and</strong> precipitation can affectthe timing <strong>and</strong> amount of nutrients introduced to <strong>and</strong> transported through the Bay, givingclimate a potentially important role in affecting the Bay’s biogeochemical cycles <strong>and</strong>water quality.Nutrient inputs to the Chesapeake Bay come from several pathways, each of whichcan be affected by climate differently.Nitrogen export from watersheds. Overall, the average nitrogen export flux to the Bay is20-25% of the total anthropogenic inputs that occur within the watershed. Watershedsthat include agricultural operations <strong>and</strong> developed suburban <strong>and</strong> urban areas tend toexport more nitrogen than forested areas in the Bay (Kaushal et al., 2008). Streamflowacts as an important modulator of export; lower rates of export have been observed duringdry years such as 2002 because nutrient residence times are increased (Kaushal et al.,2008). Conversely, higher flows, even those associated with individual weather events,can increase export. In 2003, heavy rainfall <strong>and</strong> high flows associated with Hurricane
130 <strong>Coastal</strong> <strong>Impacts</strong>, <strong>Adaptation</strong>, <strong>and</strong> <strong>Vulnerabilities</strong>Isabel led to relatively high export rates (Kaushal et al., 2008). Temperature can alsoaffect export because higher temperatures enhance rates of denitrification <strong>and</strong> lower export(Najjar et al., 2010).The effects of future climate change on nitrogen export are somewhat uncertain becauseof the important role that streamflow plays. One study projects an increase innitrogen flux down the Susquehanna River of 17 percent by 2030 <strong>and</strong> 65 percent by 2095with associated increases in precipitation of 4 percent <strong>and</strong> 15 percent, respectively (Howarthet al., 2006). Another study shows a decrease in nitrogen flux down the SusquehannaRiver by 20 percent with a projected increase in temperature of 3°C (Schaefer <strong>and</strong>Alber, 2007). However, a study for the Patuxent River suggests that the sensitivity ofnitrogen export to changes in precipitation <strong>and</strong> temperature could be much smaller; a 5percent increase in precipitation would be accompanied by only a 5 percent increase inexport while a 1°C warming was estimated to reduce export by only 3 percent (Johnson& Kittle, 2007). Improving projections would require an improved representation of theprocesses that control nitrogen exports in models (Najjar et al., 2010)Nitrogen deposition. Atmospheric deposition of nitrogen occurs both directly on theBay <strong>and</strong> onto l<strong>and</strong> within the watershed. The amount of nitrogen deposited into theBay is poorly known, with estimates ranging from 14 percent to 64 percent of the totalnitrogen load in the Bay (Najjar et al., 2010). Although projecting how deposition couldchange in the future may be difficult, deposition is certainly sensitive to changes in precipitation<strong>and</strong> wind patterns. Also, climate’s effect on the types of tree species found inthe region’s forests could have implications for overall nitrogen cycling (Najjar et al.,2010); for example, if forests shift toward more maple species <strong>and</strong> fewer oak species asprojected, (Najjar et al., 2010; Iverson et al., 2005), nitrate production in soils could beenhanced.Phosphorous <strong>and</strong> sediment loading. Unlike many other biogeochemical cycles, the atmospheredoes not play a significant direct role in the movement of phosphorus. Phosphorusfrom non-point sources is mainly controlled by the rate of erosion. Increases inprecipitation <strong>and</strong> streamflow could lead to enhanced sediment loading <strong>and</strong> increasedphosphorous levels because sediment loading is a non-linear function of streamflow.However, little has been done to test how climate change will affect erosion rates (Najjaret al., 2010).Dissolved Oxygen. Reductions in oxygen availability can stress aquatic ecosystems.Nutrient levels, as well as physical climate (the two of which are themselves related),can make the Bay more or less prone to hypoxic or anoxic events in several ways.Nutrient loads. In general, waters with high nutrient levels can experience eutrophication,which can deplete dissolved oxygen. Policies including a ban on phosphate-baseddetergents <strong>and</strong> the use of nitrogen removal systems in wastewater treatment plants havefacilitated the reduction of nutrient loading over the last several decades in some portionsof the Bay (Kemp et al., 2009; Ruhl et al., 2010; Williams et al., 2010), but trendsin hypoxia <strong>and</strong> other measures of water quality have not necessarily shown much improvement.Murphy et al. (2011) suggest that significant increases observed in early
Chesapeake Bay Case Study 131summer hypoxia may reflect climate-driven changes in stratification (see below) whileslight decreases during late summer hypoxia may reflect reductions in nutrient loading.Temperature <strong>and</strong> oxygen solubility. Warmer temperatures decrease the solubility of oxygenin water. During summertime conditions, oxygen saturation below the pycnoclineis sensitive to warming, with saturation concentrations dropping -0.16 mg/L for eachdegree of warming. Thus, for 5°C of warming, waters that might be severely hypoxic (
132 <strong>Coastal</strong> <strong>Impacts</strong>, <strong>Adaptation</strong>, <strong>and</strong> <strong>Vulnerabilities</strong>negative relationship between temperature <strong>and</strong> algal blooms for Pseudo-nitzschia, whichis capable of producing the toxic domoic acid that poisons shellfish <strong>and</strong> causes neurologicaldamage in humans.Submerged AQUATIC VEGETATION. Submerged aquatic vegetation (SAV) servesimportant functions in the Bay, providing habitats for many aquatic organisms, takingup nutrients, <strong>and</strong> stabilizing sediments. SAV in the Bay is composed of numerous differentplant species with variable tolerances for temperature, salinity, <strong>and</strong> other environmentalconditions.<strong>Climate</strong> can affect SAV directly, <strong>and</strong> through its influence on the Bay’s biogeochemistry,SAV can be detrimentally affected by high temperatures. In 2005, significant die-offof Zostera marina occurred following a period of high summer temperatures (Orth et al.,2010). SAV growth can also be retarded by high concentrations of suspended sedimentsor by growth of microorganisms that block sunlight. As a result, increases in rainfall <strong>and</strong>streamflow that raise sediment <strong>and</strong> nutrient levels can reduce water clarity <strong>and</strong> SAVabundance (Najjar et al., 2010).Salinity gradients within the Bay already influence the types of SAV species thatgrow in different regions, with more salt-tolerant species found in the lower reaches ofthe Bay. Changes in salinity due to sea-level rise or changes in precipitation could alterthe distribution of species (Najjar at al., 2010). Similarly, increases in carbon dioxide mayfavor growth in some species of SAV provided sufficient light is available, which wouldalso contribute to changes in species distributions (Najjar et al., 2010).Estuarine WETLANDS. The consequences of sea-level rise for wetl<strong>and</strong>s are highlyuncertain. The extent to which accretion <strong>and</strong> migration of wetl<strong>and</strong>s, which would actto maintain or increase their acreage, will be offset by inundation of existing wetl<strong>and</strong>sis unclear (Najjar et al., 2010). Observations of vegetative changes suggest that loss maybe favored (Najjar et al., 2010; Perry & Hershner, 1999), although increases in carbondioxide <strong>and</strong> temperature could assist the growth of marsh vegetation <strong>and</strong> enhance wetl<strong>and</strong>accretion (Najjar et al., 2010). Regardless of changes in acreage, more frequent inundationmay alter species composition <strong>and</strong> favor the proliferation of invasive speciessuch as Phragmites australis (Najjar et al., 2010; U.S. EPA, 2008). Overall, changes forwetl<strong>and</strong>s will be strongly influenced by changes in human l<strong>and</strong> use; development <strong>and</strong>shoreline hardening can inhibit wetl<strong>and</strong> migration (Najjar et al., 2010).Fish. <strong>Climate</strong> change is likely to alter the distribution <strong>and</strong> abundances of the Bay’s variousfish species. For fish that are tolerant of warmer temperatures or are vulnerable toparticularly cold winters, warming could extend the length of the growing season <strong>and</strong>act as a benefit (Najjar et al., 2010), but warming could contract the geographic range ofcold-temperature fish. Warming is also likely to have numerous indirect effects on fish;for example, changes in habitat as well as the timing <strong>and</strong> availability of prey <strong>and</strong> predatorscould lead to shifts in species composition in the Bay. Recent observations show thatsome fish pathogens have been more successful at surviving over the winter; if warmingcontinues this trend, then fish illness <strong>and</strong> mortality may increase (Najjar et al., 2010).Like warming, changes in salinity could also have impacts on the distribution <strong>and</strong>relative abundance of prey <strong>and</strong> predators. Najjar et al. (2010) note that sea nettles
Chesapeake Bay Case Study 133(Chrysaora quinquecirrha) could benefit from increases in salinity, which could have importantimplications for the survival of fish eggs <strong>and</strong> larva as well as the composition ofzooplankton communities that serve as food for many aquatic species.Hypoxic conditions present serious threats to fish. Combined with warming, whichcan raise fishes’ metabolic rates, low-dissolved oxygen levels can inhibit growth (Hanks& Secor, 2010) <strong>and</strong> lead to mortality.Shellfish. Warming may benefit some species of shellfish. Fewer cold winters couldreduce mortality of blue crabs (Callinectes sapidus, Hines et al., 2010) <strong>and</strong> less frequentfreezing of shoreline habitats could assist oysters as they form reefs (Najjar et al., 2010).Warming could also allow blue crabs to increase reproduction by increasing the numberof broods per season (Hines et al., 2010), but warming <strong>and</strong> changes in salinity arelikely to have many indirect effects on shellfish through changes in habitat as well as theprevalence of pathogens <strong>and</strong> the timing <strong>and</strong> distribution of food <strong>and</strong> predators.Specifically for shellfish, acidification of Bay waters could alter their ability to formshells. The calcification process is significantly inhibited by reductions in pH, whichcould lead to slower shell formation rates or weaker shells (Waldbusser et al., 2009).However, experiments with the Eastern Oyster (Crassostrea virginica) show that increasesin temperature <strong>and</strong> high levels of salinity can help minimize the impacts of loweringpH on calcification (Waldbusser et al., 2009).3. <strong>Climate</strong> Change Scenarios for the Chesapeake BayThe available information on anticipated climate change impacts (summarized above)can be used to develop a broad set of plausible futures or scenarios to facilitate considerationof adaptation options. The information presented below (see Table A-2) provides asnapshot of climate drivers, plausible directions, <strong>and</strong> potential impacts of concern acrossthe Bay. It draws from projected conditions for the end of the 21st century to presentinformation describing likely changes from model projections that appear to converge,which provides greater confidence, <strong>and</strong> uncertain changes from model projections thatdiverge, which provides lower confidence.4. Overview of State-level <strong>Adaptation</strong> Planning <strong>and</strong>Implementation Across the Chesapeake BayThe states in the Chesapeake Bay watershed are working together to help to improve thewater quality <strong>and</strong> health of aquatic ecosystems in the Bay. As of February 2012, Maryl<strong>and</strong><strong>and</strong> Pennsylvania have prepared state-wide adaptation plans that consider a rangeof climate change impacts <strong>and</strong> Delaware has released a plan to address sea-level rise inthe state. The District of Columbia, New York, <strong>and</strong> Virginia have each published climateaction plans, which include adaptation recommendations as part of a larger approachprimarily focused on climate change mitigation by reducing greenhouse gas emissions.All of the adaptation plans developed to date offer recommendations rather than m<strong>and</strong>atesintended to inform practitioners <strong>and</strong> law-makers at both the state <strong>and</strong> local levelson how to adapt.This section provides a description of the adaptation activities in Maryl<strong>and</strong>,
134 <strong>Coastal</strong> <strong>Impacts</strong>, <strong>Adaptation</strong>, <strong>and</strong> <strong>Vulnerabilities</strong>Table A-2: <strong>Climate</strong> drivers, plausible directions, <strong>and</strong> potential impacts of concernacross the Bay<strong>Climate</strong>DriversPlausible DirectionsWhy this Matters/ Potential<strong>Impacts</strong>SourcesPrecipitationDrier – Small decreases inannual precipitation (10%), <strong>and</strong> longer periods oftime without rainWetter – Up to a 20% increase inannual precipitation; 10-20%increases in winter <strong>and</strong> springprecipitationMore intense heavy rainfallevents – Strong winter stormevents could dump more rain(not mutually exclusive witheither wetter/drier scenarios)Projections for precipitationfor the region are highlyuncertain, including bothincreases <strong>and</strong> decreases.Scenarios will likely need toinvolve some estimate of bothdrier <strong>and</strong> wetter conditions.Precipitation is an importantdriver of streamflow, changesfor which have broadimpacts on water quality <strong>and</strong>ecosystems.Drier/Wetter: Qualitativeexamination of therange of models for theA2 scenario, 2070-2099(Najjar et al. 2010, Fig.4; reproduced as Fig. 1above)Intensity: Najjar et al., 2010;discussing Lambert <strong>and</strong>Fyfe (2006)TemperatureWarmer – temperaturesmoderately increase (e.g., 2°C), with fewer extreme colddays <strong>and</strong> more heat wavesWarmest – temperaturesincrease more significantly(e.g., 5° C), with many moreextreme hot weather eventsWarming can directly impactthe species composition of theBay. Temperature-inducedchanges in evaporation changecould interact with changes inprecipitation to have a significantimpact on regional hydrology.Although temperatures arelikely to increase, the magnitudeof warming is uncertain.Najjar et al. 2009 – manyvalues of warming couldbe chosen. Warming of2.3°C corresponds to theone st<strong>and</strong>ard deviationbelow the average of thefour “best” models for theChesapeake Bay for the B2scenarios for 2070-2099.Warming of 5°C representsone st<strong>and</strong>ard deviationabove the same multimodelaverage for the A2scenario.Sea-level rise(SLR)Moderate acceleration in sealevelrise – 700 millimetersby 2100.Higher acceleration in sea-levelrise – 1600 millimeters by2100.Sea-level rise is anticipated toaccelerate in the 21st century.Rates of observed sea-level risein the Bay have been greaterthan global averages due to l<strong>and</strong>subsidence.Sea-level Rise has implicationsfor habitat inundation <strong>and</strong>salinity.Najjar et al., 2010;application of Rahmstorf(2007) estimates for globalsea-level rise to local ratesof subsidence
Chesapeake Bay Case Study 135Pennsylvania, <strong>and</strong> Virginia related to water quality <strong>and</strong>/or aquatic ecosystems. Eachstate’s plan is briefly discussed, including a summary of when <strong>and</strong> how the plan wasdeveloped; the impacts <strong>and</strong> vulnerabilities the plan addresses; <strong>and</strong> examples of howselected municipalities within these states are moving towards implementation of adaptationstrategies related to water quality <strong>and</strong> aquatic ecosystems through actions thatwill contribute to climate change adaptation. These plans have been developed withinthe last year or several years, which may partially explain why implementation to dateof the strategies recommended within them has been fairly limited or not yet embarkedon at all. Many of the strategies are also quite broad <strong>and</strong> encompass activities that arealready underway to achieve water quality <strong>and</strong> aquatic-ecosystem management goals.These activities will only become more important in the face of climate change <strong>and</strong> mayneed to be reevaluated to address changing conditions.Table A-3 below provides an overview of the climate change impacts <strong>and</strong> vulnerabilitiesidentified across each of these plans as well as the types of adaptation strategiesconsidered to address water quality <strong>and</strong> aquatic ecosystem concerns.Table A-3: Coverage of water quality <strong>and</strong> aquatic ecosystem concerns in climatechangeadaptation plans for Maryl<strong>and</strong> (MD), Pennsylvania (PA), <strong>and</strong> Virginia (VA)State<strong>Climate</strong> Change <strong>Impacts</strong> <strong>and</strong> <strong>Vulnerabilities</strong>Categories of Water Quality <strong>and</strong>Aquatic Ecosystem <strong>Adaptation</strong>sDroughtFloodingChanges to Stream FlowIncreased Stream / River TemperaturesAging InfrastructureImpervious Surfaces (increased pollutants)Extreme Storms (wetter winters)Sea-level riseExtreme Heat EventsL<strong>and</strong> Use <strong>and</strong> InfrastructureStormwater ControlHabitat RestorationIncorporate climate change into planningMonitor / AuditEducate / Inform PublicMD x x x x x x x x x x x xPA x x x x x x x x x x x xVA x x x x x x x
136 <strong>Coastal</strong> <strong>Impacts</strong>, <strong>Adaptation</strong>, <strong>and</strong> <strong>Vulnerabilities</strong>4.1 Maryl<strong>and</strong>Approach. The Comprehensive Strategy for Reducing Maryl<strong>and</strong>’s Vulnerability to <strong>Climate</strong>Change Phase II (referred to as the Phase II <strong>Adaptation</strong> Strategy hereinafter) predicts thatclimate change is going to exacerbate existing stressors on aquatic ecosystems <strong>and</strong> waterresources. Consequently, many of the priority recommendations, particularly those thatwill affect water quality <strong>and</strong> aquatic ecosystems, focus on reducing stressors, increasingresiliency, <strong>and</strong> updating aging infrastructure.To enhance resilience in aquatic ecosystems, the Phase II <strong>Adaptation</strong> Strategy recommendsprotecting a larger portfolio of habitats, employing stormwater best managementpractices (BMPs), strengthening l<strong>and</strong>-use regulations, enforcing pollution st<strong>and</strong>ards,<strong>and</strong> incorporating climate change into the process of developing restoration priorities.Additionally, to provide a sufficient <strong>and</strong> high quality water supply, the plan suggeststhat local governments can adopt ordinances to protect water recharge areas.Box A-1Maryl<strong>and</strong>Comprehensive Strategy for Reducing Maryl<strong>and</strong>’s Vulnerability to<strong>Climate</strong> Change, Phase II: Building societal, economic, <strong>and</strong> ecologicalresiliencePublication Date: January 2011Authors: Maryl<strong>and</strong> Commission on <strong>Climate</strong> Change <strong>Adaptation</strong> <strong>and</strong> Response <strong>and</strong>Scientific Technical Working GroupsSections:• Agriculture• Bay <strong>and</strong> aquatic ecosystems*• Forest <strong>and</strong> terrestrial ecosystems• Human health• Population growth <strong>and</strong> infrastructure*• Water resources** Sections of most relevance to this case study<strong>Impacts</strong> <strong>and</strong> VULNERABILITIES. The Phase II <strong>Adaptation</strong> Strategy focuses specificallyon the potential impacts of changes in precipitation <strong>and</strong> temperature. The planprojects that these two changes could interact with elements of the built environment,including infrastructure, urbanized areas, <strong>and</strong> impervious surfaces, to exacerbate conditionsthat already threaten water quality <strong>and</strong> aquatic ecosystems. The plan includes
Chesapeake Bay Case Study 137consideration of increased droughts <strong>and</strong> extreme heat in the summer; increased flooding<strong>and</strong> intense precipitation events; changes to stream flow <strong>and</strong> water temperatures;<strong>and</strong> how these changes could increase the sediments <strong>and</strong> pollutants that are carried tolocal waterways.<strong>Adaptation</strong> RECOMMENDATIONS. The Phase II <strong>Adaptation</strong> Strategy provides arange of adaptation recommendations from incorporating climate change into wildlifemanagement decisions to altering funding criteria to require environmental sitedesign (ESD) techniques, which are similar to green infrastructure, to specific habitatrestorationactivities. The Phase II <strong>Adaptation</strong> Strategy recommends that the Departmentof Natural Resources <strong>and</strong> its partners address water quality <strong>and</strong> aquatic ecosystems,<strong>and</strong> focus primarily on policy recommendations that will change the way that localitieswithin the state consider climate change in developing long-range plans. The Maryl<strong>and</strong>Department of the Environment released the Environmental Site Design (ESD) Process <strong>and</strong>Computations guidelines in 2010 to provide information to l<strong>and</strong> developers to meet therequirement to use ESD to the maximum extent practicable to control stormwater. Althoughnot explicitly developed to address climate change impacts, ESD practices willcontribute to state-wide efforts to adapt to climate change.Moving TOWARDS IMPLEMENTATION: BALTIMORE PROMOTES a WATERshed-BASEDMANAGEMENT PLAN. The City of Baltimore is restoring water qualityin accordance with the federal Clean Water Act. Under the Baltimore Sustainability Plan,six strategies are outlined to achieve this goal. The short- to long-term strategies includerestoring stream corridors, reducing <strong>and</strong> enhancing treatment of stormwater, <strong>and</strong> creatingmanagement plans for watershed-based natural resources. Baltimore is also expectedto implement recommendations in the City County Watershed Agreement. TheBaltimore City County Watershed Phase 1 Action Plan has overarching goals to protectwater resources, enhance vegetation, <strong>and</strong> reduce water pollution, <strong>and</strong> provides specificactions that can be taken to achieve the goals. These actions will become even more criticalas the Bay increasingly experiences the climate change impacts described above.4.2 PennsylvaniaApproach. The Pennsylvania Department of Environmental Protection released thePennsylvania <strong>Climate</strong> <strong>Adaptation</strong> Planning Report: Risks <strong>and</strong> Practical Recommendations in2011 following the release of the December 2009 Pennsylvania <strong>Climate</strong> Change Action Plan.The Pennsylvania <strong>Climate</strong> <strong>Adaptation</strong> Planning Report presents a list of strategies thatwere prioritized based on evaluations of cost, timeliness of implementation, politicalsupport, data availability, planning, risk level, co-benefits, <strong>and</strong> risks to health <strong>and</strong> safety.The plan provides specific recommendations <strong>and</strong> suggests some cross-cutting practicesfor both the built environment <strong>and</strong> natural resources to improve local water quality <strong>and</strong>aquatic ecosystems.<strong>Impacts</strong> <strong>and</strong> VULNERABILITIES. The Pennsylvania <strong>Climate</strong> <strong>Adaptation</strong> Planning Reportis based on the climate concerns identified in the 2009 Pennsylvania <strong>Climate</strong> Impact Assessment.Based on general circulation models, the Pennsylvania <strong>Climate</strong> Impact Assessmentprojected that the Pennsylvania climate would likely experience the following impacts:
138 <strong>Coastal</strong> <strong>Impacts</strong>, <strong>Adaptation</strong>, <strong>and</strong> <strong>Vulnerabilities</strong>Box A-2PennsylvaniaPennsylvania <strong>Climate</strong> <strong>Adaptation</strong> Planning Report: Risks <strong>and</strong> PracticalRecommendationsPublication Date: January 2011Authors: Pennsylvania Department of Environmental ProtectionSections:• Infrastructure*• Natural resources*• Public health <strong>and</strong> safety• Tourism <strong>and</strong> outdoor recreation* Sections of most relevance to this case studywarmer temperatures, more precipitation, more frequent <strong>and</strong> intense storm events <strong>and</strong>flooding, <strong>and</strong> longer dry periods <strong>and</strong> droughts. Additionally, this plan considers howsea-level rise <strong>and</strong> resulting saltwater intrusion, as well as changes to stream flows, couldhave adverse impacts on aquatic <strong>and</strong> wetl<strong>and</strong> species.<strong>Adaptation</strong> RECOMMENDATIONS. Three of the report’s seven broad <strong>and</strong> crosscuttingstrategies are relevant to local communities seeking to address water-quality <strong>and</strong>aquatic-ecosystem concerns:• Use green infrastructure to simultaneously capture stormwater <strong>and</strong> the amountof polluted runoff that reaches the local waterways;• Incorporate resilience into fish <strong>and</strong> wildlife habitat planning; <strong>and</strong>• Integrate adaptation <strong>and</strong> mitigation strategies as part of planning operations forboth public <strong>and</strong> private institutions.The Pennsylvania <strong>Climate</strong> <strong>Adaptation</strong> Planning Report also provides a range of sectorspecificadaptation recommendations such as: restricting impervious surfaces in keywatershed areas; revising stormwater regulations; accommodating increases in precipitationthrough exp<strong>and</strong>ing riparian buffers <strong>and</strong> encouraging homeowners, farmers, recreational,industry, <strong>and</strong> commercial users to use rainwater catchments; <strong>and</strong> lowering thedem<strong>and</strong> for groundwater <strong>and</strong> surface water systems. In addition to promoting monitoring,l<strong>and</strong>-use changes, habitat restoration, stormwater control, <strong>and</strong> policy changes, thisplan also recommends educating, encouraging, <strong>and</strong> informing the public about how toadapt to climate change.
Chesapeake Bay Case Study 139Moving TOWARDS IMPLEMENTATION: PHILADELPHIA USES STORMWATERFEE to INCENTIVIZE GREEN INFRASTRUCTURE. The Philadelphia Water Department(PWD) introduced the Green City, Clean Waters, a 25-year plan to manage stormwaterwith green infrastructure, with the goal to make the city sustainable <strong>and</strong> resilientto anticipated changes, including climate change. PWD is promoting green stormwaterinfrastructure as a method of maximizing economic, social, <strong>and</strong> environmental benefitsfor the city while managing flooding <strong>and</strong> pollution <strong>and</strong> improving the water quality <strong>and</strong>aquatic ecosystems. PWD provides residents <strong>and</strong> businesses with information about incorporatinggreen stormwater infrastructure into private developments. PWD is alsoimplementing BMPs on public property such as roads, schools, alleys, <strong>and</strong> parking lots.Additionally, in 2009, PWD began to phase in a stormwater utility fee for non-residentialproperties. Fees are based on the estimated amount of runoff, which provides a financialincentive for l<strong>and</strong>-owners to incorporate green practices into development.4.3 VirginiaApproach. The Virginia Governor’s Commission on <strong>Climate</strong> Change released A <strong>Climate</strong>Change Action Plan in December 2008. The report focuses largely on reducing thestate’s greenhouse gas emissions <strong>and</strong> provides groundwork for the state to begin monitoring<strong>and</strong> reporting greenhouse gas emissions <strong>and</strong> observed climate change impacts. Italso includes a section that outlines the need to address likely climate change impacts aswell as possible high-level approaches for doing so.A <strong>Climate</strong> Change Action PlanBox A-3VirginiaPublication Date: December 2008Authors: Governor’s Commission on <strong>Climate</strong> ChangeSections:• Recommendations that affect GHG emissions• GHG reductions <strong>and</strong> cost effectiveness• Recommendations to plan for <strong>and</strong> adapt to climate change** Sections of most relevance to this case study<strong>Impacts</strong> <strong>and</strong> VULNERABILITIES. The plan discusses some of the major impacts ofconcern by focusing on sea-level rise <strong>and</strong> temperature increases with some references tochanges in the precipitation regime. It also notes the anticipated impacts of sea-level rise
140 <strong>Coastal</strong> <strong>Impacts</strong>, <strong>Adaptation</strong>, <strong>and</strong> <strong>Vulnerabilities</strong>on the Bay region. It identifies several foundation species at risk of declining or disappearingif salinity <strong>and</strong> temperatures continue to rise <strong>and</strong> weather patterns continue tofluctuate widely. The report also notes that increasing temperatures <strong>and</strong> storm runoffwould decrease oxygen levels <strong>and</strong> negatively impact aquatic species. Saltwater intrusioncaused by sea-level rise would also have a negative effect on Virginia’s coastal wetl<strong>and</strong>s.<strong>Adaptation</strong> RECOMMENDATIONS. The adaptation portion of A <strong>Climate</strong> ChangeAction Plan primarily focuses on disseminating information on climate change adaptation<strong>and</strong> preparedness while also providing some suggestions to address climate changein the future. The proposed preparedness strategies range from seeking recommendationsthat complement existing goals to collaboration with neighboring states <strong>and</strong> otherpublic <strong>and</strong> private sector partners. A <strong>Climate</strong> Change Action Plan also offers a series ofrecommendations for how local governments can incorporate climate change into theirplanning efforts. The plan recommends that all state discretionary funding programsshould require that infrastructure projects be designed to withst<strong>and</strong> climate changesover the course of the project.Four recommendations that could address water quality <strong>and</strong> aquatic ecosystems inthe Bay are of note:• <strong>Adaptation</strong> policies <strong>and</strong> programs for the built environment should take intoconsideration impacts on natural systems;• The Virginia Department of Conservation <strong>and</strong> Recreation (DCR) shouldmonitor available forecasting tools <strong>and</strong> amend its stormwater regulation asneeded to ensure the implementation of stormwater management measuresthat will continue to function effectively in an altered precipitation regime;• DCR should assess the consequences of climate change on the effectiveness ofnon-point source urban <strong>and</strong> agriculture best management practices; <strong>and</strong>• The General Assembly should require local governments whose jurisdictionsencompass Virginia’s shoreline to develop integrated shoreline managementplans in coordination with Virginia Marine Resources Commission (VMRC).Such planning efforts would integrate adaptation <strong>and</strong> response strategies forcoastal erosion, sea-level rise adaptation, <strong>and</strong> coastal storm surge into existingstate <strong>and</strong> local policies.Moving TOWARDS IMPLEMENTATION: VIRGINIA BEACH INCORPORATESCLIMATE CHANGE into the COMPREHENSIVE PLAN. The City of VirginiaBeach’s 2009 Comprehensive Plan includes climate change as a hazard that the Cityshould anticipate <strong>and</strong> calls for the continuation of practices that will contribute to climatechange adaptation. This plan recommends actions to protect <strong>and</strong> manage water resources.Water quality is to be maintained through: 1) the continuation of watershed restorationprojects with partner agencies; 2) the achievement of the goals of the SouthernWatersheds Area Management Program; 3) the development of a Watershed ManagementPlan; <strong>and</strong> 3) the management of stormwater. These practices will help ensure waterquality for the benefits of habitat support, drinking, <strong>and</strong> water recreation. The City’sPlan also provides recommendations for adaptation to sea-level rise <strong>and</strong> storm surges.
Appendix BNorthern Gulf of Mexico Case StudyThe shores of the Gulf of Mexico support ecosystems <strong>and</strong> economies of national significance.According to the National Marine Fisheries Service, the commercial fish <strong>and</strong>shellfish harvest from the five U.S. Gulf states was estimated to be 1.3 billion poundsvalued at $639 million in 2010. The Gulf also contains four of the nation’s top seven fishingports by weight <strong>and</strong> eight of the nation’s top twenty fishing ports by dollar value.Gulf l<strong>and</strong>ings of shrimp <strong>and</strong> harvest of oysters lead the nation <strong>and</strong> the Gulf also houses aproductive recreational fishery. In 2010, marine recreational participants took more than20.7 million trips.According to the Bureau of Ocean Energy Management, offshore operations in theGulf produce a quarter of the U.S. domestic natural gas <strong>and</strong> one-eighth of its oil. In addition,the offshore petroleum industry employs over 55,000 U.S. workers in the Gulf.<strong>Coastal</strong> communities <strong>and</strong> ports maintain this energy production by supporting the operationof offshore <strong>and</strong> inshore production facilities as well as onshore pipelines <strong>and</strong>processing plants.Major Gulf ports include New Orleans, Baton Rouge, Houston, Mobile, <strong>and</strong> LakeCharles. More than 220 million tons of cargo moved through the Port of Houston in2009. In 2008, the Port of Mobile had a trade volume of over 67 million tons. The cargoconveyed on the Mississippi River alone is estimated to have an approximately $115 billionannual impact on the nation’s economy.Vulnerable <strong>Coastal</strong> Habitats <strong>and</strong> CommunitiesGlobal sea-level rise will have a disproportionate effect along the Gulf Coast shoreline becauseof its flat topography, regional l<strong>and</strong> subsidence, extensive shoreline development,<strong>and</strong> vulnerability to major storms. Considerable uncertainty remains about whether theregional climate will become wetter or drier in the future, but future trends in rainfall,runoff, <strong>and</strong> consequent soil moisture are critical to human <strong>and</strong> ecological well-being inthe Gulf Coast. Freshwater availability influences coastal ecosystems through salinitygradients as well as agricultural production <strong>and</strong> many coastal industries <strong>and</strong> water supplyfor municipalities.<strong>Climate</strong> changes could also result in potential shifts in El Niño/La Niña cycles, hurricanes,storms, <strong>and</strong> coastal ocean currents; however, even if storm intensities remainconstant disturbance from coastal flooding <strong>and</strong> erosion will increase because rising sealevels will generate higher storm surges even from minor storms. The effects of recentstorms, including Katrina <strong>and</strong> Rita in 2005, have been dramatic <strong>and</strong> demonstrate thevulnerability of large population centers like New Orleans <strong>and</strong> Houston.However, in addition to the dramatic, newsworthy events associated with major141
142 <strong>Coastal</strong> <strong>Impacts</strong>, <strong>Adaptation</strong>, <strong>and</strong> <strong>Vulnerabilities</strong>events, the rural communities of the Gulf Coast are also of concern due to their existingsocial vulnerability. The figure below (Figure B-1) shows how indices of coastal vulnerability(CVI) merged with indices of social vulnerability (CSoVI) produces a place vulnerabilityindex (PVI) with high values in the counties of coastal Louisiana <strong>and</strong> Texas.Figure B-1 Vulnerability of Gulf Coast counties based on physical (CVI) <strong>and</strong> social (CSoVl) indicators<strong>and</strong> their integration into place vulnerability (PVI). Based on: Boruff et al., 2005; Pendleton et al., 2010.A ‘Laboratory’ for Underst<strong>and</strong>ing <strong>Coastal</strong> Change <strong>and</strong> TestingNew ApproachesThe northern Gulf of Mexico provides an excellent laboratory for considering the effectsof future climate change for several reasons:• <strong>Adaptation</strong> <strong>and</strong> change are already integral. From ecosystems to communities,change is both inevitable <strong>and</strong> already happening. The deltaic wetl<strong>and</strong>sof coastal Louisiana are in a constant state of change associated with growth<strong>and</strong> degradation of delta lobes, <strong>and</strong> a northward shift in the limit of persistentmangrove growth is already underway. Although these changes are associatedwith both gradual <strong>and</strong> pulsed forcing, coastal communities change in responseto storm events. Although the conventional wisdom tells us that relocating orelevating coastal residents is difficult, post-storm efforts in coastal Louisiana <strong>and</strong>
Northern Gulf of Mexico Case Study 143Mississippi that include financial assistance or incentives have proven successfulat least locally. The relocation aspects of the Mississippi <strong>Coastal</strong> ImprovementProgram (MsCIP) have been over-subscribed, <strong>and</strong> the availability of generoushome elevation grants in Louisiana has stimulated growth in the ‘elevation’industry, in which private contractors often help residents with paperwork <strong>and</strong>grant applications.• Interactions between coastal change <strong>and</strong> watershed change. Underst<strong>and</strong>ing theconsequences of climate change for coastal systems requires a parallel <strong>and</strong> integratedrecognition of upstream changes. The northern Gulf provides an excellentopportunity to explore this relationship because of the range of watershedsdraining into the Gulf. The Mississippi is the 3rd largest watershed in the world<strong>and</strong> integrates climate change effects on runoff at the continental scale <strong>and</strong> theinteraction with river management. At a small scale, the Pascagoula drainageis one of the only unregulated drainage systems in the U.S. Between the twoin scale are watersheds that drain areas more likely subject to drought such asTexas <strong>and</strong> areas where trends in precipitation are less clear such as the southeasternregion.• Continuing investment in coastal restoration. In addition to ongoing restorationefforts, such as <strong>Coastal</strong> Wetl<strong>and</strong>s Planning, Protection, <strong>and</strong> RestorationAct, better underst<strong>and</strong>ing of sea level change, sediment delivery, <strong>and</strong> temperature<strong>and</strong> precipitation regimes is essential if ecosystem restoration projects tobe implemented as a consequence of the 2010 British Petroleum oil spill are toprovide sustainable benefits.
ReferencesAbuodha, P. & Woodroffe, C. (2010). Assessing vulnerability to sea-level rise using a coastalsensitivity index: A case study from southeast Australia. Journal of <strong>Coastal</strong> Conservation, 14,pp. 189-205.ACIA. (2005). Arctic <strong>Climate</strong> Impact Assessment. Cambridge University Press, Cambridge, UK, <strong>and</strong>New York, 1042 pp. Retrieved from http:// www.acia.uaf.edu/pages/scientific.html.<strong>Adaptation</strong> Advisory Committee. (2011). Massachusetts climate change adaptation report. ExecutiveOffice of Energy <strong>and</strong> Environmental Affairs <strong>and</strong> the <strong>Adaptation</strong> Advisory Committee,Boston, MA.<strong>Adaptation</strong> Advisory Group. (2010). Alaska’s <strong>Climate</strong> Change Strategy: Addressing <strong>Impacts</strong> toAlaska, Final Draft Report, January 27, Alaska Department of Environmental Conservation,04 pp. plus appendices.Aggarwal, P. K. & Singh, A. K. (2010). Water Resources Development <strong>and</strong> Management. In:Implications of Global Climatic Change on Water <strong>and</strong> Food Security. Springer, BerlinHeidelberg, pp. 49-63.Ahmad, F., Rauch, S. & Hodor, M. (2009). Oil <strong>and</strong> gas development in the Arctic Ocean. Sea Technology,50(40), pp. 51-55.Allan, J.C. & Komar, P.D. (2000). Are ocean wave heights increasing in the eastern North Pacific?EOS, Transaction of the American Geophysical Union, 81(47), pp. 561-567.Allan, J.C. & Komar, P.D. (2006). <strong>Climate</strong> controls on U.S. West Coast erosion processes. Journal of<strong>Coastal</strong> Research, 22, pp. 511-529.Allen, M.R., & Ingram, W.J. (2002). Constraints on future changes in climate <strong>and</strong> the hydrologiccycle. Nature, 418, pp. 224-232.American Society of Civil Engineers (ASCE). (2009). Critical Infrastructure Guidance TaskCommittee, ASCE Guiding Principles for the Nation’s Critical Infrastructure. Retrieved fromhttp://content.asce.org/files/pdf/GuidingPrinciplesFinalReport.pdf.Anderson, C.R., Sapiano, M.R.P., Balakrishna Prasad, M., Long, W. Tango, P.J. Brown, C.W.,& Murtugudde. R. (2010). Predicting potentially toxigenic Pseudo-nitzschia blooms in theChesapeake Bay. Journal of Marine Systems. 83(3-4), pp. 127-140.Anderson, J., Milliken, K., Wallace, D., Rodriguez, A., & Simms, A. (2010). <strong>Coastal</strong> impact underestimatedfrom rapid sea level rise. EOS Transactions, American Geophysical Union, 91(23),pp. 205-206, doi:10.1029/2010EO230001.Anthony, A., Atwood, J., August, P., Byron, C., Cobb, S., Foster, C., Fry, C., Gold, A., Hagos, K.,Heffner, L., Kellogg, D.Q., Lellis-Dibble, K., Opaluch, J.J., Oviatt, C., Pfeiffer-Herbert, A.,Rohr, N., Smith, L., Smythe, T., Swift, J., & Vinhateiro, N. (2009). <strong>Coastal</strong> lagoons <strong>and</strong> climatechange: ecological <strong>and</strong> social ramifications in U.S. Atlantic <strong>and</strong> Gulf coast ecosystems.Ecology <strong>and</strong> Society, 14(1), pp. 8. Retrieved from http://www.ecology<strong>and</strong>society.org/vol14/iss1/art8/.Archer, D. (2007). Methane hydrate stability <strong>and</strong> anthropogenic climate change. Biogeosciences, 4,pp. 521-544.Are, F, Reimnitz, E., Grigoriev, M., Hubberten, H.-W., & Rachold, V. (2008). The Influence ofCryogenic Processes on the Erosional Arctic Shoreface. Journal of <strong>Coastal</strong> Research, 24, pp. 110– 121.Arendt, A, Walsh, J., & Harrison, W. (2009). Changes of Glaciers <strong>and</strong> <strong>Climate</strong> in Northwestern144
References 145North America during the Late Twentieth Century. Journal of <strong>Climate</strong>, 22, pp. 4117-4134.Arroyo,V. & Cruce, T.L. (2012). State <strong>and</strong> Local <strong>Adaptation</strong> to <strong>Climate</strong> Change. In: The Law of<strong>Adaptation</strong> to <strong>Climate</strong> Change, Michael B. Gerrard & Katrina F. Kuh (Eds.).Ashton, A.D., Walkden, M.J.A., Dickson, M.E., (2011). Equilibrium responses of cliffed coasts tochanges in the rate of sea level rise. Marine Geology, 284, pp. 217-229.Atalah, J., Crowe, T.P. (2010). Combined effects of nutrient enrichment, sedimentation <strong>and</strong> grazerloss on rock pool assemblages. Journal of Experimental Marine Biology <strong>and</strong> Ecology, 388(1-2),pp. 51-57Atkinson, D.E. & Hinzman, L. (2008). Impact of the August 2000 storm on the soil thermalregime, Alaska North Slope. Conference Proceedings, Published Collection: Proceedings of the 9thInternational Conference on Permafrost, Fairbanks, Alaska, 29 June -3 July 2008, pp. 65-70.Atkinson, D.E. (2005). Environmental Forcing of the Circum-polar coastal Regime. GeoMarineLetters, 25, pp.98-109.Atkinson, D.E. (2011). The physical environment of Alaska’s coasts. In: Lovecraft, A. L., Eicken,H. (Eds.) North by 2020 – Perspectives on Alaska’s changing social-ecological systems. Universityof Alaska Press, Fairbanks, pp. 229-252. Retrieved from http://www.sfrpc.com/climatechange.htm.Atkinson, D.E., Schweitzer, P., Smith, O. & Norris, L. (2011). The Arctic <strong>Coastal</strong> System: An Interplayof Components Human, Industrial, <strong>and</strong> Natural. In: Lovecraft, A. L., Eicken, H. (Eds.)North by 2020 – Perspectives on Alaska’s changing social-ecological systems. University of AlaskaPress, Fairbanks, pp. 277-298.Bacon, S. & Carter, D.J.T. (1991). Wave climate changes in the North Atlantic <strong>and</strong> North Sea. InternationalJournal of Climatology, 11, pp. 545-558.Bamber, J.L., Riva, R.E.M., Vermeersen, B.L.A., & LeBrocq, A.M. (2009). Reassessment of thePotential Sea-Level Rise from a Collapse of the West Antarctic Ice Sheet. Science, 324, pp.901-903.Bates, B.C., Kundzewicz, Wu, S., & Palutikof, J.P. (Eds.). (2008). <strong>Climate</strong> Change <strong>and</strong> Water. TechnicalPaper of the Intergovernmental Panel on <strong>Climate</strong> Change, IPCC Secretariat, Geneva,210 pp.Bauer. L.J. (2006). Winter mortality of the blue crab (Callinectes sapidus) in the Chesapeake Bay.Master’s thesis, University of Maryl<strong>and</strong>.Beach, D. (2002). <strong>Coastal</strong> Sprawl: The effects of urban design on aquatic ecosystems in the United States.Pew Oceans Commission. Retrieved from http://www.pewtrusts.org.Becker, A., et al. (2011). <strong>Climate</strong> change impacts on international seaports: Knowledge, perceptions,<strong>and</strong> planning efforts among port adminstrators. Journal of Climatic Change, DOI:10.1007/s10584-011-0043-7Beever, J., Gray, W., Trescott, D., Cobb, D., Utley, J., Hutchinson, D., Gibbons, J., Walker, T.,Abimbola, M., Beever, L., <strong>and</strong> Ott, J. (2009, November 18). City of Punta Gorda <strong>Adaptation</strong>Plan, Southwest Florida Regional Planning Council <strong>and</strong> Charlotte Harbor National EstuaryProgram, Fort Meyers, FL. Technical Report 09-4.Bender, M. A., Knutson, T.R., Tuleya, R.E., Sirutis, J.J., Vecchi, G.A., Garner, S.T., & Held, I.M.(2010). Modeled impact of anthropogenic warming on the frequency of intense Atlantichurricanes. Science, 327(5964), doi:10.1126/science.1180568.Benedict, M.A. & McMahon, E.T. (2006). Green Infrastructure: Linking L<strong>and</strong>scapes <strong>and</strong> Communities.Washington, D.C., Isl<strong>and</strong> Press, 320 pp.Berke, P., Smith, G., & Lyles, W. (In press). Planning for Resiliency: An Evaluation of <strong>Coastal</strong>State Hazard Mitigation Plans. Natural Hazards Review.
146 <strong>Coastal</strong> <strong>Impacts</strong>, <strong>Adaptation</strong>, <strong>and</strong> <strong>Vulnerabilities</strong>Berkowitz, B. (2011, August 31). Special Report: Irene Wallops Flood InsuranceProgram, Reuters. Retrieved from http://www.reuters.com/article/2011/08/31/us-storm-irene-flood-idUSTRE77T5M620110831.Berkowitz, B. (2011, September 4). Scenarios - Katia <strong>and</strong> Lee Threaten Insurance Companies,Reuters. Retrieved from http://www.reuters.com/article/2011/09/04/us-storm-insurance-idUSTRE7832IJ20110904.Berrang-Ford, L., Ford, J.D., & Paterson, J. (2011). Are we adapting to climate change? GlobalEnvironmental Change, 21, pp. 25-33.Berry, H.L., Bowen, K., Kjellstrom, T. (2010). <strong>Climate</strong> change <strong>and</strong> mental health: a causal pathwaysframework. International Journal of Public Health, Volume 55, Number 2, 123-132, DOI:10.1007/s00038-009-0112-0.Bertness, M.D. & Ewanchuk, P.J. (2002). Latitudinal <strong>and</strong> climate-driven variation in the strength<strong>and</strong> nature of biological interactions in New Engl<strong>and</strong> salt marshes. Oecologia, 132, pp.392-401.Bin, O., Dumas, C., & Poulter, B. (2007). Measuring the <strong>Impacts</strong> of <strong>Climate</strong> Change on NorthCarolina <strong>Coastal</strong> Resources. National Commission on Energy Policy. Washington, DC.Bindoff, N.L. <strong>and</strong> coauthors. (2007). Observations: Oceanic climate change <strong>and</strong> sea level, <strong>Climate</strong>Change 2007: The Physical Science Basis, S. Solomon et al., (Eds.), Cambridge UniversityPress, pp. 385-432.Bird, E. (2011). <strong>Coastal</strong> Geomorphology: An Introduction. 2 nd Edition. John Wiley <strong>and</strong> Sons, Inc.,West Sussex, Engl<strong>and</strong>.Birkmann, J., Garschagen, M., Kraas, F., & Quang, N. (2010). Adaptive urban governance: newchallenges for the second generation of urban adaptation strategies to climate change.Sustainability Science, 5(2) pp. 185-206.Bjarnadottir, S., Li, Y., & Stewart, M.G. (2011). Social vulnerability index for coastal communitiesat risk to hurricane hazard <strong>and</strong> a changing climate. Natural Hazards, 59, pp. 1055-1075.Blackwell, K.D. & Oliver, J.D. (2008). The ecology of Vibrio vulnificus, Vibrio cholerae, <strong>and</strong> Vibrioparahaemolyticus in North Carolina estuaries. Journal of Microbiology. 46, pp.146-153.Bloom, A.A., Palmer, P.I., Fraser, A., Reay, D.S., & Frankenberg, C. (2010). Large-Scale Controlsof Methanogenesis Inferred from Methane <strong>and</strong> Gravity Spaceborne Data. Science, 327(5963),pp. 322–325.Blum, M.D., Roberts, H.H. (2009). Drowning of the Mississippi delta due to insufficient sedimentsupply <strong>and</strong> global sea-level rise. Nature Geoscience, 2, pp. 488-491.Blunden, J., Arndt, D.S., & Baringer, M.O. (Eds.). (2011). State of the <strong>Climate</strong> in 2010. Bulletin ofthe American Meteorological Society, 92(6), pp. S1–S266.Boesch, D.F., Coles, V.J., Kimmel, D.G., & Miller, W.D. (2007). <strong>Coastal</strong> dead zones <strong>and</strong> globalclimate change: Ramifications of climate change for Chesapeake Bay hypoxia. Excerptedfrom Regional <strong>Impacts</strong> of <strong>Climate</strong> Change: Four Case Studies in the United States, PewCenter on Global <strong>Climate</strong> Change, Arlington, Virginia, 20 pp.Bookman, C.A., Culliton, T.J., & Warren, M.A. (1999). Trends in U.S. <strong>Coastal</strong> Regions, 1970-1998.Addendum to the Proceedings, Trends <strong>and</strong> Future Challenges for U.S. National Ocean <strong>and</strong> <strong>Coastal</strong>Policy. National Oceanic <strong>and</strong> Atmospheric Administration (NOAA).Borja, Á., Dauer, D., Elliott, M., et al. (2010). Medium- <strong>and</strong> Long-term Recovery of Estuarine <strong>and</strong><strong>Coastal</strong> Ecosystems: Patterns, Rates <strong>and</strong> Restoration Effectiveness. Estuaries <strong>and</strong> Coasts, 33(6),pp. 1249-1260.Boruff, B.J., Emrich, C., & Cutter, S.L. (2005). Erosion hazard vulnerability of U.S. coastal counties.Journal of <strong>Coastal</strong> Research, 21(5), pp. 932-942.
References 147Bossart, G.D. (2011). Marine Mammals as Sentinel Species for Oceans <strong>and</strong> Human Health. VeterinaryPathology, 48(3) pp. 676-690Breen, A. & Rigby, D. (1985). Caution, working waterfront: the impact of change on marine enterprises.Waterfront Press.Bricker, S., Longstaff, B., Dennison, W., Jones, A., Boicourt, K., Wicks, C., & Woerner, J. (2007).Effects of Nutrient Enrichment In the Nation’s Estuaries: A Decade of Change. NOAA<strong>Coastal</strong> Ocean Program Decision Analysis Series No. 26. National Centers for <strong>Coastal</strong> OceanScience, Silver Spring, MD, 328 pp. Retrieved from http://ian.umces.edu/neea/.Briske, D.D., Fuhlendorf, S.D. & Smeins, F.E. (2006). A unified framework for assessment <strong>and</strong>application of ecological thresholds. Rangel<strong>and</strong> Ecology & Management, 59(3), pp. 225-236.Bromirski, P.D., Miller, A.J., Flick, R.E., & Auad, G. (2011). Dynamical suppression of SLR alongthe Pacific coast of North America: Indications for imminent acceleration, Journal of GeophysicalResearch – Oceans, 116, C07005, doi:10.1029/2010JC006759.Brown, C., Campbell, S., Henry, L.R., & Robinson, M.M. (2009). Public Listening Sessions Report:Sea Level Rise <strong>and</strong> Population Growth in North Carolina: The Albemarle-Pamlico Conservation<strong>and</strong> Communities Collaborative <strong>and</strong> the Albemarle-Pamlico National Estuary Program.Retrieved from http://www.cakex.org/virtual-library/826.Buonaiuto, F., Patrick, L., Gornitz, V., Hartig, E., Leichenko, R., & Vancura, P. (2010). <strong>Coastal</strong>Zones, Chapter 5, pp. 122-162, in NYSERDA ClimAID Team. Integrated Assessment forEffective <strong>Climate</strong> Change <strong>Adaptation</strong> Strategies in New York State. C. Rosenzweig, W.Solecki, A. DeGaetano, M. O’Grady, S. Hassol, P. Grabhorn, (Eds.). New York State EnergyResearch <strong>and</strong> Development Authority (NYSERDA), 17 Columbia Circle, Albany, New York,12203.Burke, E.J., Brown, S.J., & Christidis, N. (2006). Modeling the recent evolution of global drought<strong>and</strong> projections for the 21st century with the Hadley Centre <strong>Climate</strong> Model. Journal of Hydrometeorology,7(5), pp. 1113–1125.Burkett, V.R. (2011). Global climate change implications for coastal <strong>and</strong> offshore oil <strong>and</strong> gasdevelopment. Energy Policy, 39, pp. 7719–7725.Burkett, V.R., Nicholls, R.J., Fern<strong>and</strong>ez, L. & Woodroffe, C.D. (2008). <strong>Climate</strong> change impactson coastal biodiversity. Research Online, pp. 167-193. Retrieved from http://ro.uow.edu.au/scipapers/217.Burkett, V.R., Wilcox, D. A., Stottlemyer, R., Barrow, W., Fagre, D., Baron, J., Price, J., Nielsen,J. L., Allen, C. D., Peterson, D. L., Ruggerone, G. & Doyle, T. (2005). Nonlinear dynamicsin ecosystem response to climate change: Case studies <strong>and</strong> policy implications. EcologicalComplexity, 2, pp. 357-394.Burnett, M, Carbin, G., & Schaefer, J. (2008). An Analysis of the 2007-2008 Tornado Cool Season.National Weather Center Research Experience for Undergraduates, Norman, OK <strong>and</strong>University of Missouri, Columbia, MO. Retrieved from http://www.caps.ou.edu/reu/reu08/Final%20Papers/Burnett_final_paper.pdf.Burton, C. G. (2010). Social vulnerability <strong>and</strong> hurricane impact modeling. Natural Hazards Review,11(2), pp. 58-68.Caffrey, M., & Beavers, R. (2008). George Wright Forum, Protecting Cultural Resources in U.S.National Parks from <strong>Climate</strong> Change, 25(2), pp. 86-97.Cahoon, D. (2006). A review of major storm impacts on coastal wetl<strong>and</strong> elevations. Estuaries <strong>and</strong>Coasts, 29(6), pp. 889-898.Cahoon, D.R., Hensel, P.F., Spencer, T., Reed, D.J., Mc-Kee, K.L., & Saintilan, N. (2006). <strong>Coastal</strong>wetl<strong>and</strong> vulnerability to relative sea-level rise: wetl<strong>and</strong> elevation trends <strong>and</strong> process
148 <strong>Coastal</strong> <strong>Impacts</strong>, <strong>Adaptation</strong>, <strong>and</strong> <strong>Vulnerabilities</strong>controls. In: Wetl<strong>and</strong>s <strong>and</strong> Natural Resource Management [Verhoeven, J.T.A., B. Beltman, R.Bobbink, <strong>and</strong> D. Whigham (Eds.)]. Ecological studies volume 190. Springer, Berlin <strong>and</strong> NewYork, pp. 271-292.Cahoon, D.R., Lynch, J.C., & Powell, A.N. (1996). Marsh vertical accretion in a southern Californiaestuary, USA. Estuarine <strong>Coastal</strong> <strong>and</strong> Shelf Science, 43, pp. 19-32.Cahoon, D.R., Reed, D.J., Kolker, A.S., Brinson, M.M., Stevenson, J.C., Riggs, S., Christian, R.,Reyes, E., Voss, C. & Kunz, D. (2009). <strong>Coastal</strong> wetl<strong>and</strong> sustainability. In, <strong>Coastal</strong> Sensitivityto Sea-Level Rise: A Focus on the Mid-Atlantic Region. A report by the U.S. <strong>Climate</strong> ChangeScience Program <strong>and</strong> the Subcommittee on Global Change Research. J.G. Titus (coordinatinglead author), K.E. Anderson, D.R. Cahoon, D.B. Gesch, S.K. Gill, B.T. Gutierrez, E.R. Thieler,<strong>and</strong> S.J. Williams (lead authors). U.S. Environmental Protection Agency, Washington DC, pp.57-72.Caires, S., Swail, V.R., & Wang, X.L. (2006). Projection <strong>and</strong> Analysis of Extreme Wave <strong>Climate</strong>.Journal of <strong>Climate</strong>, 19(21), pp. 5581, doi: 10.1175/JCLI3918.1Cardoso, P.G., Leston, S., Grilo, T.F., et al. (2010). Implications of nutrient decline in the seagrassecosystem success. Marine Pollution Bulletin, 60(4), pp. 601-608.Cardoso, P.G., Raffaelli, D., Lillebø, A.I., et al. (2008). The impact of extreme flooding events <strong>and</strong>anthropogenic stressors on the macrobenthic communities’ dynamics. Estuarine, <strong>Coastal</strong> <strong>and</strong>Shelf Science, 76(3), pp. 553-565.Carter, D.J.T. & Draper, L. (1988). Has the north-east Atlantic become rougher? Nature, 332, pp.494.Cato Institute. (2001). Cato H<strong>and</strong>book for Congress: Policy Recommendations for the 107thCongress, pp. 431-439. Retrieved from http://www.cato.org/pubs/h<strong>and</strong>book/hb107/hb107-40.pdfCayan, D.R., Bromirski, P.D., Hayhoe, K., Tyree,M., Dettinger, M.D., & Flick, R.E. (2008). <strong>Climate</strong>change projections of the sea level extremes along the California coast. Climatic Change, 87,pp. S57-S73.CCSP (<strong>Climate</strong> Change Science Program), 2009b. Thresholds of climate change in ecosystems.Fagre, D.B., Charles, C.W., Allen, C.D., Birkel<strong>and</strong>, C., Chapin III, F.S., Groffman, P.M.,Guntenspergen, G.R., Knapp, A.K., McGuire, A.D., Mulholl<strong>and</strong>, P.J., Peters, D.P.C., Roby,D.D., <strong>and</strong> Sugihara, G. A Report by the U.S. <strong>Climate</strong> Change Science Program <strong>and</strong> theSubcommittee on Global Change Research. U.S. Geological Survey, Reston, VA.CCSP (<strong>Climate</strong> Change Science Program). (2008). <strong>Impacts</strong> of <strong>Climate</strong> Change <strong>and</strong> Variability onTransportation Systems <strong>and</strong> Infrastructure: Gulf Coast Study, Phase I, in: Savonis, M.J., V.R.Burkett, <strong>and</strong> J.R. Potter (Eds.), Synthesis <strong>and</strong> Assess ment Product 4.7., U.S. Department ofTransportation, Washington, DC, 445 pp.CCSP (<strong>Climate</strong> Change Science Program). (2009a). <strong>Coastal</strong> Sensitivity to Sea-Level Rise: A Focuson the Mid-Atlantic Region. A report by the U.S. <strong>Climate</strong> Change Science Program <strong>and</strong> theSubcommittee on Global Change Research. [James G. Titus (Coordinating Lead Author), K.Eric Anderson, Donald R. Cahoon, Dean B. Gesch, Stephen K. Gill, Benjamin T. Gutierrez,E. Robert Thieler, <strong>and</strong> S. Jeffress Williams (Lead Authors)]. U.S. Environmental ProtectionAgency, Washington D.C., USA, 320 pp.CDC (Centers for Disease Control). (2009). Vector-borne <strong>and</strong> zoonotic diseases. Retrieved fromhttp://www.cdc.gov/climatechange/effects/vectorborne.htm.CDC (Centers for Disease Control). (2012). Dengue <strong>and</strong> <strong>Climate</strong>. Retrieved from http://www.cdc.gov/dengue/entomologyEcology/climate.html.
References 149Cela, M., Hulsey, J., & Titus, J.G. (2010). South Florida. In The Likelihood of Shore Protection alongthe Atlantic Coast of the United States. Volume 2. Report by the South Florida Regional PlanningCouncil to the U.S. Environmental Protection Agency. Washington, D.C. pp. 515-585Center for Ocean Solutions. (2011). Decision Guide: Selecting Decision Support Tools for MarineSpatial Planning. The Woods Institute for the Environment, Stanford University, California.Environmental Modelling Software. 26(5), pp.593-604.Chen, J.L., Wilson, C.R., & Tapley, B.D. (2011). Interannual variability of Greenl<strong>and</strong>ice losses from satellite gravimetry. Journal of Geophysical Research, 116:B07406doi:10.1029/2010JB007789.Christensen, F.T. (1994). Ice Ride-up <strong>and</strong> Pile-up on Shores <strong>and</strong> <strong>Coastal</strong> Structures. Journal of<strong>Coastal</strong> Research, 10(3), pp. 681-701.Chu-Agor, M.L., Muñoz-Carpena, R., Kiker, G., Emanuelsson, A., & Linkov I. (2011) Exploringsea level rise vulnerability of coastal habitats through global sensitivity <strong>and</strong> uncertaintyanalysis. Environmental Modelling Software. doi: 10.1016/j.envsoft.Church, J.A. & White, N.J. ( 2011). Sea-level rise from the late 19th to the early 21st Century.Surveys in Geophysics, doi:10.1007/s10712-011-9119-1.Church, J.A. & White, N.J. (2006). A 20th century acceleration in global sea-level rise, GeophysicalResearch Letters, 33, L01602, doi:10.1029/2005GL024826.Church, J.A., White, N. J., Konikow, L. F., Domingues, C. M., Cogley, J. G., Rignot, E., et al.(2011). Revisiting the Earth’s sea‐level <strong>and</strong> energy budgets from 1961 to 2008. GeophysicalResearch Letters, 38, L18601.Church, J.A., Woodworth, P.L., Aarup, T., & Wilson W.S. (Eds.). (2010). Sea-level rise <strong>and</strong> variability,Wiley-Blackwell, 428 pp.Claessens, L., Schoorl, J.M., Verburg, P.H., et al. (2009). Modelling interactions <strong>and</strong> feedbackmechanisms between l<strong>and</strong> use change <strong>and</strong> l<strong>and</strong>scape processes. Agriculture, Ecosystems <strong>and</strong>Environment, 129, pp. 157-170.Clark, W., Kassakian, J., & Titus, J.G. (2010). North Carolina. In The Likelihood of Shore Protectionalong the Atlantic Coast of the United States, Volume 1. . Report by North Carolina Seagrant tothe U.S. Environmental Protection Agency, Washington, D.C. pp. 889-1032.Cloern, J.E. (1987). Turbidity as a control on phytoplankton biomass <strong>and</strong> productivity in estuaries.Continental Shelf Research, 7, pp. 1367-1381.Cloern, J.E., Jassby, A.D., Thompson, J.K., &. Hieb, K.A. (2007). A cold phase of the East Pacifictriggers new phytoplankton blooms in San Francisco Bay. Proceedings of the National Academyof Sciences, 104, pp. 18561–18565. doi:10.1073/pnas.0706151104.Cloern, J.E., Knowles, N., Brown, L.R., Cayan, D., Dettinger, M.D., Morgan, T.L., Schoellhamer,D.H., Stacey, M.T., van der Wegen, M., Wagner, R.W., & Jassby, A.D. (2011). Projected evolutionof California’s San Francisco Bay-Delta-River system in a century of climate change.PLoS ONE, 6: e24465. doi:10.1371/journal.pone.0024465.Colgan, C.S. (2004). The contribution of working waterfronts to the Maine economy. Maine’s WorkingWaterfront Coalition. Retrieved from http://muskie.usm.maine.edu/Publications/Working-Waterfronts.pdfColle, B.A., Buonaiuto, F., Bowman, M.J., Wilson, R.E., Flood, R., Hunter, R. & Hill, D. (2008).New York City’s vulnerability to coastal flooding - Storm surge modeling of past cyclones.Bulletin of the American Meteorological Society, 89(6), pp. 829-841. doi: 10.1175/2007bams2401.1.Collins, M., An, S.I., Cai, W.J., Ganachaud, A., Guilyardi, E., Jin, F.F., Jochum, M., Lengaigne,M., Power, S., Timmermann, A., Vecchi, G. & Wittenberg, A. (2010). The impact of globalwarming on the tropical Pacific ocean <strong>and</strong> El Nino. Nature Geoscience, 3(6), pp. 391-397.
150 <strong>Coastal</strong> <strong>Impacts</strong>, <strong>Adaptation</strong>, <strong>and</strong> <strong>Vulnerabilities</strong>Colwell, R. R. (2008). Warming Oceans, Increasing Disease (Mapping the Health Effects of<strong>Climate</strong> Change). In: 2008-2009 State of the Wild, A Global Portrait of Wildlife, Wildl<strong>and</strong>s,<strong>and</strong> Oceans, Wildlife Conservation Society, Eva Fearn, Kent H. Redford, (Eds.). Part II, pp.115-118. Isl<strong>and</strong> Press, Washington, DC.Commerce Secretary Gary Locke Announces $167 Million in Recovery Act Funding for 50 <strong>Coastal</strong> RestorationProjects . June 30, 2009. Concannon, T., Hussain, M., Hudgens, D., & Titus, J.G. (2010). Georgia. In The Likelihood of ShoreProtection along the Atlantic Coast of the United States. Volume 2: New Engl<strong>and</strong> <strong>and</strong> the Southeast.Report by the <strong>Coastal</strong> Georgia Regional Development Commission to the U.S. EnvironmentalProtection Agency. Washington, DC, pp. 255-322.Conner, W.H., Doyle, T.W. & Krauss, K.W. (Eds.). (2007a). Ecology of tidal freshwater forestedwetl<strong>and</strong>s of the Southeastern United States: The Netherl<strong>and</strong>s, Springer, 505 pp.Conner, W.H., Krauss, K.W. & Doyle, T.W. (2007b). Ecology of tidal freshwater forests in coastaldeltaic Louisiana <strong>and</strong> northeastern South Carolina. In, Conner, W.H., Doyle, T.W. <strong>and</strong>Krauss, K.W. (Eds.), Ecology of tidal freshwater forested wetl<strong>and</strong>s of the SoutheasternUnited States: The Netherl<strong>and</strong>s, Springer, pp. 223-253.Conrads, P.A., Roehl, E.A., Sexton, C.T., Tufford, D.L., Carbone, G.J., Dow, K., & Cook, J.B.(2010). Estimating salinity intrusion effects due to climate change along the Gr<strong>and</strong> Str<strong>and</strong>of the South Carolina coast. Conference Proceedings Paper for the 4th Federal InteragencyHydrologic Modeling Conference. Las Vegas, NV, June 2010.Convention on Biological Diversity. (2010). Global Biodiversity Outlook 3. Montreal. Retrievedfrom http://www.cbd.int/doc/publications/gbo/gbo3-final-en.pdf.Cooley, D. & Ol<strong>and</strong>er, L. (2011). Stacking ecosystem services payments: Risks <strong>and</strong> solutions.Nicholas Institute for Environmental Policy Solutions Report NI WP 11-04, Duke University.Cooper M.J.P., Beevers, M.D., & Oppenheimer, M. (2005). Future sea-level rise <strong>and</strong> the NewJersey coast. Science Technology <strong>and</strong> Policy Program, Woodrow Wilson School of Public <strong>and</strong>International Affairs, Princeton University, Princeton, NJ.Cordesman, A.H. & Fitzgerald, E.K. (2009). The 2010 Quadrennial Defense Review: A+, F,or Dead on Arrival?, September 9, 2009. Center for Strategic <strong>and</strong> International Studies.Retrieved from http://csis.org/publication/2010-quadrennial-defense-review.Craghan, M.C, Kassakian, J., Hudgens, D., & Titus, J.G. (2010). New Jersey. In James G. Titus <strong>and</strong>Daniel Hudgens (Eds.). The Likelihood of Shore Protection along the Atlantic Coast of the UnitedStates. Volume 1: Mid-Atlantic. Report to the U.S. Environmental Protection Agency. Washington,D.C. pp. 261-385.Crain, C.M., Halpern, B.S., Beck, M.W., et al. (2009). Underst<strong>and</strong>ing <strong>and</strong> Managing HumanThreats to the <strong>Coastal</strong> Marine Environment. Annals of the New York Academy of Sciences,1162(1), pp. 39-62.Crist, P., Madden, K., Varley, I., Eslinger, D., Walker, D., Anderson, A., Morehead, S., & Dunton,K. (2012). Integrated L<strong>and</strong>-Sea Planning: Technical Guide to the Integrated L<strong>and</strong>-Sea PlanningToolkit. EBM Tools Network. Retrieved from www.ebmtools.org.Crooks, S., Emmett-Mattox, S. & Findsen, J. (2010). Findings of the National Blue Ribbon Panel on theDevelopment of a Greenhouse Gas Protocol for Tidal Wetl<strong>and</strong>s Restoration <strong>and</strong> Management: ActionPlan to Guide Protocol Development. Arlington, VA: Restore America’s Estuaries.Crooks, S., Herr, D., Tamel<strong>and</strong>er, J., Laffoley, D., & V<strong>and</strong>ever, J. (2011). Mitigating <strong>Climate</strong> Changethrough Restoration <strong>and</strong> Management of <strong>Coastal</strong> Wetl<strong>and</strong>s <strong>and</strong> Near-shore Marine Ecosystems.Environmental Department Paper 121, Washington, DC: World Bank.
References 151Crossett, K.M., Culliton, T.J., Wiley, P.C., & Goodspeed, T.R. (2004). Population Trends Alongthe <strong>Coastal</strong> United States: 1980-2008. National Oceanic <strong>and</strong> Atmospheric Administration.Retrieved from http://coastalsocioeconomics.noaa.gov/assessment/welcome.html.Cruz, A.M. & Krausmann, E. (2008). Damage to offshore oil <strong>and</strong> gas facilities following hurricanesKatrina <strong>and</strong> Rita: an overview. Journal of Loss Prevention in the Process Industries, 21(6),pp. 620-626.Culver, M.E., Schubel, J.R., Davidson, M.A., Haines, J., & Texeira, K.C. (Eds.). (2010). Proceedingsfrom the Sea Level Rise <strong>and</strong> Inundation Community Workshop, L<strong>and</strong>sdowne, VA, Dec 3-52009. Sponsored by the National Oceanic <strong>and</strong> Atmospheric Administration <strong>and</strong> U.S. GeologicalSurvey, 81pp.Cutter, S.L., Johnson, L.A., Finch, C., & Berry, M. (2007). The U.S. Hurricane Coasts: IncreasinglyVulnerable? Environment, 49(7), pp. 8-20.Dahl, T.E. (2011). Status <strong>and</strong> Trends of Wetl<strong>and</strong>s in the Conterminous United States 2004 - 2009. Washington,DC: U.S. Department of the Interior, Fish <strong>and</strong> Wildlife Service.Dahl, T.E., & Johnson, C.E. (1991). Status <strong>and</strong> Trends of Wetl<strong>and</strong>s in the Conterminous United States,Mid-1970’s to Mid-1980’s. Washington, DC: U.S. Department of the Interior, Fish <strong>and</strong> WildlifeService.Dai, A., Trenberth, K. E., & Qian, T. (2004). A global dataset of Palmer drought severity index for1870–2002: Relationship with soil moisture <strong>and</strong> effects of surface warming. Journal of Hydrometeorology,5, pp. 1117-1130.Data <strong>and</strong> Tools for Incorporating <strong>Climate</strong> Change <strong>Impacts</strong> into Community Planning <strong>and</strong> ProjectDesign. (2011, March 30). MetroCenter, 101 Eighth Street Oakl<strong>and</strong>, CA 94607.Davidson, M.A. & Kana, T.W. (1988). Future sea-level rise <strong>and</strong> its Implications for Charleston,South Carolina. In M. H. Glantz, ed., Societal responses to regional climate change: Forecasting byanalogy. Boulder, CO: Westview Press.Davis, J.L. & Mitrovica, J.X. (1996). Glacial isostatic adjustment <strong>and</strong> the anomalous tide gaugerecord of eastern North America. Nature, 379, pp. 331–333.Day, J.W.J., Mitsch, W.J., Orth, K., Mashriqui, H., Reed, R.J., Shabman, L., Simenstad, C.A.,Streever, B.J., Twilley, R.R., Watson, C.C., Wells, J.T., & Whigham, D.F. (2007). Restorationof the Mississippi Delta: Lessons from Hurricanes Katrina <strong>and</strong> Rita. Science, 315(5819), pp.1679-1684.Debernard, J.B. & Roed, L.P. (2008). Future wind, wave <strong>and</strong> storm surge climate in the NorthernSeas: a revisit. Tellus, 60A, pp. 427-438.Delaune, R.D. & Wright, A.L. (2011). Projected Impact of Deepwater Horizon Oil Spill on US GulfCoast Wetl<strong>and</strong>s. Soil Science Society of America Journal, 75(5), pp. 1602-1612.Delpla, I., Jung, A.-V., Baures, E., Clement, M., & Thomas, O. (2009). <strong>Impacts</strong> of climate changeon surface water quality in relation to drinking water production. Environment International,35(8), pp. 1225-1233.Derksen, C. & Brown, R. (2011). Snow [in Arctic Report Card 2011], Retrieved from http://www.arctic.noaa.gov/reportcard/snow.html.Dickens, G.R. (2001). Modeling the global carbon cycle with gas hydrate capacitor: Significancefor the latest Paleocene thermal maximum, in: Paull, C.K., <strong>and</strong> W.P. Dillon (Eds.), NaturalGas Hydrates: Occurrence, Distribution, <strong>and</strong> Detection. Geophysical Monographs, 124, AmericanGeophysical Union, Washington, DC, pp. 19-38.Dickhoff, W.D., Collier, T.K., & Varanasi, U. (2007). The Seafood Dilemma: A Way Forward.Guest Director’s Line. Fisheries, 32, pp. 244-246.
152 <strong>Coastal</strong> <strong>Impacts</strong>, <strong>Adaptation</strong>, <strong>and</strong> <strong>Vulnerabilities</strong>Dietz, M.E. (2007). Low impact development practices: A review of current research <strong>and</strong> recommendationsfor future directions. Water Air <strong>and</strong> Soil Pollution, 186(1-4), pp.351-363.DOD (U.S Department of Defense). (2010). Quadrennial Defense Review. Retrieved from http://www.defense.gov/qdr/.DOD (U.S Department of Defense). (2011). Readiness <strong>and</strong> the environmental protection initiative.5 th Annual Report to Congress. Retrieved from http://www.denix.osd.mil/sri/upload/REPI2011RTC.pdf.DOE (U.S. Department Of Energy). (2011). 2010 Renewable Energy Data Book. Retrieved fromhttp://www.nrel.gov/analysis/pdfs/51680.pdf.Doney, S.C., Ruckelshaus, M., Emmett Duffy, J., Barry, J.P., Chan, F., English, C.A., Galindo,H.M., Grebmeier, J.M., Hollowed, A.B., Knowlton, N., Polovina, J., Rabalais, N.N., Sydeman,W.J., & Talley, L.D. (2012). <strong>Climate</strong> Change <strong>Impacts</strong> on Marine Ecosystems. Annual Review ofMarine Science, 4, pp. 11-37.DOT (U.S. Department of Transportation). (2011). A framework for considering climate change intransportation <strong>and</strong> l<strong>and</strong> use scenario planning: final report. Lessons Learned from an InteragencyPilot Project on Cape Cod. John A. Volpe National Transportation Systems Center.U.S. Department of Transportation, Cambridge, MA.Douglas, E., Kirshen, P., Paolisso, M., Watson, C., Wiggin, J., Enrici, A., & Ruth, M. (2012). <strong>Coastal</strong>Flooding <strong>and</strong> Environmental Justice: Identifying Potential Strategies for Adapting to <strong>Climate</strong>Change in Two Urban Communities in the Boston Metropolitan Area, Massachusetts, in press,Mitigation <strong>and</strong> <strong>Adaptation</strong> Strategies for Global Change.Douglas, E.M. & Fairbank, C.A. (2011). Is Precipitation in Northern New Engl<strong>and</strong> BecomingMore Extreme? Statistical Analysis of Extreme Rainfall in Massachusetts, New Hampshire,<strong>and</strong> Maine <strong>and</strong> Updated Estimates of the 100-Year Storm. Journal of Hydrologic Engineering,16(3), pp. 203-217.Doyle, T.W. <strong>and</strong> Girod, G. (1997). The frequency <strong>and</strong> intensity of Atlantic hurricanes <strong>and</strong> theirinfluence on the structure of south Florida mangrove communities. In, H. Diaz <strong>and</strong> R.Pulwarty (Eds.), Hurricanes, Climatic Change <strong>and</strong> Socioeconomic <strong>Impacts</strong>: A CurrentPerspective, Westview Press, New York, N.Y., pp. 111-128.Doyle, T.W., Conner, W.H., Day, R.H., Krauss, K.W. & Swarzenski, C.M. (2007c). Wind damage<strong>and</strong> salinity effects of Hurricanes Katrina <strong>and</strong> Rita on coastal baldcypress forests of Louisiana.In, Science <strong>and</strong> the Storms: the USGS Response to the Hurricanes of 2005: Reston, Va.,U.S. Geological Survey, USGS Circular 1306, pp. 163-168. Retrieved from http://pubs.usgs.gov/circ/1306/pdf/c1306_ch6_f.pdf.Doyle, T.W., Conner, W.H., Ratard, M. & Inabinette, L.W. (2007b). Assessing the impact of tidalflooding <strong>and</strong> salinity on long-term growth of baldcypress under changing climate <strong>and</strong> riverflow.In, Conner, W.H., Doyle, T.W. <strong>and</strong> Krauss, K.W. (Eds.), Ecology of tidal freshwaterforested wetl<strong>and</strong>s of the Southeastern United States: The Netherl<strong>and</strong>s, Springer, pp. 411-445.Doyle, T.W., Girod, G.F. <strong>and</strong> Books, M.A. (2003). Modeling mangrove forest migration alongthe southwest coast of Florida under climate change In, Ning, Z.H., Turner, R.E., Doyle, T.,<strong>and</strong> Abdollahi, K. Integrated Assessment of the <strong>Climate</strong> Change <strong>Impacts</strong> on the Gulf CoastRegion: Baton Rouge, La. GRCCC <strong>and</strong> LSU Graphic Services, pp. 211-221.Doyle, T.W., Krauss, K.W., Conner, W.H. <strong>and</strong> From, A.S. (2010). Predicting the retreat <strong>and</strong> migrationof tidal forests along the northern Gulf of Mexico under sea-level rise. Forest Ecology <strong>and</strong>Management, 259, pp. 770-777.Doyle, T.W., O’Neil, C.P., Melder, M.P.V., From, A.S. & Palta, M.M. (2007a). Tidal freshwaterswamps of the southeastern United States: effects of l<strong>and</strong> use, hurricanes, sea-level rise, <strong>and</strong>
References 153climate change. In, Conner, W.H., Doyle, T.W. <strong>and</strong> Krauss, K.W. (Eds.), Ecology of tidalfreshwater forested wetl<strong>and</strong>s of the Southeastern United States: The Netherl<strong>and</strong>s, Springer,pp. 1-28.Edwards, M. & Richardson, A.J. (2004). Impact of climate change on marine pelagic phenology<strong>and</strong> trophic mismatch. Nature, 430, pp. 881-884.Eicken, H., Gradinger, R. et al. (2005). Sediment transport by sea ice in the Chukchi <strong>and</strong> BeaufortSeas: Increasing importance due to changing ice conditions? Deep-Sea Research II, 52, pp.3281-3302.Emch, M., Feldacker, C., Islam, M.S. & Ali, M. (2008). Seasonality of cholera from 1974 to 2005: areview of global patterns. International Journal of Health Geographic’s, 7(31), pp. 1.Emmerson, C. (2011). The future history of the Arctic (Vintage).Emrich, C. T. & Cutter, S.L. (2011). Social vulnerability to climate-sensitive hazards in thesouthern United States. Weather, <strong>Climate</strong>, <strong>and</strong> Society, 3(3), pp. 193-208.EPA (U.S. Environmental Protection Agency). Non-pollution Discharge Elimination website.Retrieved from http://cfpub.epa.gov/npdes/home.cfm?program_id=5.EPA (U.S. Environmental Protection Agency). (2005). National <strong>Coastal</strong> Condition Report II.Office of Research <strong>and</strong> Development/ Office of Water EPA-620/R-03/002. Washington, D.C.286 pp. Retrieved from http://www.epa.gov/owow/oceans/nccr2/.EPA (U.S. Environmental Protection Agency). (2008). Effects of <strong>Climate</strong> Change on Aquatic InvasiveSpecies <strong>and</strong> Implications for Management<strong>and</strong> Research, EPA/600/R-08/014. U.S. EnvironmentalProtection Agency, Washington, D.C., pp. 337.EPA (U.S. Environmental Protection Agency). (2008). Planning for <strong>Climate</strong> Change <strong>Impacts</strong> atU.S. Ports. White Paper prepared by ICF International for the U.S. EPA.EPA (U.S. Environmental Protection Agency). (2009). L<strong>and</strong>-use scenarios: national-scale housingdensityscenarios consistent with climate change storylines. U.S. Environmental ProtectionAgency, Washington, D.C.EPA (U.S. Environmental Protection Agency). (2010). ICLUS V1.3 User’s Manual: ARCGIS Toolsfor Modeling US Housing Density Growth (Final) 2010. U.S. Environmental ProtectionAgency, Washington, DC, EPA/600/R-09/143F, 2010.EPA (U.S. Environmental Protection Agency). (2011). National <strong>Coastal</strong> Condition Report IV.Retrieved from http://water.epa.gov/type/oceb/assessmonitor/nccr4_factsheet.cfm.EPA (U.S. Environmental Protection Agency). (2012). Vulnerability assessments in support ofthe <strong>Climate</strong> Ready Estuaries program: A novel approach using expert judgment, VolumeI: Results for the San Francisco Estuary Partnership. National Center for EnvironmentalAssessment, Washington, DC; EPA/600/R-11/058a. Available from the National TechnicalInformation Service, Springfield, VA. Retrieved from http://www.epa.gov/ncea.EPA (U.S. Environmental Protection Agency). (2012). Vulnerability Assessments in Support ofthe <strong>Climate</strong> Ready Estuaries Program: A Novel Approach Using Expert Judgment, VolumeII: Results for the Massachusetts Bays Program. National Center for Environmental Assessment,Washington, DC; EPA/600/R-11/058b. Available from the National Technical InformationService, Springfield, VA. Retrieved from http://www.epa.gov/ncea.EPRI (Electronic Power Research Institute). (2011). Mapping <strong>and</strong> Assessment of the United StatesOcean Wave Energy Resource. Palo Alto, CA: 1024637. Retrieved from http://www1.eere.energy.gov/water/pdfs/mapping<strong>and</strong>assessment.pdf.Esnard, A-M, Sapat, A., & Mitsova, D. (2011). An index of relative displacement risk to hurricanes.Natural Hazards DOI: 10.1007/s11069-011-9799-3
154 <strong>Coastal</strong> <strong>Impacts</strong>, <strong>Adaptation</strong>, <strong>and</strong> <strong>Vulnerabilities</strong>Esteban, M., Webersick, C., & Shibayama, T. (2009). Estimation of the economic costs of nonadapting Japanese port infrastructure to a potential increase in tropical cyclone intensity.IOP Conference Series: Earth <strong>and</strong> Environmental Science, 6(32), pp. 322003.Fairbanks, R.G., (1989). A 17,000-year glacio-eustatic sea level record--influence of glacial meltingrates on the Younger Dryas event <strong>and</strong> deep-sea circulation. Nature, 342(6250), pp. 637-642.Favre, A. & Gershunov, A. (2006). Extra-tropical cyclonic/anticyclonic activity in North-EasternPacific <strong>and</strong> air temperature extremes in Western North America. <strong>Climate</strong> Dynamics, 26,617–629.FEMA (U.S. Federal Emergency Management Agency). (2008). Hurricane Ike Impact Report.Retrieved from http://www.fema.gov/pdf/hazard/hurricane/2008/ike/impact_report.pdf.Ferdaña, Z., Newkirk, S., Whelchel, A.W., Gilmer, B., & Beck, M.W. (2010). Building InteractiveDecision Support to Meet Management Objectives for <strong>Coastal</strong> Conservation <strong>and</strong> HazardMitigation on Long Isl<strong>and</strong>, New York, USA, in Andrade Pérez, A., Herrera Fern<strong>and</strong>ez, B.<strong>and</strong> Cazzolla Gatti, R. (Eds.) Building Resilience to <strong>Climate</strong> Change: Ecosystem-based adaptation<strong>and</strong> lessons from the field. Gl<strong>and</strong>, Switzerl<strong>and</strong>: IUCN, pp. 72-87. Retrieved from http://data.iucn.org/dbtw-wpd/edocs/2010-050.pdf.Ferguson, S. (2007). Ride the wave. Engineering, 248(4), pp. 42-44.Fischlin, A., Midgley, G.F, Price, J.T., Leemans, R., Gopal, B., Turley, C., Rounsevell, M.D.A.,Dube, O.P., Tarazona, J. & Velichko, A.A. (2007). Ecosystems, their properties, goods, <strong>and</strong>services. In: <strong>Climate</strong> Change 2007: <strong>Impacts</strong>, <strong>Adaptation</strong> <strong>and</strong> Vulnerability. Contribution of WorkingGroup II to the Fourth Assessment Report of the Intergovernmental Panel on <strong>Climate</strong> Change,[Parry, M.L., O.F. Canziani, J.P. Palutikof, P.J. van der Linden <strong>and</strong> C.E. Hanson (Eds.)].Cambridge University Press, Cambridge, UK, pp. 211-272.Fish <strong>and</strong> Wildlife Service. (2009). Status <strong>and</strong> Trends of Wetl<strong>and</strong>s in the Coterminous U.S. 2004 to2009. Retrieved from http://www.fws.gov/wetl<strong>and</strong>s/status<strong>and</strong>trends2009/KeyMessages.html.Fish <strong>and</strong> Wildlife Service. (2012). <strong>Coastal</strong> Program: Regional Showcase of Accomplishments,Fiscal Year 2010. Retrieved from http://www.fws.gov/coastal.FitzGerald, D.M., Fenster, M.S., Argow, B.,A. & Buynevich, I.V. (2008). <strong>Coastal</strong> impacts due tosea-level rise. Annual Review of Earth <strong>and</strong> Planetary Sciences, 36, pp. 601-647.Fleishman, E., Blockstein, D.E., Hall, J.A., Mascia, M.B., Rudd, M.A., Scott, J. M., Sutherl<strong>and</strong>, W.J.,Bartuska, A.M., Brown, A.G., Christen, C.A., Clement, J.P., DellaSala, D., Duke, C.S., Eaton,M., Fiske, S.J., Gosnell, H., Haney, J.C., Hutchins, M., Klein, M.L., Marqusee, J., Noon, B.R.,Nordgren, J.R., Orbuch, P.M., Powell, J. Quarles, S.P., Saterson, K.A., Savitt, C.C., Stein, B.A.Webster, M.S., & Vedder, A. (2011). Top 40 priorities for science to inform U.S. conservation<strong>and</strong> management policy. Bioscience, 61(4), pp. 209-300.Fong, T., Phanikumar, M.S., Xagoraraki, I. & Rose, J.B. (2010). Quantitative detection of humanadenoviruses in wastewater <strong>and</strong> combined sewer overflows influencing a Michigan River.Applied & Environmental Microbiology, 73(3), pp. 715-723, doi: 10.1128/AEM.01316-09.Frazier, T. G., Wood, N., & Yarnal, B. (2010b). Stakeholder perspectives on l<strong>and</strong>-use strategies foradapting to climate change-enhances coastal hazards: Sarasota, Florida. Applied Geography,30, pp. 506-517.Frazier, T. G., Wood, N., Yarnal, B., & Bauer, D.H. (2010a). Influence of potential sea level rise onsocietal vulnerability to hurricane storm-surge hazards, Sarasota County, Florida. AppliedGeography, 30, pp. 490-505.Fritz, H.M., et al. (2008). Hurricane Katrina storm surge reconnaissance. Journal of Geotechnical <strong>and</strong>Geoenvironmental Engineering, 134, pp. 644.Frumkin, H., Hess, J., Luber, G., Malilay, J., & McGeehin. M. (2008, March) <strong>Climate</strong> Change: The
References 155Public Health Response. American Journal of Public Health, 98(3), pp. 435-445, doi: 10.2105/AJPH.2007.119362.Gage. K., Burkot, T.R., Eisen, R.J., & Hayes, E.B. (2008). <strong>Climate</strong> <strong>and</strong> Vectorborne Diseases. AmericanJournal of Preventive Medicine, 35(5), pp. 436-450.Galbraith, H., Jones, R., Park, R., Clough, J., Herrod-Julius, S., Harrington, B. & Page, G. (2005).Global <strong>Climate</strong> Change <strong>and</strong> Sea Level Rise: Potential Losses of Intertidal Habitat for Shorebirds.USDA Forest Service Gen. Tech. Rep., PSW-GTR-191.Gall, M., Borden,K.A., Emrich, C.T., & Cutter, S.L. (2011). The unsustainable trend of naturalhazard losses in the United States. Sustainability, 3, pp. 2157-2181, Doi:10.3390/su3112157.Game, E.T., Watts, M.E.,, Wooldridge, S., Possingham, H.P. (2008). Planning for Persistence inMarine Reserves: A Question of Catastrophic Importance. Ecological Applications, 18(3), pp.670-680.Ganju, N.K.& Schoellhamer, D.H. (2010). Decadal-timescale estuarine geomorphic change underfuture scenarios of climate <strong>and</strong> sediment supply. Estuaries <strong>and</strong> Coasts, 33, pp. 15-29.GAO (U.S. Government Accountability Office) (2007). <strong>Climate</strong> Change: Financial Risks to Federal<strong>and</strong> Private Insurers in Coming Decades are Potentially Significant. GAO-07-285.GAO (U.S. Government Accountability Office). (2003). Alaska Native Villages: Most Are Affected byFlooding <strong>and</strong> Erosion, but Few Qualify for Federal Assistance. GAO-04-142.GAO (U.S. Government Accountability Office). (2009). Alaska Native Villages: Limited ProgressHas Been Made on Relocating Villages Threatened by Flooding <strong>and</strong> Erosion. GAO-09-551.GAO (U.S. Government Accountability Office). (2010). Natural Catastrophe Insurance CoverageRemains a Challenge for State Programs. GAO-10-568R.Garner, T.R., Weinstein, J.E., & Sanger, D.M. (2009). Polycyclic aromatic hydrocarbon contaminationin South Carolina salt marsh-tidal creek systems: Relationships among sediments, biota,<strong>and</strong> watershed l<strong>and</strong> use. Archives of Environmental Contamination <strong>and</strong> Toxicology, 57(1), pp.103-115.Gaylord, B., Hill, R.M., Sanford, E., Lenz, E.A., Jacobs, L.A., Sato, K.N., Russell, A.D., &Hettinger, A. (2011). Functional impacts of ocean acidification in an ecologically critical foundationspecies. Journal of Experimental Biology, 214, pp. 2586-2594. doi: 10.1242/jeb.055939.GCCI (Global <strong>Climate</strong> Change <strong>Impacts</strong> in the United States). (2009). Thomas R. Karl, Jerry M.Melillo, <strong>and</strong> Thomas C. Peterson, (eds.). Cambridge University Press.Gehrels, W.R. (2010). Sea level change since the Last Glacial Maximum: An appraisal of the IPCCFourth Assessment Report. Journal Quaternary Science, 25 (1), pp. 26-38.Gemmrich, J., Thomas, B., & Bouchard, R. (2011). Observational changes <strong>and</strong> trends in northeastPacific wave records. Geophysical Research Letters, 38, L22601. doi:10.1029/2011GL049518.Geneva Association, The. (2009). The insurance industry <strong>and</strong> climate change – contribution to theglobal debate. The Geneva Reports: Risk <strong>and</strong> Insurance Research, pp. 152. Retrieved fromhttp://www.genevaassociation.org/PDF/Geneva_Reports/Geneva_report%5B2%5D.pdfGeng, Q. & Sugi, M. (2003). Possible change of extratropical cyclone activity due to enhancedgreenhouse gases <strong>and</strong> sulfate aerosols—study with a high-resolution AGCM. Journal of<strong>Climate</strong>, 16, pp. 2262-2274.Gesch, D.B. (2009). Analysis of Lidar Elevation Data for Improved Identification <strong>and</strong> Delineationof L<strong>and</strong>s Vulnerable to Sea-Level Rise. Journal of <strong>Coastal</strong> Research, 53, pp. 49-58.Gesch, D.B., Gutierrez, B.T., & Gill S.K. (2009). <strong>Coastal</strong> elevations. In: Titus, J.G. (Ed.) <strong>Coastal</strong>sensitivity to sea-level rise: a focus on the Mid-Atlantic Region. A report by the U.S. climatechange science program <strong>and</strong> the subcommittee on global change research, U.S. EnvironmentalProtection Agency, Washington, pp. 25-42.
156 <strong>Coastal</strong> <strong>Impacts</strong>, <strong>Adaptation</strong>, <strong>and</strong> <strong>Vulnerabilities</strong>Gillett, N.P., Stott, P.A. & Santer, B.D. (2008). Attribution of cyclogenesis region sea surfacetemperature change to anthropogenic influence. Geophysical Research Letters, 35, L09707.Giorgi, F., Im, E.S., Coppola, E., Diffenbaugh, N.S., Gao, X.J., Mariotti, L., & Shi, Y. (2011). HigherHydroclimatic Intensity with Global Warming. Journal of <strong>Climate</strong>, 24(20), pp. 5309-5324.Girvetz, E.H., Zganjar, C., Raber, G.T., Maurer, E.P., Kareiva, P., et al. (2009). Applied <strong>Climate</strong>change Analysis: The <strong>Climate</strong> Wizard Tool. PLoS ONE 4(12): e8320. doi:10.1371/journal.pone.0008320Glick, P., Hoffman, J., Koslow, M., Kate, A., & Inkley, D. (2011). Restoring the Great Lakes’<strong>Coastal</strong> Future: Technical Guidance for the Design <strong>and</strong> Implementation of <strong>Climate</strong>-SmartRestoration Projects. National Wildlife Federation, Ann Arbor, MI.Glick, P., Stein, B.A., & Edelson, N.A. (Eds.). (2011). Scanning the Conservation Horizon: A Guideto <strong>Climate</strong> Change Vulnerability Assessment. National Wildlife Federation, Washington, D.C.Goldstein, T., Zabka, T. DeLong, R.L., Wheeler, E.A., Ylitalo, G., Bargu, S., Silver, M., Leighfield,T., Van Dolah, F., Langlois, G., Sidor, I., Dunn, J.L., & Gull<strong>and</strong>, F.M.D. (2009). The role ofdomoic acid in abortion <strong>and</strong> premature parturition of California sea lions (Zalophus californianus)on San Miguel Isl<strong>and</strong>, California. Journal of Wildlife Diseases, 45(1), pp. 91-108.Gopalakrishnan, S., Smith, M.D., Slott, J.M., & Murray, A.B. (2011). The value of disappearingbeaches: A hedonic price model with endogenous beach width. Journal of EnvironmentEconomics <strong>and</strong> Management, 61(3), pp. 297-310.Gornitz, V. (1991). Global coastal hazards from future sea level rise. Palaeogeography, Palaeoclimatology,Palaeoecology, 89, pp. 379-398.Gornitz, V., & Lebedeff, S. (1987). Global sea-level changes during the past century. In:Nummedal, O.H. Pilkey, <strong>and</strong> J.D. Howard (Eds.), Sea-Level Fluctuation <strong>and</strong> <strong>Coastal</strong> Evolution,Society of Economic Paleontologists <strong>and</strong> Mineralogists, Special Publication 41, pp. 3-16.Gornitz, V.M. (1990). Vulnerability of the east coast, USA to future sea-level rise. Journal of <strong>Coastal</strong>Research, Special issue 9, pp. 201-237.Graham, N. E. & Diaz, H.F. (2001). Evidence for intensification of North Pacific winter cyclonessince 1948. Bulletin of American Meteorological Society, 82, pp. 1869-1893.Grannis, J. (2011, October). Georgetown <strong>Climate</strong> Center, <strong>Adaptation</strong> Tool Kit: Sea-Level Rise<strong>and</strong> <strong>Coastal</strong> L<strong>and</strong> Use. Retrieved from http://www.georgetownclimate.org/resources/adaptation-tool-kit-sea-level-rise-<strong>and</strong>-coastal-l<strong>and</strong>-use.Gray, S. (2011). From Uncertainty to Action: <strong>Climate</strong> Change Projections <strong>and</strong> the Management ofLarge Natural Areas. BioScience, 61(7), pp. 504-505.Green, A., Smith, S.E., Lipsett-Moore, G., Groves, C., Peterson, N., et al. (2009). Designing a resilientnetwork of marine protected areas for Kimbe Bay, Papua New Guinea. Oryx, 43, pp.488–98Green, K. (2011). Managing Flood Risk. Environmental Trends. Retrieved from http://www.aei.org/files/2011/07/28/EnvironTrendsIssueBriefJuly.pdfGregg, R. M., Hansen, L.J., Feifel, K.M., Hitt, J.L., Kershner, J.M., Score, A., & Hoffman, J.R. (2011).The State of Marine <strong>and</strong> <strong>Coastal</strong> <strong>Adaptation</strong> in North America: A Synthesis of EmergingIdeas. EcoAdapt, Banbridge Isl<strong>and</strong>, WA. 145 pp.Gregg, R.M. (2010). Alligator River National Wildlife Refuge/Albemarle-Pamlico Peninsula <strong>Climate</strong> <strong>Adaptation</strong>Project [Case study on a project of The Nature Conservancy - Nags Head Woods <strong>and</strong> theU.S. Fish <strong>and</strong> Wildlife Service - North Carolina]. Product of EcoAdapt’s State of <strong>Adaptation</strong>Program. Retrieved from http://www.cakex.org/case-studies/682 (Last updated August 2011).Grinsted, A., Moore, J.C., & Jevrejeva, S. (2009). Reconstructing sea level from paleo <strong>and</strong>projected temperatures 200 to 2100AD, <strong>Climate</strong> Dynamics, doi:10.1007/s00382-008-0507-2.
References 157Groffman, P.M., Baron, J., Blett, T., Gold, A.J., Goodman, I., Gunderson, L.H., Levinson, B.M.,Palmer, M.A., Paerl, H.W., Peterson, G.D., Poff, N.L., Rejeski, D.W., Reynolds, J.F., Turner,M.G., Weathers, K.C. <strong>and</strong> Wiens, J. (2006). Ecological thresholds: The key to successful environmentalmanagement or an important concept with no practical application? Ecosystems, 9,pp. 1-13.Groisman, P.Y., & Knight, R.W. (2008). Prolonged dry episodes over the conterminous UnitedStates: New tendencies emerging during the last 40 years. Journal of <strong>Climate</strong>, 21(9), pp.1850-1862.Groisman, P.Y., Knight, R.W., Karl, T.R., Easterling, D.R., Sun, B., & Lawrimore, J. (2004).Contemporary changes of the hydrological cycle over the contiguous United States: TrendsDerived from In Situ Observations. Journal of Hydrometeorology, 5(1), pp. 64–85.Gulev, S.K. & Grigorieva,V. (2006). Variability of the winter wind waves <strong>and</strong> swell in the NorthAtlantic <strong>and</strong> North Pacific as revealed by the voluntary observing ship data, Journal of<strong>Climate</strong>, 19, pp. 5667-5685.Gulf of Mexico Alliance. (2009). Technical Framework for the Gulf Regional Sediment ManagementMaster Plan. Habitat Restoration <strong>and</strong> Conservation Team, Biloxi MS.Gutierrez, B.T., Plant, N.G., & Thieler, E.R. (2011). A Bayesian network to predict coastal vulnerabilityto sea level rise. Journal of Geophysical Research, 116, F02009.Gutierrez, B.T., Williams, S.J., & Thieler, E.R. (2009). Ocean coasts. In, <strong>Coastal</strong> Sensitivity toSea-Level Rise: A Focus on the Mid-Atlantic Region. A report by the U.S. <strong>Climate</strong> ChangeScience Program <strong>and</strong> the Subcommittee on Global Change Research. J.G. Titus (coordinatinglead author), K.E. Anderson, D.R. Cahoon, D.B. Gesch, S.K. Gill, B.T. Gutierrez, E.R. Thieler,<strong>and</strong> S.J. Williams (lead authors). U.S. Environmental Protection Agency, Washington DC, pp.43-56.Gutowski, W.J., Hegerl, G.C., Holl<strong>and</strong>, G.J., Knutson, T.R., Mearns, L.O., Stouffer, R.J., Webster,P.J., Wehner, M.F., & Zwiers, F.W. (2008). Causes of observed changes in extremes <strong>and</strong>projections of future changes. In: Weather <strong>and</strong> <strong>Climate</strong> Extremes in a Changing <strong>Climate</strong>: Regionsof Focus: North America, Hawaii, Caribbean, <strong>and</strong> U.S. Pacific Isl<strong>and</strong>s [Karl, T.R., G.A. Meehl, C.D.Miller, S.J. Hassol, A.M. Waple, <strong>and</strong> W.L. Murray (Eds.)]. Synthesis <strong>and</strong> Assessment Product3.3. U.S. <strong>Climate</strong> Change Science Program, Washington, DC, pp. 81-116.H. John Heinz Center for Science, Economics <strong>and</strong> the Environment. 2000. Evaluation of ErosionHazards. Washington, DC: The Heinz Center.Haas, K.A., French, S.P., Smith, B.T., & Neary, V. (2011, June 29). Assessment of Energy ProductionPotential from Tidal Streams in the United States, Final Project Report to the Wind& Water Power Program, Office of Energy Efficiency <strong>and</strong> Renewable Energy of the U.S.Department of Energy under Contract No. DE- FG36-08GO18174.Hagemann, M., Hendel-Blackford, S., Hohne, N., Harvey, B., Naess, L.O., & Urban, F. (2011).Guiding climate compatible development: User-orientated analysis of planning tools <strong>and</strong>methodologies. Report produced by Ecofys <strong>and</strong> Institute of Development Studies for the<strong>Climate</strong> <strong>and</strong> Development Knowledge Network.Hallegraeff, G.M. (2010). Ocean climate change, phytoplankton community responses, <strong>and</strong>harmful algal blooms: a formidable predictive challenge. Journal of Phycology, 46, pp. 220-235,doi:210.1111/j.1529-8817.2010.00815.x.Hamlington, B.D., Leben, R.R., Nerem, R.S., Han, W. & Kim, K.-Y. (2011). Reconstructing sealevel using cyclostationary empirical orthogonal functions, Journal of Geophysical Research, V.116, C12015, doi:10.1029/2011JC007529, 17p.Hampton, M.A. & Griggs, G.B. (Eds.). (2004). Formation, Evolution, <strong>and</strong> Stability of <strong>Coastal</strong> Cliffs
158 <strong>Coastal</strong> <strong>Impacts</strong>, <strong>Adaptation</strong>, <strong>and</strong> <strong>Vulnerabilities</strong>— Status <strong>and</strong> Trends. The U.S. <strong>Climate</strong> Change Science Program References 282 GeologicalSurvey professional paper 1693. U.S. Geological Survey, Reston, VA, 123 pp.Hanks, D.M. & Secor, D.H. (2011). Bioenergetic responses of Chesapeake Bay white perch(Morone americana) to nursery conditions of temperature, dissolved oxygen, <strong>and</strong> salinity.Marine Biology, 158(4), pp. 805-815.Hansen, J., Sato, M., Kharecha, P., Russell, G., Lea, D.W., & Siddall, M. (2007). <strong>Climate</strong> change<strong>and</strong> trace gases. Philosophical Transactions of the Royal Society, 365, pp. 1925-1954.Hansen, L.J. & Hoffman, J. (2010). <strong>Climate</strong> Savvy: Adapting Conservation <strong>and</strong> Resource Managementto a Changing World. Isl<strong>and</strong> Press, Washington D.C.Hanson, S., Nicholls, R., Ranger, N., Hallegatte, S., Corfee-Morlot, J., Herweijer, C., & Chateau,J. (2011). A global ranking of port cities with high exposure to climate extremes. ClimaticChange, 104, pp. 89-111.Hapke, C., Plant, N. (2010). Predicting coastal cliff erosion using a Bayesian probabilistic model.Marine Geology, 278, pp. 140-149.Hare, J.A., Able, K.W. (2007). Mechanistic links between climate <strong>and</strong> fisheries along the east coastof the United States: explaining population outbursts of Atlantic croaker (Micropogoniasundulates) Fisheries Oceanography, 16, pp. 31-45Harley, C.D.G. (2011). <strong>Climate</strong> change, keystone predation, <strong>and</strong> biodiversity loss. Science, 334: pp.1124-1127, DOI:10.1126/science.1210199Harley, C.D.G., Hughes, A.R., Hultgren, K.M., Miner, B.G., Sorte, C. J.B., Thornber, C.S., Rodriguez,L.F., Tomanek, L. & Williams, S.L. (2006). The impacts of climate change in coastalmarine systems. Ecology Letters, 9, pp. 228–241.Harrington J. & Walton, T.L. (2007). <strong>Climate</strong> change in coastal areas in Florida: Sea level riseestimation <strong>and</strong> economic analysis to year 2080. Florida State University, Tallahassee, FL.Retrieved from http://www.cefa.fsu.edu/content/download/47234/327898.Hartmann, B. & Wendler, G. (2005). The significance of the 1976 Pacific climate shift on the climatologyof Alaska. Journal of <strong>Climate</strong>, 18, pp. 4824-4839.Harvey, N., Woodroffe, C. (2008). Australian approaches to coastal vulnerability assessment.Sustainability Science, 3, pp. 67-87.Hatfield, J., Boote, K., Fay, P., Hahn, L., Izaurralde, C., Kimball, B. A., Mader, T., Morgan, J.,Ort, D., Polley, W., Thomson, A., & Wolfe, D. (2008). Agriculture. In: The Effects of <strong>Climate</strong>Change on Agriculture, L<strong>and</strong> Resources, Water Resources, <strong>and</strong> Biodiversity in the UnitedStates. (P. Backlund, A. Janetos, D. Schimel, J. Hatfield, K. Boote, P. Fay, L. Hahn, C.Izaurralde, B. A. Kimball, T. Mader, J. Morgan, D. Ort, et al., (Eds.)). Synthesis <strong>and</strong> AssessmentProduct 4.3, pp. 21-74. U.S. Department of Agriculture, Washington, DC.Hawkins, S.J., Moore, P.J., Burrows, M.T., Poloczanska, E., Mieszkowska, N., Herbert, R.J.H.,Jenkins, S.R., Thompson, R.C., Gennar, M.J., & Southward, A.J. (2008). Complex interactionsin a rapidly changing world: responses of rocky shore communities to recent climate change.<strong>Climate</strong> Research, 37, pp. 123-133 [doi:10.3354/cr00768]Hayhoe, K., VanDorn, J., Croley, T., Schlegal, N., <strong>and</strong> Wuebbles, D., 2010, Regional climatechange projections for Chicago <strong>and</strong> the US Great Lakes. Journal of Great Lakes Research, v. 36,no. Supplemental 2, pp. 7-21Hayhoe, K., Wake, C.P., Huntington, T.G., Luo, L., Schwartz, M.D., Sheffield, J., Wood, E.F.,Anderson, B., Bradbury, J., DeGaetano, A., Troy, T., & Wolfe, D., 2006. Past <strong>and</strong> futurechanges in climate <strong>and</strong> hydrological indicators in the U.S. Northeast. <strong>Climate</strong> Dynamics, 28,pp. 381–407.Heberger, M., Cooley, H., Herrera, P., Gleick, P., & Moore, E. (2009, May). The <strong>Impacts</strong> of
References 159Sea-level Rise on the California Coast, paper from California <strong>Climate</strong> Change Center,prepared by Pacific Institute, Oakl<strong>and</strong> CA, CEC-500-2009-024-F.Held, I. M., & Soden, B. J. (2006). Robust responses of the hydrological cycle to global warming.Journal of Climatology, 19, pp. 5686-5699.Held, I.M., & Soden, B.J. (2000). Water vapor feedback <strong>and</strong> global warming. Annual Review ofEnergy <strong>and</strong> the Environment, 25(1), pp. 441-475.Hemer, M.A., Wang, X.L., Church, J.A. & Swail, V.R. (2010). Coordinating global ocean waveclimate projections. Bulletin of the American Meterological Society, April, 451-454.Hines, A.H., Johnson, E.G., Darnell, M.Z., Rittschof, D., Miller, T.J., Bauer, L.J., Rodgers, P.,& Aguilar, R. (2010). Predicting Effects of <strong>Climate</strong> Change on Blue Crabs in ChesapeakeBay. In: G.H. Kruse, G.L. Eckert, R.J. Foy, R.N. Lipcius, B. Sainte-Marie, D.L. Stram, <strong>and</strong> D.Woodby (Eds.), Biology <strong>and</strong> Management of Exploited Crab Populations under <strong>Climate</strong>Change. Alaska Sea Grant, University of Alaska Fairbanks, pp. 109-127.Hinkel, J. (2011). Indicators of vulnerability <strong>and</strong> adaptive capacity: Towards a clarification of thescience–policy interface. Global Environmental Change, 21, pp. 198-208.Hittle, J. (2011). Integrated Planning for Resilient Communities: A Technical Guide to IntegratingHazard, Ecosystem <strong>and</strong> L<strong>and</strong> Use Planning. Retrieved from http://resilient-communities.org/files/Integrated_Planning_for_Resilient_Communities_2-7-11.pdf.Hodgkins, G.A., Dudley, R.W., & Aichele, S.S. (2007). Historical changes in precipitation <strong>and</strong>streamflow in the U.S. Great Lakes Basin, 1915–2004: U.S. Geological Survey Scientific InvestigationsReport 2007–5118, 31 pp. Retrieved from http://pubs.usgs.gov/sir/2007/5118/Hoegh-Guldberg, O., Mumby, P.J., Hooten, A.J., Steneck, R.S., Greenfield, P., Gomez, E., Harvell,C.D., Sale, P.F., Edwards, A.J., Caldeira, K., Knowlton, N., Eakin, C.M., Iglesias-Prieto, R.,Muthiga, N., Bradbury, R.H., Dubi, A., & Hatziolos, M.E. (2007). Coral Reefs Under Rapid<strong>Climate</strong> Change <strong>and</strong> Ocean Acidification. Science 318, pp. 1737-1742.Hoffman, R. N., Dailey, P., Hopsch, S., Ponte, R.M., Quinn, K., Hill, E.M., & Zachry, B. (2010). Anestimate of increases in storm surge risk to property from sea level rise in the first half of thetwenty-first century. Weather, <strong>Climate</strong>, <strong>and</strong> Society, 2, pp. 271-293.Holgate, S.J. & Woodworth, P.L. (2004). Evidence for enhanced coastal SLR during the 1990s.Geophysical Research Letters, 31, L07305, doi:10.1029/2004GL019626.Hom, T., Collier, T.K., Krahn, M.M., Strom, M.S., Ylitalo, G.M., Paranjpye, R.N., Nilsson, W.B.,& Varanasi, U. (2008). Assessing seafood safety in the aftermath of Hurricane Katrina. Mitigating<strong>Impacts</strong> of Natural Hazards on Fishery Ecosystems. American Fisheries Society Symposium,64, pp. 73-93.Horton, R., Gornitz, V., Bowman, M. & Blake, R. (2010). Chapter 3: <strong>Climate</strong> observations <strong>and</strong>projections. Annals of the New York Academy of Sciences, 1196, pp. 41–62.Horton, R., Herweijer, C., Rosenzweig, C., Liu, J.P., Gornitz, V., & Ruane, A.C. (2008). Sealevel rise projections for current generation CGCMs based on the semi-empirical method.Geophysical Research Letters, 35, L02715, doi:10.1029/2007GL032486.Horton, R.M., Gornitz, V., Bader, D.A., Ruane, A.C., Goldberg, R., & Rosenzweig, C. (2011).<strong>Climate</strong> hazard assessment for stakeholder adaptation planning In New York City. Journal ofApplied Meteorology <strong>and</strong> Climatology, in press, doi:10.1175/2011JAMC2521.1.Houston, J. R., & Dean, R.G. (2011). Sea-level acceleration based on U.S. tide gauges <strong>and</strong> extensionsof previous global-gauge analyses. Journal of <strong>Coastal</strong> Research, 27, pp. 409-417.Howarth, R., Swaney, D., Billen, G., Garnier, J., Hong, B., Humborg, C., Johnes, P., Mörth, C., &Marino, R. (2011). Nitrogen fluxes from the l<strong>and</strong>scape are controlled by net anthropogenicnitrogen inputs <strong>and</strong> by climate. Frontiers in Ecology <strong>and</strong> the Environment, doi:10.1890/100178.
160 <strong>Coastal</strong> <strong>Impacts</strong>, <strong>Adaptation</strong>, <strong>and</strong> <strong>Vulnerabilities</strong>Howarth, R.W. (2008). <strong>Coastal</strong> nitrogen pollution: A review of sources <strong>and</strong> trends globally <strong>and</strong>regionally. Harmful Algae, 8(1), pp. 14-20.Howarth, R.W., Swaney, D.P., Boyer, E.W., Marino, R., Jaworski, N., & Goodale, C. (2006). Theinfluence of climate on average nitrogen export from large watersheds in the NortheasternUnited States. Biogeochemistry, 79(1-2), pp. 163-186.http://pubs.usgs.gov/dds/dds68/http://unfccc.int/adaptation/nairobi_work_programme/knowledge_resources_<strong>and</strong>_publications/items/2674.phphttp://westcoastoceans.gov/teams/http://www.cakex.orghttp://www.csc.noaa.gov/digitalcoast/http://www.ebmtools.org/about_ebm_tools/getting_started.htmlhttp://www.ebmtoolsdatabase.org/http://www.ipcc.ch/publications_<strong>and</strong>_data/ar4/wg2/en/ch6.htmlhttp://www.ipcc-wg2.gov/SREX/images/uploads/SREX-SPM_Approved-HiRes_opt.pdfhttp://www.publicaffairs.noaa.gov/releases2003/sep03/noaa03r450.htmlHu, A., Meehl, G.A., Han, W., & Yin, J. (2009). Transient response of the MOC <strong>and</strong> climate topotential melting of the Greenl<strong>and</strong> Ice Sheet in the 21st century. Geophysical Research Letters,36, L10707. doi:10.1029/2009GL037998.Hu. A., Meehl, G.A., Han, W. & Yin, J. (2011). Effect of the potential melting of the Greenl<strong>and</strong> IceSheet on the Meridional Overturning Circulation <strong>and</strong> global climate in the future. Deep-SeaResearch II, doi:10.1016/j.dsr2.2010.10.069.Hughes, T.P., Baird, A.H., Bellwood, D.R., Card, M., Connolly, S.R., Folke, C., Grosberg, R.,Hoegh-Guldberg, O., Jackson, J.B.C., Kleypas, J., Lough, J.M., Mar-shall, P., Nystrom, M.,Palumbi, S.R., P<strong>and</strong>olfi, J.M., Rosen, B., & Roughgarden, J. (2003). <strong>Climate</strong> change, humanimpacts, <strong>and</strong> the resilience of coral reefs. Science, 301, pp. 929-933.Huntington, T. G. (2006). Evidence for intensification of the global water cycle: review <strong>and</strong>synthesis. Journal of Hydrology, 319, pp. 83-95.Huntington, T.G. (2010). <strong>Climate</strong> warming-induced intensification of the hydrologic cycle: Areview of the published record <strong>and</strong> assessment of the potential impacts on agricultureAdvances in Agronomy, 109, pp. 1-53.Huntington, T.G., Hodgkins, G.A., Keim, B.D., & Dudley, R.W. (2004). Changes in the proportionof precipitation occurring as snow in New Engl<strong>and</strong> (1949 to 2000). Journal of <strong>Climate</strong>, v. 17,no. 13, pp. 2626-2636Industrial Economics, Incorporated. (2011). Development <strong>and</strong> Implementation of the <strong>Climate</strong>Assessment <strong>and</strong> Proactive Response Initiative (CAPRI) For Puget Sound. Report preparedfor the National Oceanic <strong>and</strong> Atmospheric Administration Damage Assessment, Remediation,<strong>and</strong> Restoration Program. Seattle, WAInsurance Information Institute. (2012). Residual Markets. Retrieved from http://www.iii.org/media/hottopics/insurance/residual/.IPCC (Intergovernmental Panel on <strong>Climate</strong> Change), (2001). <strong>Climate</strong> Change 2001: The ScientificBasis. Contribution of Working Group I to the Third Assessment Report of the IntergovernmentalPanel on <strong>Climate</strong> Change [Houghton, J.T., Y. Ding, D.J. Griggs, M. Noguer, P.J.van der Linden, X. Dai, K. Maskell, <strong>and</strong> C.A. Johnson (Eds.)]. Cambridge University Press,Cambridge, UK, <strong>and</strong> New York, 881 pp.IPCC (Intergovernmental Panel on <strong>Climate</strong> Change), (2007). <strong>Climate</strong> Change 2007: The PhysicalScience Basis. Contribution of Working Group I to the Fourth Assessment Report of the
References 161Intergovernmental Panel on <strong>Climate</strong> Change [Solomon, S., D. Qin, M. Manning, Z. Chen,M. Marquis, K.B. Averyt, M. Tignor, <strong>and</strong> H.L. Miller (Eds.)]. Cambridge University Press,Cambridge, UK <strong>and</strong> New York, 996 pp.IPCC (Intergovernmental Panel on <strong>Climate</strong> Change), (2011). Special Report on Managing the Risksof Extreme Events <strong>and</strong> Disasters to Advance <strong>Climate</strong> Change <strong>Adaptation</strong>: Summary for Policymakers[Field, C. B., Barros, V., Stocker, T.F., Qin, D., Dokken, D., Ebi, K.L., Mastr<strong>and</strong>rea, M.D., Mach, K. J., Plattner, G.-K., Allen, S., Tignor, M. <strong>and</strong> P. M. Midgley (Eds.)]. CambridgeUniversity Press, Cambridge, <strong>and</strong> New York.IPCC (Intergovernmental Panel on <strong>Climate</strong> Change). (2000). Special Report on Emissions Scenarios:A special report of Working Group III of the Intergovernmental Panel on <strong>Climate</strong> Change,[Nakićenović, N., <strong>and</strong> Swart, R. (Eds.)], Cambridge University Press, ISBN 0-521-80081-1.IPCC (Intergovernmental Panel on <strong>Climate</strong> Change). (2007). IPCC Fourth Assessment ReportAnnex 1: Glossary. In: <strong>Climate</strong> Change 2007: The Physical Science Basis. Contributionof Working Group I to the Fourth Assessment Report of the Intergovernmental Panel on<strong>Climate</strong> Change (Solomon, S., D. Qin, M. Manning, Z. Chen, M. Marquis, K. B. Averyt, M.Tignor, <strong>and</strong> H. L. Miller (Eds.)). Cambridge University Press, Cambridge, United Kingdom<strong>and</strong> New York, NY, USA.IPCC (Intergovernmental Panel on <strong>Climate</strong> Change). (2012). Managing the Risks of ExtremeEvents <strong>and</strong> Disasters to Advance <strong>Climate</strong> Change <strong>Adaptation</strong>. A Special Report of WorkingGroups I <strong>and</strong> II of the Intergovernmental Panel on <strong>Climate</strong> Change [Field, C.B., Barros, V.,Stocker, T.F., Qin, D., Dokken, D.J., Ebi, K.L., Mastr<strong>and</strong>rea, M.D., Mach, K.J., Plattner, G.-K.,Allen, S.K., Tignor, M., & Midgley, P.M. (Eds.)]. Cambridge University Press, Cambridge,UK, <strong>and</strong> New York, NY, USA, 582 pp.Irish, J. L., Resio, D. T., & Divoky, D. (2011). Statistical properties of hurricane surge along acoast. Journal of Geophysical Research-Oceans, 116, C10007.Irish, J.L. Resio, D.T. (2010). A hydrodynamics-based surge scale for hurricanes, Ocean Engineering,37(1), pp. 69-81.Irish, J.L., Resio, D.T., & Ratcliff, J.J. (2008). The influence of storm size on hurricane surge, Journalof Physical Oceanography, 38(9), pp. 2003-2013.Irish, J.L., Resio, D.T., Cialone, M.A. (2009). A surge response function approach to coastalhazard assessment: Part 2, Quantification of spatial attributes of response functions, Journalof Natural Hazards, 51(1), pp. 183-205.Iverson, L., Prasad, A., & Matthews, S. (2008). Potential changes in suitable habitat for 134 treespecies in the northeastern United States. Mitigation <strong>and</strong> <strong>Adaptation</strong> Strategies for GlobalChange, 13(5-6), pp. 487-516.Iverson, L., Prasad, A.M., Matthews, S., & Peters, M. (2011). Lessons learned while integratinghabitat, dispersal, disturbance, <strong>and</strong> life-history traits into species habitat models underclimate change. Ecosystems, 14, pp. 1005-1020.Iverson, L.R., Prasad, A.M., & Schwartz, M.W. (2005). Predicting potential changes in suitablehabitat <strong>and</strong> distribution by 2100 for tree species of the Eastern United States. Journal of AgriculturalMeteorology. 61(1), pp. 29–37.Jacob, K., Rosenzweig, C., Horton, R., Major, D., & Gornitz, V. (2008). MTA adaptations to climatechange. A categorical imperative. Metropolitan Transit Authority, New York, NY.Jacobs, S.S., Jenkins, A., Giulivi, C.F., & Dutrieux, P. (2011). Stronger ocean circulation <strong>and</strong>increased melting under Pine Isl<strong>and</strong> Glacier ice shelf. Nature Geoscience, 4, pp. 519-523.Janetos, A., Hansen, L., Inouye, D., Kelly, B.P., Meyerson, L., Peterson, B., & Shaw, R. (2008).Biodiversity. In: The Effects of <strong>Climate</strong> Change on Agriculture, L<strong>and</strong> Resources, Water Resources,
162 <strong>Coastal</strong> <strong>Impacts</strong>, <strong>Adaptation</strong>, <strong>and</strong> <strong>Vulnerabilities</strong><strong>and</strong> Biodiversity in the United States [Backlund, P., A. Janetos, D. Schimel, J. Hatfield, K.Boote, P. Fay, L. Hahn, C. Izaurralde, B.A.Kimball, T. Mader, J. Morgan, D. Ort, W. Polley,A. Thomson, D. Wolfe, M.G. Ryan, S.R. Archer, R. Birdsey, C. Dahm, L. Heath, J. Hicke, D.Hollinger, T. Huxman, G. Okin, R. Oren, J. R<strong>and</strong>erson, W. Schlesinger, D. Lettenmaier, D.Major, L. Poff, S. Running, L. Hansen, D. Inouye, B.P. Kelly, L. Meyerson, B. Peterson, <strong>and</strong> R.Shaw (Eds.)]. Synthesis <strong>and</strong> Assessment Product 4.3. U.S. Department of Agriculture, Washington,DC, pp. 151-181.Jevrejeva, S., Grinsted, A. & Moore, J.C. (2009). Anthropogenic forcing dominates sea level risesince 1850. Geophysical Research Letters, 36, L20706, 5 pp., doi:10.1029/2009GL040216.Jevrejeva, S., Grinsted, A. & Moore, J.C. (2009). Anthropogenic forcing dominates sea level risesince 1850. Geophysical Research Letters, 36.Jevrejeva, S., Moore, J.C., & Grinsted, A. (2010). How will sea level respond to changes in natural<strong>and</strong> anthropogenic forcings by AD 2100? Geophysical Research Letters, 37, L07703, 7 pp.Jevrejeva, S., Moore, J.C., & Grinsted, A. (2011). Sea level projections to AD2500 with a newgeneration of climate change scenarios. Global <strong>and</strong> Planetary Change, Available online 21September 2011, ISSN 0921-8181, 10.1016/j.gloplacha.2011.09.006.Jevrejeva, S., Moore, J.C., Grinsted, A., & Woodworth, P.L. (2008). Recent global sealevel acceleration started over 200 years ago? Geophysical Research Letters, 35, L08715,doi:10.1029/2008GL033611.Jiang, H. & Zipser, E. (2010). Contribution of Tropical Cyclones to the Global Precipitation fromEight Seasons of TRMM Data: Regional, Seasonal, <strong>and</strong> Interannual Variations. Journal of<strong>Climate</strong>, 23, pp. 1526–1543.Jochens, A.E., Malone, T.C., Stumpf, R.P., Hickey, B.M., Carter, M., Morrison, R., Dyble, J., Jones,B., & Trainer, V.L. (2010). Integrated ocean observing system in support of forecastingharmful algal blooms. Marine Technology Society Journal, 44(6).Johnson, C. N., Flowers, A.R., Noriea, N.F. III, Zimmerman, A.M., Bowers, J.C., DePaola, A., &Grimes, D.J. (2010). Relationships between Environmental Factors <strong>and</strong> Pathogenic Vibrios inthe Northern Gulf of Mexico. Applied <strong>and</strong> Environmental Microbiology, 76(21), pp. 7076-84.Johnson, N.C. & Xie, S.-P. (2010). Changes in the sea surface temperature threshold for tropicalconvection. Nature Geoscience, 3(12), pp. 842-845Johnson, T. & Kittle, J. (2007). Sensitivity analysis as a guide for assessing <strong>and</strong> managing theimpacts of climate change on water resources. Water Resources IMPACT, 8, pp. 17–19.Joint Legislative Committee on Performance Evaluation <strong>and</strong> Expenditure Review (PEER). (2006).The Impact of Hurricane Katrina on Mississippi’s Commercial Public Ports <strong>and</strong> Opportunitiesfor Expansion of the Ports. Mississippi Legislature, Jackson, MS.Jones, B.M., Arp, C.D., Beck, R.A., Grosse, G., Webster, J., & Urban, F.E. (2009b). Erosional historyof Cape Halkett <strong>and</strong> contemporary monitoring of bluff retreat, Beaufort Sea coast, Alaska.Polar Geography, 32, pp. 129-142.Jones, B.M., Arp, C.D., Jorgenson, M.T., Hinkel, K.M., Schmutz, J.A., & Flint, P.L. (2009a).Increase in the rate <strong>and</strong> uniformity of coastline erosion in Arctic Alaska. Geophysical ResearchLetters, 36, L03503, doi: 10.1029/2008GL036205.Joughlin, I. & Alley, R.B. (2011). Stability of the West Antarctic ice sheet in a warming world.Nature Geoscience, 4, pp. 506–513Joughlin, I. & Alley, R.B. (2011). Stability of the West Antarctic ice sheet in a warming world.Nature Geoscience, 4, pp. 506–513.Julius, S. & West, J. (Eds.). (2008). Preliminary Review of <strong>Adaptation</strong> Options for <strong>Climate</strong>-SensitiveEcosystems: Final Report, Synthesis <strong>and</strong> Assessment Product 4.4. U.S. <strong>Climate</strong> Change
References 163Science Program <strong>and</strong> Subcommittee on Global Change Research., Washington, DC. 544 pp.Justic, D., Bierman, V.J., Scavia, D., & Hetl<strong>and</strong>, R.D. (2007). Forecasting Gulf’s hypoxia: the next50 years? Estuaries <strong>and</strong> Coasts, 30, pp. 791-801.Justic, D., Rabalais, N.N., & Turner, R.E. (1996). Effects of climate change on hypoxia in coastalwaters: a doubled CO 2scenario for the northern Gulf of Mexico. Limnology <strong>and</strong> Oceanography,41, pp. 992-1003.Kane, A. (2011). Practical Guidance for <strong>Climate</strong>-Smart Conservation Projects in the Northeast:Case Examples for <strong>Coastal</strong> Impoundments <strong>and</strong> Living Shorelines. National Wildlife Federation,Washington, D.C. 45 pp.Karl, T., Melillo, J.M., & Peterson, T.C. (Eds.). (2009). Global <strong>Climate</strong> Change <strong>Impacts</strong> in theUnited States. Cambridge University Press.Karoly, D.J. & Wu, Q.G. (2005). Detection of regional surface temperature trends. Journal of<strong>Climate</strong>, 18, pp. 4337-4343.Kaushal, S.S., Groffman, P.M., B<strong>and</strong>, L.E., Shields, C.A., Morgan, R.P., Palmer, M.A., Belt, K.T.,Swan, C.M., Findlay, S.E.G., & Fisher, G.T. (2008). Interaction between urbanization <strong>and</strong>climate variability amplifies watershed nitrate export in Maryl<strong>and</strong>. Environmental Science &Technology, 42(16), pp. 5872–5878.Kemp, W.M., Testa, J.M., Conley, D.J., Gilbert, D., & Hagy, J.D. (2009). Temporal responses ofcoastal hypoxia to nutrient loading <strong>and</strong> physical controls. Biogeosciences. 6(12), pp. 2985-3008.Kennish M., Paerl, H.W. (2010). <strong>Coastal</strong> Lagoons: Critical Habitats of Environmental Change.CRC Marine Science Series, CRC Press, Boca Raton, FL.Kildow, J.T., Colgan, C.S., & Scorse, J. (2009). State of the U.S. Ocean <strong>and</strong> <strong>Coastal</strong> Economies.National Ocean Economics Program. Retrieved from http://www.oceaneconomics.org/nationalreport.Kim, Y., Ueyama, M., Nakagawa, F., Tsunogai, U., Harazono, Y., & Tanaka, N. (2007). Assessmentof winter fluxes of CO 2, <strong>and</strong> CH 4in boreal forest soils of central Alaska estimated bythe profile method <strong>and</strong> the chamber method: a diagnosis of CH 4emission <strong>and</strong> implicationsfor the regional carbon budget, DOI: 10.1111/j:1600-0889.2006.00233.x, Tellus B, 59(2), pp.223-243.Kimmel, D.G., Miller, W.D., & Roman, M.R. (2006). Regional scale climate forcing of mesozooplanktondynamics in Chesapeake Bay. Estuaries <strong>and</strong> Coasts, 29, pp. 375-387King County. (2008). Vulnerability of major wastewater facilities to flooding from sea-levelrise. Department of Natural Resources <strong>and</strong> Parks, King County, WA. Also see Feifel, K.(2010). Vulnerability of King County, Washington Wastewater Treatment Facilities to Sea LevelRise [Case study on a project of the King County Wastewater Treatment Division]. Productof EcoAdapt’s State of <strong>Adaptation</strong> Program. Retrieved from CAKE: http://www.cakex.org/case-studies/719.King, P.G., McGregor, A.R., Whittet, J.D. (2008). The Economic Costs of Sea Level Rise to CaliforniaBeach Commities. California Department of Boating <strong>and</strong> Waterways <strong>and</strong> San FranciscoState University.Kirshen, P., Douglas, E., Paolisso, M., <strong>and</strong> Enrici, A. (2012). Community Attitudes to <strong>Adaptation</strong>to <strong>Coastal</strong> Flooding under <strong>Climate</strong> Change in Karl et al, Restoring <strong>and</strong> Sustaining L<strong>and</strong>s:Coordinating Science, Politics, <strong>and</strong> Action, Springer, in press.Kirshen, P., Watson, C., Douglas, E., Gontz, A., Lee, J., <strong>and</strong> Tian, Y. (2008). <strong>Coastal</strong> flooding inthe Northeastern United States due to climate change. Mitigation <strong>and</strong> <strong>Adaptation</strong> Strategies forGlobal Change, 13(5-6), pp. 437-451.Kirwan, M., Murray, A., Boyd, W. (2008). Temporary vegetation disturbance as an
164 <strong>Coastal</strong> <strong>Impacts</strong>, <strong>Adaptation</strong>, <strong>and</strong> <strong>Vulnerabilities</strong>explanation for permanent loss of tidal wetl<strong>and</strong>s. Geophysical Research Letters, 35, L05403.doi:10.1029/2007GL032681.Kirwan, M.L., Guntenspergen, G.R., D’Alpaos, A., Morris, J.T., Mudd, S.M., <strong>and</strong> Temmerman, S.(2010). Limits on the adaptability of coastal marshes to rising sea level. Geophysical ResearchLetters, 37, L23401, doi:10.1029/2010GL045489.Kjerfve, B. (Ed.). (1994). <strong>Coastal</strong> lagoon processes. Elsevier, Amsterdam, The Netherl<strong>and</strong>s.Kleinosky, L.R., Yarnal, B., & Fisher, A. (2007). Vulnerability of Hampton Roads, Virginia tostorm-surge flooding <strong>and</strong> sea-level rise. Natural Hazards, 40(1), pp. 43-70.Kling, G.W., Hayhoe, K., Johnson, L.B., Magnuson, J.J., Polasky, S., Robinson, S.K., Shuter, B.J.,W<strong>and</strong>er, M.M., Wuebbles, D.J., Zak, D.R., Lindroth, R.L., Moser, S.C., & Wilson, M.L. (2003).Confronting <strong>Climate</strong> Change in the Great Lakes Region: <strong>Impacts</strong> on our Communities <strong>and</strong> Ecosystems.Union of Concerned Scientists, Cambridge, Massachusetts, <strong>and</strong> Ecological Society ofAmerica, Washington, D.C.Knowles, N. (2010). Potential Inundation Due to Rising Sea Levels in the San Francisco BayRegion. San Francisco Estuary <strong>and</strong> Watershed Science, 8, pp. 1-19.Knowles, N., Dettinger, M.D., & Cayan, D.R., 2006, Trends in snowfall versus rainfall for theWestern United States. Journal of <strong>Climate</strong>, 19(18), pp. 4545-4559.Knowlton, K., Lynn, B., Goldberg, R.A., Rosenzweig, C., Hogrefe, C., Rosenthal, J.K., Kinney, P.L.(2007). Projecting heat-related mortality impacts under a changing climate in the New YorkCity region. American Journal of Public Health, 97, pp. 2028-2034.Knowlton, K., Rotkin-Ellman, M., King, G., Margolis, H.G, Smith, D., Solomon, G., Trent, R., &English, P. (2009). The 2006 California Heat Wave: <strong>Impacts</strong> on Hospitalizations <strong>and</strong> EmergencyDepartment Visits. Environmental Health Perspectives, 117, pp. 61-67. http://dx.doi.org/10.1289/ehp.11594Knowlton, K., Solomon, G., Rotkin-Ellman, M. (2009). Fever Pitch: Mosquito-Borne Dengue FeverThreat Spreading in the Americas. Natural Resources Defense Council. Retrieved from http://www.nrdc.org/health/dengueKnutson, T.R., Delworth, T.L., Dixon, K.W., Held, I.M., Lu, J., Ramaswamy, V., Schwarzkopf,M.D., Stenchikov, G., & Stouffer, R.J. (2006). Assessment of Twentieth-Century regionalsurface temperature trends using the GFDL CM2 coupled models. Journal of <strong>Climate</strong>, 19(9),doi:10.1175/JCLI3709.1.Knutson, T.R., McBride, J., Chan, J., Emanuel, K.A., Holl<strong>and</strong>, G., L<strong>and</strong>sea, C., Held, I.M., Kossin,J., Srivastava, A.K., & Sugi, M. (2010). Tropical cyclones <strong>and</strong> climate change. Nature Geoscience,3, doi:doi:10.1038/ngeo779.Knutson, T.R., Sirutis, J.J., Garner, S.T., Vecchi, G.A., & Held, I.M. (2008). Simulated reduction inAtlantic hurricane frequency under twenty-first-century warming conditions. Nature Geoscience,1(6), pp. 359-364.Komar, P.D. & Allan, J.C. (2008). Increasing hurricane-generated wave heights along the US EastCoast <strong>and</strong> their climate controls. Journal of <strong>Coastal</strong> Research, 24(2), pp. 479-488.Komar, P.D. (1998). Beach processes <strong>and</strong> sedimentation, Second edition, Prentice Hall, Saddle River,N.J., 544 pp.Komar, P.D., Allan, J.C., & Ruggiero, P. (2009). Ocean wave climates: Trends <strong>and</strong> variations dueto Earth’s changing climate. H<strong>and</strong>book of <strong>Coastal</strong> <strong>and</strong> Ocean Engineering, edited by Y.C.Kim, World Scientific Publishing Co., pp. 971-975.Kopp, R.E., Mitrovica, J.X., Griffies, S.M., Yin, J., Hay, C.C., & Stouffer, R.J. (2010). The impact ofGreenl<strong>and</strong> melt on local sea levels: a partially coupled analysis of dynamic <strong>and</strong> static equilibriumeffects in idealized water-hosing experiments. Climatic Change, 103, pp. 619-625
References 165Kopp, R.E., Mitrovica, J.X., Griffies, Y.J., Hay, C.C., & Stouffer, R.J. (2010). The impact of Greenl<strong>and</strong>melt on local sea levels: a partially coupled analysis of dynamic <strong>and</strong> static equilibriumeffects in idealized water-hosing experiments. Climatic Change, 103, pp.619-625.Kopp, R.E., Simons, F.J., Mitrovica, J.X., Maloof, A.C., & Oppenheimer, M. (2009). Probabilisticassessment of sea level during the last interglacial stage. Nature 462, pp. 863-867, doi:10.1038/nature08686.Kossin, J.P. & Camargo, S.J. (2009). Hurricane track variability <strong>and</strong> secular potential intensitytrends. Climatic Change, 97, pp. 329-337.Kossin, J.P., Camargo, S.J., & Sitkowski, M. (2010). <strong>Climate</strong> Modulation of North Atlantic HurricaneTracks. Journal of <strong>Climate</strong>, 23(11), pp. 3057-3076.Krauss, K.W., Duberstein, J.A., Doyle, T.W., Conner, W.H., Day, R.H., Inabinette, I.W. & Whitbeck,J.L. (2009). Site condition, structure, <strong>and</strong> growth of bald cypress along tidal/non-tidalsalinity gradients: Wetl<strong>and</strong>s 29 (2), pp. 505-519. Retrieved from http://www.bioone.org/doi/abs/10.1672/08-77.1Krauss, K.W., From, A.S., Doyle, T.W., Doyle, T.J. & Barry, M.J. (2011). Sea-level rise <strong>and</strong> l<strong>and</strong>scapechange influence mangrove encroachment onto marsh in the Ten Thous<strong>and</strong> Isl<strong>and</strong>sregion of Florida, USA. Journal of <strong>Coastal</strong> Conservation, 15, pp. 629-638. DOI 10.1007/s11852-011-0153-4.Kreeger, D., Adkins, J., Cole, P., Najjar, R., Velinsky, D., Conolly, P., & Kraeuter, J. (2010). <strong>Climate</strong>change <strong>and</strong> the Delaware Estuary: three case studies in vulnerability assessment <strong>and</strong> adaptationplanning. Partnership for the Delaware Estuary, PDE Report No. 10-01. 1–117 pp.Kundzewicz, Z.W., Mata, L.J., Arnell, N.W., Döll, P., Jimenez, B., Miller, K., Oki, T., Şen Z.,& Shiklomanov, I. (2008). The implications of projected climate change for freshwaterresources <strong>and</strong> their management. Hydrological Sciences Journal, 53(1), pp. 3-10.Kundzewicz, Z.W., Mata, L.J., Arnell, N.W., Döll, P., Kabat, P., Jiménez, B., Miller, K.A., Oki, T.,Sen, Z., & Shiklomanov, I.A. (2007). Freshwater resources <strong>and</strong> their management. <strong>Climate</strong>Change 2007: <strong>Impacts</strong>, <strong>Adaptation</strong> <strong>and</strong> Vulnerability. Contribution of Working Group IIto the Fourth Assessment Report of the Intergovernmental Panel on <strong>Climate</strong> Change, M.L.Parry, O.F. Canziani, J.P. Palutikof, P.J. van der Linden <strong>and</strong> C.E. Hanson (Eds.). CambridgeUniversity Press, Cambridge, UK, pp. 173-210.Kunkel, K.E., Bromirski, P.D., Brooks, H.E., Cavazos, T., Douglas, A.V., Easterling, D.R.,Emanuel, K.A., Groisman, P.Y., Holl<strong>and</strong>, G.J., Knutson, T.R., Kossin, J.P., Komar, P.D.,Levinson, D.H., & Smith, R.L. (2008). Observed changes in weather <strong>and</strong> climate extremes.In: Weather <strong>and</strong> <strong>Climate</strong> Extremes in a Changing <strong>Climate</strong>: Regions of Focus: North America,Hawaii, Caribbean, <strong>and</strong> U.S. Pacific Isl<strong>and</strong>s [Karl, T.R., G.A. Meehl, C.D. Miller, S.J. Hassol,A.M. Waple, <strong>and</strong> W.L. Murray (Eds.)]. Synthesis <strong>and</strong> Assessment Product 3.3. U.S. <strong>Climate</strong>Change Science Program, Washington, DC, pp. 35-80Kunkel, K.E., Karl, T.R., Brooks, H., Kossin, J., Lawrimore, J., Arndt, D., Bosart, L., Changnon,D., Cutter, S., Doesken, N., Emanuel, K., Groisman, P. Ya., Katz, R.W., Knutson, T., O’Brien,J., Paciorek, C., Peterson, T., Redmond, K., Robinson, D., Trapp, J., Vose, R., Weaver, S.,Wehner, M., Wolter, K., & Wuebbles, D. (2011). Monitoring <strong>and</strong> underst<strong>and</strong>ing changes inextreme storm statistics: State of knowledge. Bulletin of the American Meteorological Society, inreview.Kunreuther, H.C. & Michel-Kerjan, E.O. (2009a). At War with the Weather: Managing Large-ScaleRisks in a New Era of Catastrophes. MIT Press: Cambridge, MA. 448 pp.Kunreuther, H.C., & Michel-Kerjan, E.O. (2009b). Encouraging <strong>Adaptation</strong> to <strong>Climate</strong> Change:Long-Term Flood Insurance. Resources for the Future – Issue Brief 09-13. Retrieved fromhttp://www.rff.org/RFF/Documents/RFF-IB-09-13.pdf.
166 <strong>Coastal</strong> <strong>Impacts</strong>, <strong>Adaptation</strong>, <strong>and</strong> <strong>Vulnerabilities</strong>Kyper, T. & Sorenson, R. (1985). Potential impacts of sea level rise on the beach <strong>and</strong> coastal structuresat Sea Bright, New Jersey. In <strong>Coastal</strong> zone ’85, ed. O. T. Magson. New York: ASCE.Laffoley, D. & Grimsditch, G. (Eds.). (2009). The management of natural coastal carbon sinks.IUCN, Gl<strong>and</strong>, Switzerl<strong>and</strong>. 53 pp.L<strong>and</strong>sea, C.W. (2005). Hurricanes <strong>and</strong> global warming. Nature, 438, E11–E12, 582 doi:10.1038/nature04477.Langley, J.A., McKee, K.L., Cahoon, D.R., Cherry, J.A., & Megonigal, J.P. (2009). Elevated CO 2stimulates marsh elevation gain, counterbalancing sea-level rise. Proceedings of the NationalAcademy of Sciences 106, pp. 6182-6186.Larsen, P.H., Goldsmith, S., Smith, O., Wilson, M.L., Strzepek, K., Chinowsky, P., & Saylor, B.(2008). Estimating future costs for Alaska public infrastructure at risk from climate change.Global Environmental Change, 18(3), pp. 442-57.Latif, M., Boning, C., Willebr<strong>and</strong>, J., Biastoch, A., Dengg, J., Keenlyside, N., Schwenckerndiek,U. & Maduc, G. (2006). Is the Thermohaline circulation changing? Journal of <strong>Climate</strong>, 19, pp.4631-4637.Leatherman, S.P. (1984). <strong>Coastal</strong> geomorphic responses to sea level rise: Galveston Bay, Texas.151-174. See Barth <strong>and</strong> Titus (1984).Leuliette, E., Nerem, R., & Mitchum, G. (2004). Calibration of TOPEX/Poseidon <strong>and</strong> Jason altimeterdata to construct a continuous record of mean sea level change, Marine Geodesy, 27, pp.79-94, doi:10.1080/01490410490465193.Lewis, B.M., Erera, A.L., & White, C.C. (2006). Impact of Temporary Seaport Closures on FreightSupply Chain Costs. Transportation Research Record: Journal of the Transportation ResearchBoard, 1963(-1), pp. 64-70.Lin, B.B. & Morefield, P.E. (2011). The vulnerability cube: A multidimensional framework forassessing relative vulnerability. Environmental Management 48, pp. 631-643.Line, D.E., White, N.M., Kirby-Smith, W.W., & Potts, J.D. (2008). Fecal Coliform Export FromFour <strong>Coastal</strong> North Carolina Areas. Journal of the American Water Resources Association, 44(3),pp. 606-617.Linn, C. (2010). Pennsylvania. In The Likelihood of Shore Protection along the Atlantic Coast of theUnited States. Report by the Delaware Valley Regional Planning Commission to the U.S.Environmental Protection Agency, Washington, D.C. pp. 387-448.Loáiciga, H.A., Pingel, T.J., & Garcia, E.S. (2011). Sea water intrusion by sea-level rise: scenariosfor the 21st century. Ground Water, doi: 10.1111/j.1745-6584.2011.00800.x.London, J.B. & Volonte, C.R. (1991). L<strong>and</strong> use implications of sea level rise: A case study atMyrtle Beach, SC. <strong>Coastal</strong> Management, 19, pp. 205-218.London, J.B., Dyckman, C.S., Allen, J.S., St. John, C.C., Wood, I.L., & Jackson, S.R. (2009). AnAssessment of Shoreline Management Options Along the South Carolina Coast. Strom ThurmondInstitute, Clemson University, Clemson, SC.López-de-Lacalle, J. (2011). Trends in Alaska temperature data. Towards a more realisticapproach, <strong>Climate</strong> Dynamics, 1-11.Louisiana Department. of Transportation & Development, Office of Public Works <strong>and</strong> IntermodalTransportation. (2006). Status Report of Louisiana Ports from Hurricane Katrina.Retrieved from http://nam.digitaria.com/~/media/2DFC57E979D54B5FAFEDB4A570525E98/portstatusdamage.pdfLowe, A., Foster, J., & Winkelman, S. (2009). Ask the <strong>Climate</strong> Question: Adapting to <strong>Climate</strong>Change <strong>Impacts</strong> in Urban Regions. A Report by the Center for Clean Air Policy UrbanLeaders <strong>Adaptation</strong> Initiative. Washington D.C.: Center for Clean Air Policy, 44pp. Retrieved
References 167from http://www.ccap.org/docs/resources/674/Urban_<strong>Climate</strong>_<strong>Adaptation</strong>-FINAL_CCAP%206-9-09.pdfLubchenco, J. & Petes, L.E. (2010). The interconnected biosphere: Science at the ocean’s tippingpoints. Oceanography, 23(2), pp. 115-129.Luber, G. & McGeehin, M. (2008). <strong>Climate</strong> Change <strong>and</strong> Extreme Heat Events. American Journal ofPreventative Medicine, 35(5), pp. 429-35.Mackey, K.R.M., Van Dijken, G.L., Mazloom, S., Erhardt, A.M., Ryan, J., Arrigo, K., Paytan, A.(2010). Influence of atmospheric nutrients on primary productivity in a coastal upwellingregion. Global Biogeochemical Cycles, doi:10.1029/2009GB003737.Madsen, T. & Figdor, E. (2007). When It Rains, It Pours: Global Warming <strong>and</strong> the Rising Frequencyof Extreme Precipitation in the United States. Technical Report, Environment Maine, 47.Madsen, T., & Figdor, E. (2007). When It Rains, It Pours: Global Warming <strong>and</strong> the Rising Frequencyof Extreme Precipitation in the United States, Technical Report, Environment Maine, 47pp.Mailhot, A. & Duchesne, S. (2010), Design criteria of urban drainage infrastructures underclimate change. Journal of Water Resources Planning <strong>and</strong> Management, 136, pp. 201.Maine Administrative Code. 06-096 ch. 355, § 5 (West through 2010). S.C. Code Ann. §§ 48-39-280(A), 48-39-280(B) & 48-39-290(B)(2)(a). Tex. Nat. Res. Code Ann. §§ 61.001 et seq.(Thompson Reuters through 2010).Maine Department of Environmental Protection (MDEP). (2009). People <strong>and</strong> Nature Adapting toa Changing <strong>Climate</strong>: Charting Maine’s Course. Retrieved from http://www.maine.gov/dep/oc/adapt/Report_final.pdf. Accessed October 27, 2011Maine Department of Environmental Protection: People <strong>and</strong> Nature, Adapting to a Changing<strong>Climate</strong>: Charting Maine’s Course, A Summary of the Report Presented to the Joint St<strong>and</strong>ingCommittee on Natural Resources of the 124 th Maine Legislature (Feb. 2011)Manson, G.K., Solomon, S.M., Forbes D.L., Atkinson, D.E., & Craymer, M. (2005).Spatial variabilityof factors influencing coastal change in the western Canadian Arctic. GeoMarineLetters, 25, pp. 138-145.Marani, M., D’Alpaos, A., Lanzoni, S., Carniello, L. & Rinaldo, A. (2007). Biologically-controlledmultiple equilibria of tidal l<strong>and</strong>forms <strong>and</strong> the fate of the Venice lagoon. Geophysical ResearchLetters, 34(11), L11402, doi:10.1029/2007GL030178.Marion, C., Anthony, E.J., Trentesaux, A. (2009). Short-term (
168 <strong>Coastal</strong> <strong>Impacts</strong>, <strong>Adaptation</strong>, <strong>and</strong> <strong>Vulnerabilities</strong>Maryl<strong>and</strong> Code Annotated Environmental Article§ 16-201. See also MD Comprehensive Strategy,ch. 5, pp. 23-24.Maryl<strong>and</strong> Commission on <strong>Climate</strong> Change (MCCC). (2008). Maryl<strong>and</strong> <strong>Climate</strong> Action Plan.Retrieved from www.mdclimatechange.us/ewebeditpro/items/O40F14798.pdf. Accessed onOctober 27, 2011.Maryl<strong>and</strong> Commission on <strong>Climate</strong> Change <strong>Adaptation</strong> <strong>and</strong> Response Working Group, ComprehensiveStrategy for Reducing Maryl<strong>and</strong>’s Vulnerability to <strong>Climate</strong> Change Phase I: Sea-level Rise<strong>and</strong> <strong>Coastal</strong> Storms, ch. 5 at 9, 13 (2008).Maryl<strong>and</strong> Department of Natural Resources. (2010). <strong>Climate</strong> Change Policy: Building Resilienceto <strong>Climate</strong> Change. Maryl<strong>and</strong> Department of Natural Resources, Annapolis MD.Maryl<strong>and</strong> Department of Natural Resources. <strong>Coastal</strong> Habitats <strong>and</strong> Sea Level Rise. Retrieved fromhttp://www.dnr.state.md.us/ccp/habitats_slr.asp. Accessed December 22, 2011.McCabe, G.J., Clark, M.P., & Serreze, M.C. (2001). Trends in northern hemisphere surface cyclonefrequency <strong>and</strong> intensity. Journal of <strong>Climate</strong>, 14, pp. 2763–2768.McCue, T. (2010). East Central Florida. In: The Likelihood of Shore Protection along the AtlanticCoast of the United States. Volume 2: New Engl<strong>and</strong> <strong>and</strong> the Southeast. Report by the East FloridaRegional Planning Council to the U.S. Environmental Protection Agency. Washington, D.C.pp. 467-514.McGranahan, G., Balk, D., & Anderson, B. (2007). The rising tide: assessing the risks of climatechange <strong>and</strong> human settlements in low elevation coastal zones. Environment & Urbanization,19(1), pp. 17-37.McLellan, S.L., Hollis, E.J., Depas, M.M., Van Dyke, M., Harris, J., & Scopel, C.O. (2007). Distribution<strong>and</strong> fate of Escherichia coli in Lake Michigan following contamination with urbanstormwater <strong>and</strong> combined sewer overflows. Journal of Great Lakes Research , 33(3), pp. 566-580.Mcleod, E., Poulter, B., Hinkel, J., Rey, E., & Salm, R. (2010). Sea-level rise impact models <strong>and</strong>environmental conservation: A review of models <strong>and</strong> their applications. Ocean & <strong>Coastal</strong>Management, 53, pp. 507-517McNeall, D., Halloran, P.R., Good, P. & Betts, R.A. (2011). Analyzing abrupt <strong>and</strong> nonlinearclimate changes <strong>and</strong> their impacts. WIREs <strong>Climate</strong> Change, 2, pp. 663-686.Medvigy, D., & Beaulieu, C., (2012). Trends in daily solar radiation <strong>and</strong> precipitation coefficientsof variation since 1984. Journal of <strong>Climate</strong>, 25, pp. 1330–1339. doi: http://dx.doi.org/10.1175/2011JCLI4115.1Meehl, G.A., Stocker, T.F., Collins, W.D., Friedlingstein, P., Gaye, A.T., Gregory, J.M., Kitoh, A.,Knutti, R., Murphy, J.M., Noda, A., Raper, S.C.B., Watterson, I.G., Weaver, A.J., & Zhao, Z.C.(2007). Global climate projections. In: Solomon, S., Qin, D., Manning, M., Chen, Z., Marquis,M., Averyt, K.B., Tignor, M., Miller, H.L. (Eds.), <strong>Climate</strong> Change 2007: The Physical ScienceBasis. Contribution of Working Group I to the Fourth Assessment Report of the IntergovernmentalPanel on <strong>Climate</strong> Change. Cambridge University Press, Cambridge, United Kingdom<strong>and</strong> New York, NY, USA, pp.747–845.Mendez, F.J., Menendez, M., Luceno, A., & Losada, I.J. (2006). Estimation of the long-term variabilityof extreme significant wave height using a time-dependent Peak Over Threshold(POT) model, Journal of Geophysical Research, 111, C07024, doi:10.1029/2005JC003344.Menendez, M. & Woodworth, P.L. (2010). Changes in extreme high water levels based on aquasi-global tide-gauge dataset. Journal of Geophysical Research, 115, C10011.Menéndez, M., Méndez, F.J., Losada, I. J., & Graham, N.E. (2008). Variability of extreme waveheights in the northeast Pacific Ocean based on buoy measurements, Geophysical ResearchLetters, 35(22), doi:10.1029/2008GL035394.
References 169Menge, B.B., Gouhier, T.C., Freidenburg, T., & Lubchenco, J. (2011a). Linking long-term, largescaleclimatic <strong>and</strong> environmental variability to patterns of marine invertebrate recruitment:Toward explaining “unexplained” variation. Journal of Experimental Marine Biology <strong>and</strong>Ecology, 400, pp. 236-249. [http://dx.doi.org/10.1016/j.jembe.2011.02.003]Menge, B.B., Hacker, S.D., Freidenburg, T., Lubchenco, J., Craig, R., Rilov, G., Noble, M., &Richmond, E. (2011b). Potential impact of climate-related changes is buffered by differentialresponses to recruitment <strong>and</strong> interactions. Ecological Monographs, 81: 493-509. doi:http://dx.doi.org/10.1890/10-1508.1.Merrifield, M.A. (2011). A shift in western tropical Pacific sea level trends during the 1990s,Journal of Climatology, 24(15), pp. 4126-4138.Merrifield, M.A., Merrifield, S.T., & Mitchum, G.T. (2009). An anomalous recent acceleration ofglobal sea level rise. Journal of Climatology, 22, pp. 5772-5781.Merritt, P. (2010). Treasure Coast. In The Likelihood of Shore Protection along the Atlantic Coast of theUnited States. Volume 2: New Engl<strong>and</strong> <strong>and</strong> the Southeast. Report by the Treasure Coast RegionalPlanning Council to the U.S. Environmental Protection Agency. Washington, D.C. pp. 383-466.Michot, T.C., Day, R.H. & Wells, C.J. (2010). Increase in Black Mangrove Abundance in <strong>Coastal</strong>Louisiana. Louisiana Natural Resources News; Newsletter of the Louisiana Association ofProfessional Biologists, January, 2010, pp. 4-5.Millennium Ecosystem Assessment (MEA). 2005. Ecosystems <strong>and</strong> Human Well-Being: Synthesis.Isl<strong>and</strong> Press, Washington, DC.Miller, J.R. & Russell, G.L. (1992). The impact of global warming on river runoff. Journal ofGeophysical Research, 97, pp. 2757-2764.Mills, E. (2009). Global Review of Insurance Industry Responses to <strong>Climate</strong> Change. The Geneva Papers,34, at 323.Milly, P.C.D., Betancourt, J., Falkenmark, M., Hirsch, R.M., Kundzewicz, Z.W., Lettenmaier, D.P.,& Stouffer, R.J. (2008). Stationarity Is Dead: Whither Water Management? Science, v. 319, no.5863, pp. 573-574.Mitchell, C.M., Esnard, A-M. & Sapat, A. (2011). Hurricane Events <strong>and</strong> the Displacement Processin the United States. Natural Hazards Review, doi:10.1061/(ASCE)NH.1527-6996.0000064.Mitchum, G.T., Nerem, R.S., Merrifield, M.A., & Gehrels, W.R. (2010). Modern sea-level changeestimates. Chapter 5 in Sea-level rise <strong>and</strong> variability, Church, J.A., P.L.Woodworth, T. Aarup,<strong>and</strong> W.S. Wilson, (Eds.), Wiley-Blackwell, pp. 122-138.Mitrovica, J.X., Gomez, N., & Clark, P.U. (2009). The Sea-Level Fingerprint of West AntarcticCollapse. Science, 323, pp. 753.Mitrovica, J.X., Tamisiea, M, Davis, J. & Milne, G. (2001). Recent mass balance of polar ice sheetsinferred from patterns of global sea-level change. Nature, 409.Mohai, P., Pellow, D., & Roberts, J.T. Environmental Justice. (2009). Annual Review of Environment<strong>and</strong> Resources, 34, pp. 405-430.Moore, K.A. & Jarvis, J.C. (2008). Environmental factors affecting recent summertime eelgrassdiebacks in the lower Chesapeake Bay: implications for long-term persistence. Journal of<strong>Coastal</strong> Research, 55, pp. 135-147Moore, S.K., Mantua, J.J., Hickey, B.M., & Trainer, V.L. (2010). The relative influences of El NiñoSouthern Oscillation <strong>and</strong> Pacific Decadal Oscillation on paralytic shellfish toxin accumulationin Pacific Northwest shellfish. Limnology <strong>and</strong> Oceanography, 56, pp. 2262-2274.Moore, S.K., Trainer, V.L., Mantua, N.J., Parker, M.S., Laws, E.A., Fleming, L.E., & Backer, L.C.(2008). <strong>Impacts</strong> of climate variability <strong>and</strong> future climate change on harmful algal blooms <strong>and</strong>human health. Environmental Health, 7(Suppl 2), doi: 10.1186/1476-1069X-1187-S1182-S1184.
170 <strong>Coastal</strong> <strong>Impacts</strong>, <strong>Adaptation</strong>, <strong>and</strong> <strong>Vulnerabilities</strong>Moradkhani, H. & Baird, R.G. (2010). Assessment of climate change impact on floodplain <strong>and</strong>hydrologic ecotones. Journal of Hydrology, 395(3-4), pp. 264-278.Mori, N., Yasuda, T., Mase H., Tom, T., <strong>and</strong> Oku, Y. (2010). Projection of extreme wave climatechange under global warming. Hydrological Research Letters, 4, pp. 15-19.Morris, J.T., Sundareshwar, P.V., Nietch, C.T., Kjerfve, B., & Cahoon, D.R. (2002). Responses ofcoastal wetl<strong>and</strong>s to rising sea level. Ecology, 83, pp. 2869-2877.Morton, R.A., Guy, K.K., Hill, H.W., & Pascoe, T. (2003). Regional morphological responses tothe March 1962 Ash Wednesday storm. In, Proceedings <strong>Coastal</strong> Sediments ‘03. Davis, R.A.,Sallenger, A.H. <strong>and</strong> Howd, P. (Eds). America Society of Civil Engineers, Reston, VA.Moser, H., Hawkes, P., Amsten, O., Gaurfes, P., Mai, S., Pauli, G., & White, K. (2008). Envicom-Task Group 3: Waterborne transport, ports <strong>and</strong> waterways: A review of climate changedrivers, impacts, responses <strong>and</strong> mitigation. International Navigation Association (PIANC).Moser, S.C. & Tribbia, J. (2006). Vulnerability to Inundation <strong>and</strong> <strong>Climate</strong> Change <strong>Impacts</strong> in California:<strong>Coastal</strong> Managers’ Attitudes <strong>and</strong> Perceptions. Marine Technology Society Journal, 40(4),pp. 35-44.Moser, S.C., Williams, S.J., & Boesch, D.B. (2012). Coasts <strong>and</strong> Global Environmental Change:Wicked Problems at L<strong>and</strong>’s End. Annual Review of Environment <strong>and</strong> Resources, 37.Moss, R., Edmonds, J.A., Hibbard, K.A., Manning, M.R., Rose, S.K., van Vuuren, D.P., Carter,T., Emori, S., Kainuma, M., Kram, T., Meehl, G.A., Mitchell, G.F.B., Nakicenovic, N., Riahi,K., Smith, S.J., Stouffer, R.J., Thomson, A.M., Weyant, J.P., & T.J. Wilbanks. (2010). The nextgeneration of scenarios for climate change research <strong>and</strong> assessment. Nature, 463, pp. 747-756,doi:10.1038/nature08823.Mote, P., Petersen, A., Reeder, S., Shipman, H. & Binder, L. (2008). Sea Level Rise in the <strong>Coastal</strong>Waters of Washington State. A report by the University of Washington – <strong>Climate</strong> <strong>Impacts</strong>Group <strong>and</strong> the Washington Department of Ecology.Mousavi, M.E., Irish, J.L., Frey, A.E., Olivera, F., & Edge, B.L. (2011). Global warming <strong>and</strong> hurricanes:the potential impact of hurricane intensification <strong>and</strong> sea level rise on coastal flooding.Climatic Change, 104, pp. 575-597.Muhs, D.R., Wehmiller, J.F., Simmons, K.R., & York, L.L. (2004). Quaternary sea level history ofthe United States. Developments in Quaternary Science, 1, pp. 147-183.Mulholl<strong>and</strong>, M.R., Morse, R.E., Boneillo, G., Bernhardt, Filippino, K.C., Procise, L.A., Blanco-Garcia, J., Marshall, H.G., Egerton, T.A., Hunley, W.S., Moore, K.A., Berry, D.L., & Gobler,C.J. (2009). Underst<strong>and</strong>ing causes <strong>and</strong> impacts of the dinoflagellate, Cochlodiniumpolykrikoides, blooms in the Chesapeake Bay. Estuaries <strong>and</strong> Coasts. 32(4), pp. 734–747.Murakami, H., Wang, Y., Yoshimura, H., Mizuta, R., Sugi, M., Shindo, E., Adachi, Y., Yukimoto,S., Hosaka, M., Kusunoki, S., Ose, T., & Kitoh, A. (2011). Future changes in tropical cycloneactivity projected by the new high-resolution MRI-AGCM. Journal of <strong>Climate</strong>, 25, pp. 3237–3260, doi: http://dx.doi.org/10.1175/JCLI-D-11-00415.1.Murphy, R.R., Kemp, W.M., & Ball, W.P. (2011). Long-term trends in Chesapeake Bay seasonalhypoxia, stratification, <strong>and</strong> nutrient loading. Estuaries <strong>and</strong> Coasts, 34(6), pp.1293-1309.Murray, B.C., Pendleton, L., Jenkins, W.A., & Siflet, S. (2011). Green payments for blue carbon:Economic incentives for protecting threatened coastal habitats. Nicholas Institute for EnvironmentalPolicy Solutions Report NI R 11-04, Duke University.Muskett, R. & Romanovsky, V. (2011). Alaskan Permafrost Groundwater Storage Changes.Derived from GRACE <strong>and</strong> Ground Measurements: Remote Sensing, 3(2), pp. 378-397.N.C. Division of Emergency Management, North Carolina Sea Level Rise Risk Management Study,available at http://www.ncsealevelrise.com/Home (last visited Sep. 15, 2010); see also FEMA,
References 171FEMA Grants $5 Million for Sea Level Rise Study in North Carolina, available at http://www.fema.gov/news/newsrelease.fema?id=47583 (last visited Sep. 15, 2010).Najjar, R., Patterson, L. & Graham, S. (2009). <strong>Climate</strong> simulations of major estuarine watershedsin the Mid-Atlantic region of the US. Climatic Change. 95(1-2), pp. 139-168.Najjar, R., Pyke, C., Adams, M., Breitburg, D., Hershner, C., Kemp, M., Howarth, R., Mulholl<strong>and</strong>,M., Paolisso, M., Secor, D., Sellner, K., Wardrop, D., & Wood, R. (2010). Potential <strong>Climate</strong>Change <strong>Impacts</strong> on the Chesapeake Bay. Estuarine, <strong>Coastal</strong> <strong>and</strong> Shelf Science. 86(1), pp. 1-20.Nakićenović, N. & Swart, R. (2000). Special report on emissions scenarios. A special report ofWorking Group III of the Intergovernmental Panel on <strong>Climate</strong> Change. Cambridge UniversityPress, Cambridge.National Intelligence Council. (2008). National Intelligence Assessment on the National SecurityImplications of Global <strong>Climate</strong> Change to 2030, June 25, 2008: House Permanent SelectCommittee on Intelligence & House Select Committee on Energy Independence <strong>and</strong> GlobalWarming: Statement for the Record by Dr. Thomas Fingar, Deputy Director of NationalIntelligence for Analysis. Retrieved from http://www.dni.gov/nic/special_climate2030.html.National Park Service. (2011). Explore Geology: Tour of Park Geology - Shoreline Geology.Retrieved from http://nature.nps.gov/geology/tour/coastal.cfm.National Science <strong>and</strong> Technology Council, 2005. Gr<strong>and</strong> challenges for disaster reduction. Washington,Office of Science <strong>and</strong> Technology Policy, National Science <strong>and</strong> Technology Council,Committee on Environment <strong>and</strong> Natural Resources, Subcommittee on Disaster Reduction,pp. 21.Neumann, J., Hudgens, D., Herter, J., & Martinich, J. (2010). The Economics of <strong>Adaptation</strong> alongDeveloped Coastlines. WIREs <strong>Climate</strong> Change, DOI: 10.1002/WCC.90.New York City Panel on <strong>Climate</strong> Change. (2010). <strong>Climate</strong> change adaptation in New York City:building a risk management response. Annals of the New York Academy of Sciences 1196,pp. 1–354.Nicholls, R., Wong, P., Burkett, V., Woodroffe, C., & Hay, J. (2008). <strong>Climate</strong> change <strong>and</strong> coastalvulnerability assessment: scenarios for integrated assessment. Sustainability Science, 3, pp.89-102.Nicholls, R.J., (2010). <strong>Impacts</strong> <strong>and</strong> responses to sea-level rise. Sea-level rise <strong>and</strong> variability, Church,J.A., P.L.Woodworth, T. Aarup, <strong>and</strong> W.S. Wilson, (Eds.), Wiley-Blackwell, pp. 17-43.Nicholls, R.J., Marinova, N., Lowe, J.A., Brown, S., Vellinga, P., De Gusmao, D., Hinkel, J., & Tol,R.S.J. (2011). Sea-level rise <strong>and</strong> its possible impacts given a beyond 4 C world in the twentyfirstcentury. Royal Society of London Philosophical Transactions Series A, 369, pp. 1-21.Nicholls, R.J., Wong, P.P., Burkett, V., Codignotto, J., Hay, J., McLean, R., Ragoonaden, S., &Woodroffe, C. (2007). <strong>Coastal</strong> Systems <strong>and</strong> Low-lying Areas. IN: M. L. Parry, O.F. Canziani,J.P Palutikof, P.J. van der Linden, <strong>and</strong> C.E. Janson (Eds.), <strong>Climate</strong> Change <strong>Impacts</strong>, <strong>Adaptation</strong>s<strong>and</strong> Vulnerability. Intergovernmental Panel on <strong>Climate</strong> Change, Working Group 2, FourthAssessment Report. Cambridge University Press. London, UK, pp. 316-356.Nichols, S. & Bruch, C. (2008). New Frameworks for Managing Dynamic Coasts: Legal <strong>and</strong>Policy Tools for Adapting U.S. <strong>Coastal</strong> Zone Management to <strong>Climate</strong> Change. Sea Grant Law<strong>and</strong> Policy Journal, 1(1), pp19-42.NOAA (National Oceanic <strong>and</strong> Atmospheric Administration). (1961). Rainfall Frequency Atlas of theEastern United States for Duration from 30 minutes to 24 hours <strong>and</strong> Return Periods from 1 to 100years. Technical Paper No. 40. Retrieved from http://www.nws.noaa.gov/oh/hdsc/PF_documents/TechnicalPaper_No40.pdf.NOAA (National Oceanic <strong>and</strong> Atmospheric Administration). (1990). Planning Guide at 35-36; IPCC
172 <strong>Coastal</strong> <strong>Impacts</strong>, <strong>Adaptation</strong>, <strong>and</strong> <strong>Vulnerabilities</strong>Response Strategies Working Group, Report of the <strong>Coastal</strong> Zone Management Subgroup,Strategies for <strong>Adaptation</strong> to Sea Level Rise at 19-20.NOAA (National Oceanic <strong>and</strong> Atmospheric Administration). (2010). Adapting to <strong>Climate</strong> Change:A Planning Guide for State <strong>Coastal</strong> Managers. NOAA Office of Ocean <strong>and</strong> <strong>Coastal</strong> ResourceManagement. Retrieved from http://coastalmanagement.noaa.gov/climate/adaptation.html.NOAA (National Oceanic <strong>and</strong> Atmospheric Administration). (2011). Regional workshops on<strong>Coastal</strong> Habitat Conservation in a Changing <strong>Climate</strong>: Strategies <strong>and</strong> Tools. Retrieved fromhttp://www.joss.ucar.edu/events/2011/coastal_habitat/index.html.NOAA (National Oceanic <strong>and</strong> Atmospheric Administration). (2011). U.S. sets record with adozen billion-dollar weather disasters in one year. NOAA press release, dated Dec. 7, 2011.retrieved from http://www.noaanews.noaa.gov/stories2011/20111207_novusstats.htmlNOAA (National Oceanic <strong>and</strong> Atmospheric Administration). (2011a). Energy Production topicon the NOAA State of the Coast Web Site. Retrieved from http://stateofthecoast.noaa.gov/energy/welcome.html.NOAA (National Oceanic <strong>and</strong> Atmospheric Administration). (2011b). <strong>Coastal</strong> Population topic onthe NOAA State of the Coast Web Site. Retrieved from http://stateofthecoast.noaa.gov/population/welcome.html.NOAA (National Oceanic <strong>and</strong> Atmospheric Administration). (2011c). <strong>Coastal</strong> Economy topicon the NOAA State of the Coast Web Site. Retrieved from http://stateofthecoast.noaa.gov/coastal_economy/welcome.html.NOAA (National Oceanic <strong>and</strong> Atmospheric Administration). (2011d). Commercial Fishing topicon the NOAA State of the Coast Web Site. Retrieved from http://stateofthecoast.noaa.gov/com_fishing/welcome.html.NOAA (National Oceanic <strong>and</strong> Atmospheric Administration). (2011e). Recreational Fishing topicon the NOAA State of the Coast Web Site. Retrieved from http://stateofthecoast.noaa.gov/rec_fishing/welcome.html.NOAA (National Oceanic <strong>and</strong> Atmospheric Administration). (2011f). Ports topic on the NOAAState of the Coast Web Site. Retrieved from http://stateofthecoast.noaa.gov/ports/welcome.html.NOAA (National Oceanic <strong>and</strong> Atmospheric Administration). (2011g). Wetl<strong>and</strong>s topic on theNOAA State of the Coast Web Site. Retrieved from http://stateofthecoast.noaa.gov/wetl<strong>and</strong>s/welcome.html.NOAA (National Oceanic <strong>and</strong> Atmospheric Administration). (2012). Billion Dollar U.S. Weather/<strong>Climate</strong> Disasters. Retrieved from http://www.ncdc.noaa.gov/oa/reports/billionz.html.NOAA (National Oceanic <strong>and</strong> Atmospheric Administration). (2012). Sea-level rise topic on theNOAA Laboratory for Satellite Altimetry Site. Retrieved from http://ibis.grdl.noaa.gov/SAT/SeaLevelRise/ <strong>and</strong> personal correspondence.Noblis. 2010. <strong>Climate</strong> Change Planning for Military Installations: Findings <strong>and</strong> Implications.Retrieved from http://www.mwcog.org/uploads/committee-documents/ll1dXltf20120515090746.pdf .Norkko, J., Norkko, A., Thrush, S.F., Valanko, S., Suurkukka, H. (2010). Conditional responses toincreasing scales of disturbance, <strong>and</strong> potential implications for threshold dynamics in softsedimentcommunities. Marine Ecology Progress Series, 413, pp. 253-266.Noss, R.F. (2011). Between the devil <strong>and</strong> the deep blue sea: Florida’s unenviable position withrespect to sea level rise. Climatic Change, 107, pp. 1-16.NRC (National Research Council). (1987). Responding to Changes in Sea Level: Engineering Implications.National Academies Press, Washington, DC.
References 173NRC (National Research Council). (2007). Mitigating shore erosion along sheltered coasts. NationalAcademies Press, Washington, D.C. 174 pp.NRC (National Research Council). (2008) Urban stormwater management in the United States.National Academies Press, Washington, DC.NRC (National Research Council). (2008). Potential impacts of climate change on US transportation.Committee on <strong>Climate</strong> Change <strong>and</strong> U.S. Transportation. Special Report 290.NRC (National Research Council). (2009). Informing Decisions in a Changing <strong>Climate</strong>. Panel onStrategies <strong>and</strong> Methods for <strong>Climate</strong>-Related Decision Support, Committee on the HumanDimensions of Global Change. Division of Behavioral <strong>and</strong> Social Sciences <strong>and</strong> Education.National Academies Press, Washington, DC.NRC (National Research Council). (2010a). America’s <strong>Climate</strong> Choices: Advancing the Science of<strong>Climate</strong> Change. National Academies Press, Washington, DC.NRC (National Research Council). (2010b). America’s <strong>Climate</strong> Choices: Adapting to the <strong>Impacts</strong> of<strong>Climate</strong> Change. National Academies Press, Washington, DC.NREL (National Renewable Energy Laboratory). (2010). Large-Scale Offshore Wind Power in theUnited States. Department of Commerce, National Technical Information Service, NREL/TP-500-49229.OMB (U.S. Office of Management <strong>and</strong> Budget). (2007). North American Industry ClassificationSystem. United States Office of Management <strong>and</strong> Budget’s Economic Classification PolicyCommittee. Retrieved from http://www.census.gov/epcd/naics/naicsfr4.pdf.OREC (Ocean Renewable Energy Coalition). (2011). U.S. Marine <strong>and</strong> Hydrokinetic RenewableEnergy Roadmap. Retrieved from http://www.oceanrenewable.com/wp-content/uploads/2011/05/MHK-Roadmap-Final-November-2011.pdf.Orr, J.C., Fabry, V.J., Aumont, O., Bopp, L., Doney, S.C., Feely, R.A., Gnanadesikan, A., Gruber,N., Ishida, A., Joos, F., Key, R.M., Lindsay, K., Maier-Reimer, E., Matear, R., Monfray,P., Mouchet, A., Najjar, R.G., Plattner, G.K., Rodgers, K.B., Sabine, C.L., Sarmiento, J.L.,Schlitzer, R., Slater, R.D., Totterdell, I.J., Weirig, M.F., Yamanaka, Y., & Yool, A. (2005).Anthropogenic ocean acidification over the twenty-first century <strong>and</strong> its impact on calcifyingorganisms. Nature, 437, pp. 681-686.Orth, R.J., Carruthers, T.J.B., Dennison, W.C., Duarte, C.M., Fourqurean, J.W., Heck Jr., K.L.,Hughes, A.R., Kendrick, G.A., Kenworthy, W.J., Olyarnik, S., Short, F.T., Waycott, M., &Williams, S.L. (2006). A global crisis for seagrass ecosystems. BioScience, 56, pp. 987-996.Orth, R.J., Williams, M.R., Marion, S.R., Wilcox, D.J., Carruthers, T.J.B., Moore, K.A., Kemp,W.M., Dennision, W.C., Rybicki, N., Bergstrom, P., Batiuk, R.A. (2010). Long-Term Trendsin Submersed Aquatic Vegetation (SAV) in Chesapeake Bay, USA, Related to Water Quality.Estuaries <strong>and</strong> Coasts, 33(5) pp. 1144-1163.Osterkamp, T.E. (2007). Characteristics of the recent warming of permafrost in Alaska. Journal ofGeophysical Research, 112(F02S02).Overeem, I. & Syvitski, J.P.M. (2009). Dynamics <strong>and</strong> Vulnerability of Delta Systems. LOICZReports & Studies No. 35. GKSS Research Center, Geesthacht, 54 pp.Overeem, I., Anderson, R.S., Wobus, C.W., Clow, G.D., Urban, F.E., & Matell, N. (2011). Sea iceloss enhances wave action at the Arctic coast. Geophysical Research Letters, 38.Overpeck, J.T., Otto-Bliesner, B.L., Miller, G.H., Muhs, D.R., Alley, R.B., & Kiehl, J.T. (2006).Paleoclimatic evidence for future ice-sheet instability <strong>and</strong> rapid sea-level rise. Science, 311,pp. 1747-1750.Ozyurt, G. & Ergin, A. (2010). Improving coastal vulnerability assessments to sea-level rise: a newindicator-based methodology for decision makers. Journal of <strong>Coastal</strong> Research, 26, pp. 265–273.
174 <strong>Coastal</strong> <strong>Impacts</strong>, <strong>Adaptation</strong>, <strong>and</strong> <strong>Vulnerabilities</strong>Paerl, H.W., & Huisman, J. (2008). Blooms like it hot. Science, 320, pp. 57-58.Paerl, H.W., Valdes, L.M, Adolf, J.E., Peierls, B.M., & Harding, L.W. Jr. (2006a). Anthropogenic<strong>and</strong> climatic influences on the eutrophication of large estuarine ecosystems. Limnology <strong>and</strong>Oceanography, 51, pp. 448-462.Paerl, H.W., Valdes, L.M., Joyner, A.R., Peierls, B.L., Buzzelli, C.P., Piehler, M.F., Riggs, S.R.,Christian, R.R., Ramus, J.S., Clesceri, E.J., Eby, L.A., Crowder, L.W., & Luettich, R.A. (2006b).Ecological response to hurricane events in the Pamlico Sound System, NC <strong>and</strong> implicationsfor assessment <strong>and</strong> management in a regime of increased frequency. Estuaries <strong>and</strong> Coasts, 29,pp. 1033-1045.Pankhurst, N.W. & Munday, P.L. (2011). Effects of climate change on fish reproduction <strong>and</strong> earlylife history stages. Marine <strong>and</strong> Freshwater Research, 62, pp. 1015–1026.Pardo, P.C., Padín, X.A., Gilcoto, M., Farina-Busto, L., Pérez, F.F. (2011). Evolution of upwellingsystems coupled to the long-term variability in sea surface temperature <strong>and</strong> Ekman transport.<strong>Climate</strong> Research, 48, pp. 231–246, doi: 10.3354/cr00989.Park, J., Obeysekera, J., Irizarry, M., Barnes, J., Trimble, P., & Park-Said, W. (2011). Storm surgeprojections <strong>and</strong> implications for water management in South Florida. Climatic Change, 107,pp. 109-128.Park, J.H., Duan, L., Kim, B., Mitchell, M.J., & Shibata, H. (2010). Potential effects of climatechange <strong>and</strong> variability on watershed biogeochemical processes <strong>and</strong> water quality in NortheastAsia. Environment International, 36(2), pp. 212-225.Park, R.A., Trehan, M.S., Mausel, P.W., & Howe, R.C. (1989). The Effects of Sea Level Rise on U.S.<strong>Coastal</strong> Wetl<strong>and</strong>s. In Potential Effects of <strong>Climate</strong> Change on the United States: Appendix B,Sea Level Rise, Washington, DC: U. S. Environmental Protection Agency.Parris, A. & Lacko, L. (2009). <strong>Climate</strong> change adaptation in the San Francisco Bay: A case formanaged realignment. Shore <strong>and</strong> Beach, 77, pp. 46-52.Parris, A., Bromirski, P., Burkett, V. Cayan, D., Culver, M., Hall, J., Horton, R., Knuuti, K., Moss,R, Obeysekera, J., Sallenger, A., & Weiss, J. (In Press). Global Sea Level Rise Scenarios for theU.S. National <strong>Climate</strong> Assessment. NOAA Tech Memo OAR XXXX. 37 pp.Patz, J.A., Vavrus, S.J., Uejio, C.K., & McLellan, S.L. (2008). <strong>Climate</strong> Change <strong>and</strong> WaterborneDisease risk in the Great Lakes region of the U.S. American Journal of Preventative Medicine,35(5), 451 pp.Pavlis, N.K., Holmes, S.A., Kenyon, S.C., & Factor, J.K. (2008, April 13-18). An Earth GravitationalModel to Degree 2160: EGM2008, presented at the 2008 General Assembly of the EuropeanGeosciences Union, Vienna, Austria.Pendleton, E.A., Barras, J.A., Williams, S.J., & Twichell, D.C. (2010). <strong>Coastal</strong> vulnerability assessmentof the Northern Gulf of Mexico to sea-level rise <strong>and</strong> coastal change: U.S. GeologicalSurvey Open-File Report 2010-1146. Retrieved from http://pubs.usgs.gov/of/2010/1146/.Pendleton, L. (2008). The Economic <strong>and</strong> Market Value of Coasts <strong>and</strong> Estuaries: What’s At Stake?Restore America’s Estuaries. Retrieved from https://www.estuaries.org/reports/Peperzak, L. (2003). <strong>Climate</strong> change <strong>and</strong> harmful algal blooms in the North Sea. Acta Oecologica.24(S1), pp. 139–144.Perry, J.E. & Hershner, C.H. (1999). Temporal changes in the vegetation pattern in a tidal freshwatermarsh. Wetl<strong>and</strong>s. 19(1), pp. 90–99.Peters, G., Marl<strong>and</strong>, G., Le Quere, M., Boden T., Canadell, J.,& Raupach M. (2011). RapidGrowth in CO2 emissions after the 2008-2009 global financial crisis. Nature <strong>Climate</strong> Change,doi:10.1038/nclimate1332Peterson, C.D., Doyle, D.L., & Barnett, E.T. (2000). <strong>Coastal</strong> flooding <strong>and</strong> beach retreat from
References 175coseismic subsidence in the central Cascadia margin, USA. Environmental & EngineeringGeoscience, 6, pp. 255-269.Peterson, T.J., Western, A.W., & Argent, R.M. (2009). Multiple hydrological stable states <strong>and</strong>the probability of climate variability causing a threshold crossing. 18th World IMACS /MODSIM Congress, Cairns, Australia. Retrieved from http://mssanz.org.au/modsim09: 7.Peters-Stanley, M., Hamilton, K., Marcello, T., & Sjardin, M. (2011). Back to the Future: State of theVoluntary Carbon Markets 2011. New York, NY <strong>and</strong> Washington, DC: Ecosystem Marketplace& Bloomberg New Energy Finance.Pfeffer, W.T., Harper, J.T., & O’Neel, S. (2008). Kinematic constraints on glacier contributions to21st-century sea-level rise. Science, 321, pp. 1340-1343.Phillips, A.M.B., DePaolo, A., Bowers, J., Ladner, S., & Grimes, D.J. (2007). An evaluation of theuse of remotely sensed parameters for prediction of incidence <strong>and</strong> risk associated withVibrio parahae- molyticus in Gulf Coast oysters (Crassostrea virginica). Journal of FoodProtection, 70, pp. 879-884.Pielke, R.A. Jr., Gratz, J., L<strong>and</strong>sea, C.W., Collins, D., Saunders, M.A., & Musulin, R. (2008).Normalized hurricane damage in the United States: 1900-2005. Natural Hazards Review, 9(1),pp. 29-42.Polyak, L., Andrews, J., Brigham-Grette, J., Darby, D., Dyke, A., Funder, S., Holl<strong>and</strong>, M.,Jennings, A., Savelle, J., Serreze, M., & Wolff, E. (2009). History of sea ice in the Arctic. In:Past <strong>Climate</strong> Variability <strong>and</strong> Change in the Arctic <strong>and</strong> at High Latitude. Synthesis <strong>and</strong> AssessmentProduct 1.2. U.S. Geological Survey, Reston, VA, pp. 358-420.Polyakov, I.V., Bekraev, V., Alekseev, G.V., Bhatt, U.S., Colony, R.L., Johnson, M.A., Maskshtas,A.P., Walsh, D. (2003). Variability <strong>and</strong> Trends of Air Temperature <strong>and</strong> Pressure in the MaritimeArctic, 1875–2000. Journal of <strong>Climate</strong>, 16, pp. 2067-2077.Pontee, N.I. & Morris, K. (2011). CoastRanger MS: A tool for improving public engagement.Journal of <strong>Coastal</strong> Research, 27(1), pp. 18–25.Portier, C.J., et al. (2010). A Human Health Perspective on <strong>Climate</strong> Change: A Report Outliningthe Research Needs on the Human Health Effects of <strong>Climate</strong> Change, Environmental HealthPerspectives, National Institute for Environmental Health Science. Retrieved from www.niehs.nih.gov/climatereport.Preston, B.L., Westaway, R.M., & Yuen, E.J. (2011a). <strong>Climate</strong> adaptation planning in practice: anevaluation of adaptation plans from three developed nations. Mitigation <strong>and</strong> <strong>Adaptation</strong> Strategiesfor Global Change, 16(4), pp. 407–438.Preston, B.L., Yuen, E.J., & Westaway, R.M. (2011b) Putting vulnerability to climate change on themap: a review of approaches, benefits, <strong>and</strong> risks. Sustainability Science, 6(2), pp. 177–202.Price, S.F., Payne, A.J., Howat, I.M., & Smith, B.E. (2011). Committed sea-level rise for the nextcentury from Greenl<strong>and</strong> ice sheet dynamics during the past decade. Proceedings of theNational Academies of Science, doi/10.1073/pnas.1017313108.Prowse, T.D., Furgal, C., Chouinard, R., Melling, H., Milburn, D., & Smith, S.L. (2009). Implicationsof climate change for economic development in northern Canada: energy, resource,<strong>and</strong> transportation sectors. Ambio, 38(5), pp. 272-281.Pryor, S.C., Howe, J.A., & Kunkel, K.E. (2009). How spatially coherent <strong>and</strong> statistically robust aretemporal changes in extreme precipitation in the contiguous USA? International Journal ofClimatology, 29, pp. 31–45.Purcell, J.E. & Decker, M.B. (2005). Effects of climate on relative predation by scyphomedusae<strong>and</strong> ctenophores on copepods in Chesapeake Bay during 1987-2000. Limnology <strong>and</strong> Oceanography,50, pp. 376-387
176 <strong>Coastal</strong> <strong>Impacts</strong>, <strong>Adaptation</strong>, <strong>and</strong> <strong>Vulnerabilities</strong>Rabalais, N.N., Turner, R.E., Díaz, R.J., & Justic, D. (2009) Global change <strong>and</strong> eutrophication ofcoastal waters. ICES Journal of Marine Science: Journal du Conseil, 66(7), pp. 1528-1537.Rahmstorf, S. & Vermeer, M. (2011). Discussion of Houston, J.R. <strong>and</strong> Dean, R.G.: Sea-level accelerationbased on U.S. tide gauges <strong>and</strong> extensions of previous global-gauge analysis, Journalof <strong>Coastal</strong> Research, 27(3), 409-417. Journal of <strong>Coastal</strong> Research, 27(4), pp. 784-787.Rahmstorf, S. (2007). A Semi-Empirical Approach to Projecting Future Sea-level rise. Science,315(5810), pp. 368-370.Rahmstorf, S. (2010). A new view on sea level rise. Nature Reports <strong>Climate</strong> Change, 4, pp. 44-45.Rahmstorf, S., (2007). A semi-empirical approach to projecting future sea-level rise. Science, 315,pp. 368-370.Ravens, T., Jones, B.M., Zhang, J., Arp, C.D., & Schmutz, J.A. (2012). Process-Based <strong>Coastal</strong>Erosion Modeling for Drew Point (North Slope, Alaska). Journal of Waterway, Port, <strong>Coastal</strong>,<strong>and</strong> Ocean Engineering (in press).Ravens, T.M & Lee, W. (2007). Evolution of a North Slope Barrier Isl<strong>and</strong> (Narwhal Isl<strong>and</strong>, NorthArctic Alaska) 1955-2007. AGU Fall Meeting, Dec. 10-14, San Francisco, CA.Rawlins, M.A., Steele, M., Holl<strong>and</strong>, M.M., Adam, J.C., Cherry, J.E., Francis, J.A., Groisman, P.Y.,Hinzman, L.D., Huntington, T.G., Kane, D.L., Kimball, J.S., Kwok, R., Lammers, R.B., Lee,C.M., Lettenmaier, D.P., McDonald, K.C., Podest, E., Pundsack, J.W., Rudels, B., Serreze,M.C., Shiklomanov, A., Skagseth, O., Troy, T.J., Vorosmarty, C.J., Wensnahan, M., Wood,E.F., Woodgate, R., Yang, D., Zhang, K., Zhang, T. (2010). Analysis of the Arctic System forFreshwater Cycle Intensification: Observations <strong>and</strong> Expectations. Journal of <strong>Climate</strong>, 23, pp.5715-5737.Reed, D.J., Bishara, D.A., Cahoon, D., Donnelly, J., Kearney, M., Kolker, A., Leonard, L., Orson,R.A., & Stevenson, J.C. (2008). Site-specific scenarios for wetl<strong>and</strong>s accretion as sea level risesin the mid-Atlantic region. In: Background Documents Supporting <strong>Climate</strong> Change ScienceProgram Synthesis <strong>and</strong> Assessment Product 4.1: <strong>Coastal</strong> Elevations <strong>and</strong> Sensitivity to SeaLevel Rise [Titus, J.G. <strong>and</strong> E.M. Strange (Eds.)]. EPA 430-R-07-004. U.S. EnvironmentalProtection Agency, Washington, DC, pp. 134-174.Reeve, D. (2010). On the <strong>Impacts</strong> of <strong>Climate</strong> Change for Port Design. 26th International Conferencefor Seaports & Maritime Transport “Integration For a Better Future”.Resio, D.T., Irish, J.L., & Cialone, M.A. (2009). A surge response function approach to coastalhazard assessment: Part 1, Basic Concepts. Journal of Natural Hazards, 51(1), pp. 163-182.Restore America’s Estuaries, (2011). Jobs <strong>and</strong> Dollars: Big returns from <strong>Coastal</strong> Habitat Restoration.Arlington, VA: Restore America’s Estuaries.Riggs, S.R., Ames, D., Culver, S., & Mallinson, D. (2011). The Battle for North Carolina’s Coast:Evolutionary History, Present Crisis, <strong>and</strong> Vision for the Future. University of North CarolinaPress, Chapel Hill, NC.Rignot, E., Bamber, J.L., van den Broeke, M.R., Davis, C., Li, Y., van de Berg, W.J., & vanMeijgaard, E. (2008). Recent Antarctic ice mass loss from radar interferometry <strong>and</strong> regionalclimate modelling. Nature Geoscience, 1, pp. 106-110, doi:10.1038/ngeo102Rignot, E., Velicogna, I., van den Broeke, M.R., Monaghan, A., & Lenaerts, J. (2011). Accelerationof the contribution of the Greenl<strong>and</strong> <strong>and</strong> Antarctic ice sheets to sea level rise. GeophysicalResearch Letters, 38, L05503, doi:10.1029/2011GL046583, 5 pp.Rignot, E.J., Casassa, G., Gogineni, P., Krabill, W., Rivera, A., & Thomas, R. (2004). Acceleratedice discharge from the Antarctic Peninsula following the collapse of Larsen B ice shelf.Geophysical Research Letters, 31, L18401, doi:10.1029/2004GL0697.Rignot, E.J., Casassa, G., Gogineni, P., Krabill, W., Rivera, A., & Thomas, R. (2004). Accelerated
References 177ice discharge from the Antarctic Peninsula following the collapse of Larsen B ice shelf.Geophysical Research Letters, 31, L18401, doi:10.1029/2004GL0697.Riva, R.E.M., Bamber, J.L., Lavallée, D.A., & Wouters, B. (2010). Sea-level fingerprint of continentalwater <strong>and</strong> ice mass change from GRACE. Geophysical Research Letters, 37, L19605.Rose, J., Gast, R., Bogomolni, A., Ellis, J., Lentell, B., Touhey, K., & Moore, M.J. (2009). Occurrence<strong>and</strong> patterns of antibiotic resistance invertebrates off the Northeastern United States coast.FEMS Microbiology Ecology, 67, pp. 421-431.Rosenberg, E.A., Keys, P.W., Booth, D.B., Hartley, D., Burkey, J., Steinmann, A.C., & Lettenmaier,D.P. (2010). Precipitation extremes <strong>and</strong> the impacts of climate change on stormwater infrastructurein Washington State. Climatic Change, 102(1), pp. 319-49.Rosenzweig, C., Casassa, G., Karoly, D.J., Imeson, A., Liu, C., Menzel, A., Rawlins, S., Root,T.L., Seguin, B., Tryjanowski, P. (2007). Assessment of observed changes <strong>and</strong> responses innatural <strong>and</strong> managed systems. In, <strong>Climate</strong> Change 2007: <strong>Impacts</strong>, <strong>Adaptation</strong> <strong>and</strong> Vulnerability.Contribution of Working Group II to the Fourth Assessment Report of the IntergovernmentalPanel on <strong>Climate</strong> Change. M.L. Parry, O.F. Canziani, J.P. Palutikof, P.J. van derLinden <strong>and</strong> C.E. Hanson (Eds.). Cambridge University Press, Cambridge, UK, pp. 79-131.Rosenzweig, C., Solecki, W., Blake, R., Bowman, M., Faris, C., Gornitz, V., Horton, R., Jacob, K.,LeBlanc, A., Leichenko, R., Linkin, M., Major, D., O’Grady, M., Patrick, L., Sussman, E., Yohe,G., & Zimmerman, R. (2011). Developing <strong>Coastal</strong> <strong>Adaptation</strong> to <strong>Climate</strong> Change in the NewYork City Infrastructure-shed: Process, Approach, Tools, <strong>and</strong> Strategies. Climatic Change, 106,pp. 93-127.Rowl<strong>and</strong>, E.L., Davidson, J.E. & Graumlich, L.J. (2011). Approaches to evaluating climate changeimpacts on species: a guide to initiating the adaptation planning process. EnvironmentalManagement, 47, pp. 322–337.Royal Society. (2005). Ocean Acidification Due to Increasing Atmospheric Carbon Dioxide. PolicyDocument 12/05. Royal Society, London, 60 pp.Rozum, J.S., Wilson, E., Arnold, C. (2005). Strengthening Integration of L<strong>and</strong> Use Research <strong>and</strong>Outreach Through Innovative Web Technology. Journal of Extension, 43(5), Article #5IAW1.Ruggiero, P., Buijsman, M.C., Kaminsky, G., & Gelfenbaum, G. (2010b). Modeling the effectof wave climate <strong>and</strong> sediment supply variability on large-scale shoreline change. MarineGeology, 273, pp. 127-140, DOI:10.1016/j.margeo.2010.02.008.Ruggiero, P., Komar, P.D., & Allan, J.C. (2010a). Increasing wave heights <strong>and</strong> extreme-valueprojections: the wave climate of the U.S. Pacific Northwest. <strong>Coastal</strong> Engineering, 57(5), pp.539-552. Retrieved from http://dx.doi.org/10.1016/j.coastaleng.2009.12.005.Ruhl, H.A. & Rybicki, N.B. (2010). Long-term reductions in anthropogenic nutrients link toimprovements in Chesapeake Bay habitat. Proceedings of the National Academy of Sciences,107(38), pp. 16566-16570.Russo, E.J. & Burks-Copes, K.A. (2011). Risk Quantification for Sustaining <strong>Coastal</strong> Military InstallationAssets <strong>and</strong> Mission Capabilities, RC-1701 Project, Strategic Environmental Research<strong>and</strong> Development Program. Retrieved from http://www.serdp.org/Program-Areas/Resource-Conservation-<strong>and</strong>-<strong>Climate</strong> change/<strong>Climate</strong> change/Vulnerability-<strong>and</strong>-Impact-Assessment/RC-1701.Sallenger, A.S., Wright, C.W. & Lillycrop, J. (2007). <strong>Coastal</strong> change impacts during HurricaneKatrina: an overview. In, <strong>Coastal</strong> Sediments 07. Kraus, N.C. <strong>and</strong> Rosati, J.D. (Eds.). AmericaSociety of Civil Engineers, Reston, VA, pp. 888-896.Santer, B.D., Wigley, T.M.L., Gleckler, P.J., Bonfils, C., Wehner, M.F., Achuta-Rao, K., Barnett,T.P., Boyle, J.S., Bruggemann, W., Fiorino, M., Gillett, N., Hansen, J.E., Jones, P.D., Klein,
178 <strong>Coastal</strong> <strong>Impacts</strong>, <strong>Adaptation</strong>, <strong>and</strong> <strong>Vulnerabilities</strong>S.A., Meehl, G.A., Raper, S.C.B., Reynolds, R.W., Taylor, K.E., & Washington, W.M. (2006).Forced <strong>and</strong> unforced ocean temperature changes in Atlantic <strong>and</strong> Pacific tropical cyclogenesisregions. Proceedings of the National Academy of Sciences, 103(38), pp. 13905-13910.Savonis, M.J., Burkett, V.R., & Potter, J.R. (2008). <strong>Impacts</strong> of <strong>Climate</strong> Change <strong>and</strong> Variabilityon Transportation Systems <strong>and</strong> Infrastructure: Gulf Coast Study. Report by the US <strong>Climate</strong>Change Science Program <strong>and</strong> the Subcommittee on Global Change Research.Scambos, T.A., Bohl<strong>and</strong>er, J.A., Shuman, C.A., & Skvarca, P. (2004). Glacier acceleration <strong>and</strong>thinning after ice shelf collapse in the Larsen B embayment, Antarctica. Geophysical ResearchLetters, 31(18), L18402.Schaefer, S.C. & Alber, M. (2007). Temperature controls a latitudinal gradient in the proportion ofwatershed nitrogen exported to coastal ecosystems. Biogeochemistry, 85(3), pp. 333–346.Schaefer, S.C., Hollibaugh, J.T., Alber, M. (2009). Watershed nitrogen input <strong>and</strong> riverine exporton the west coast of the U.S. Biogeochemistry, 93(3), pp. 219-233.Scheffer, M., Bascompte, J., Brock, W.A., Brovkin, V., Carpenter, S.R., Dakos, V., Held, H., vanNes, E., Rietkerk, M. & Sugihara, G. (2009). Early-warning signals for critical transitions.Nature, 461, pp. 53-59.Schlacher, T.A., DeJager, R., Nielsen, T. (2011). Vegetation <strong>and</strong> ghost crabs in coastal dunes asindicators of putative stressors from tourism. Ecological Indicators, 11(2), pp. 284-294.Schmidt, S., Kemfert, C., & Höppe, P. (2010). The impact of socio-economics <strong>and</strong> climate changeon tropical cyclone losses in the USA. Regional Environmental Change, 10, pp. 13-26.Schoellhamer, D. (2011). Sudden clearing of estuarine waters upon crossing the thresholdfrom transport to supply regulation of sediment transport as an erodible sediment pool isdepleted: San Francisco Bay, 1999. Estuaries <strong>and</strong> Coasts, 34, pp. 885–899.Science Technical Advisory Panel. (2009). Emerging Issues Summaries. North Slope ScienceInitiative, Barrow, Alaska, 87 pp.Scism, L. (2012, Feb. 6). Storm Clouds Gather Over Florida Insurers. The Wall Street Journal, page C1.Screen, J., & Simmonds, I. (2011). Declining summer snowfall in the Arctic: causes, impacts <strong>and</strong>feedbacks. <strong>Climate</strong> Dynamics, 116(D15), pp. 1-14. DOI: 10.1007/s00382-011-1105-2Scully, M.E. (2010). The Importance of <strong>Climate</strong> Variability to Wind-Driven Modulation ofHypoxia in Chesapeake Bay. Journal of Physical Oceanography, 40(6), pp. 1435-1440.Seymour, R.J. (2011). Evidence for changes to the northeast Pacific wave climate. Journal of <strong>Coastal</strong>Research, 27(1), pp. 194-201.SFBCDC (San Francisco Bay Conservation <strong>and</strong> Development Commission).( 2011). Living with aRising Bay. Retrieved from http://www.bcdc.ca.gov/BPA/LivingWithRisingBay.pdf.Shakhova, N & Semiletov, I. (2007). Methane release <strong>and</strong> coastal environment in the East SiberianArctic shelf. Journal of Marine Systems, 66(1–4), pp. 227-243. ISSN 0924-7963, 10.1016/j.jmarsys.2006.06.006.Shakhova, N., Semiletov, I., Salyuk, A., & Kosmach, D. (2008). Anomalies of methane in the atmosphereover the East Siberian shelf: Is there any sign of methane leakage from shallow shelfhydrates? EGU General Assembly, 2008. Geophysical Research Abstracts, 10, EGU2008-A-01526Shaw, J., Taylor, R.B., Solomon, S., Christian, H.A., & Forbes, D.L. (1998). Potential impacts ofglobal sea-level rise on Canadian coasts. The Canadian Geographer, 42(4), pp. 365-379.Shulski, M., Walsh, J., Stevens, E., & Thoman, R. (2010). Diagnosis of Extended Cold-SeasonTemperature Anomalies in Alaska. Monthly Weather Review, 138, pp. 453-462. doi: http://dx.doi.org/10.1175/2009MWR3039.1.Siddall, M., Stocker, T.F., & Clark, P.U. (2009). Constraints on future sea-level rise from past sealevelchange. Nature Geoscience Letters, 2, pp. 571-575.
References 179Slott, J.M., Murray, A.B., Ashton, A.D., & Crowley, T.J. (2006). Coastline responses to changingstorm patterns. Geophysical Research Letters, 33, L18404, doi:10.1029/2006GL027445.Smith, J.M., Cialone, M.A., Wamsley, T.V., & McAlpin, T. (2010). Potential impact of sea level riseon coastal surges in southeast Louisiana. Ocean Engineering, 37(1), pp. 37-47.Smith, S.L., Romanovsky, V.E., Lewkowicz, A.G., Burn, C.R., Allard, M., Clow, G.D., Yoshikawa,K., & Throop, J. (2010). Thermal state of permafrost in North America—A contribution to theinternational polar year. Permafrost Periglacial Processes, 21, pp. 117-135, doi:10.1002/ppp.690.Smits, A.J.M., Nienhuis, P.H., & Saeijs, H.L.F. (2006). Changing Estuaries, Changing Views.Hydrobiologia, 565, pp. 339-355.Snover, A.K., Whitley Binder, L., Lopez, J., Willmott, E., Kay, J., Howell, D., & Simmonds, J.(2007). Preparing for climate change: a guidebook for local, regional, <strong>and</strong> state governments.In association with <strong>and</strong> published by ICLEI – Local Governments for Sustainability,Oakl<strong>and</strong>, CA.Southeast Florida Regional <strong>Climate</strong> Change Compact, Technical Ad hoc Work Group, A UnifiedSea Level Rise Projection for Southeast Florida (April 2011). See also Adams, S. & Gregg, R.M. (2010). Southeast Florida Regional <strong>Climate</strong> Change Compact [Case study on a project of theInstitute for Sustainable Communities]. Product of EcoAdapt’s State of <strong>Adaptation</strong> Program.Retrieved from http://www.cakex.org/case-studies/1469.Staff of the California <strong>Coastal</strong> Commission. (2001). Overview of Sea-Level Rise <strong>and</strong> Some Implicationsfor <strong>Coastal</strong> California. Retrieved from http://www.coastal.ca.gov/climate/SeaLevel-Rise2001.pdf.Stanton, E.A. & Ackerman, F. (2007). Florida <strong>and</strong> <strong>Climate</strong> Change: The Costs of Inaction. GlobalDevelopment <strong>and</strong> Environment Institute, Tufts University <strong>and</strong> Stockholm EnvironmentInstitute–US Center, Tufts University, Medford, MA.State of Oregon. (2010). The Oregon <strong>Climate</strong> Change <strong>Adaptation</strong> Framework. State of Oregon,Portl<strong>and</strong>.Stenek, V., Amado, J.-C., Connell, R., Palin, O., Wright, S., Pope, B., Hunter, J., McGregor, J.,Morgan, W., Stanley, B., Washington, R., Liverman, D., Sherwin, H., Kapelus, P., Andrade,C., Pabon, J.D. (2011). <strong>Climate</strong> Risk <strong>and</strong> Business: Ports. Internaional Finance Corporation,Colombia.Sterl, A. & Caires, S. (2005). Climatology, variability <strong>and</strong> extrema of ocean waves: The web-basedKNMI/ERA-40 Wave Atlas. International Journal. of Climatology, 25, pp. 963-977.Stewart, B. (2011). Changes in frequency of extreme temperature <strong>and</strong> precipitation events inAlaska, Master of Science Thesis: Urbana-Champaign, University of Illinois at Urbana-Champaign, 65 pp.Strauss, B.H., Ziemlinski, R., Weiss, J.L., & Overpeck, J.T. (2012). Tidally-adjusted estimates oftopographic vulnerability to sea level rise <strong>and</strong> flooding for the contiguous United States.Environmental Research Letters (in press).Stroeve, J.C., Serreze, M.C., Holl<strong>and</strong>, M.M., Kay, J.E., Maslanik, J., & Barrett, A.P. (2011). TheArctic’s rapidly shrinking sea ice cover: a research synthesis. Climatic Change, doi 10.1007/s10584-011-0101-1.Swaney, D.P., Humborg, C., Emeis, K., Kannen, A., Silvert, W., Tett, P., Pastres, R., Solidoro, C.,Yamamuro, M., Hénocque, Y., & Nicholls, R. (2012). Five critical questions of scale for thecoastal zone. Estuarine, <strong>Coastal</strong> <strong>and</strong> Shelf Science, 96, pp. 9-21.Sweet W.V. & Zervas, C. (2011). Cool-Season Sea Level Anomalies <strong>and</strong> Storm Surges along theUS East Coast: Climatology <strong>and</strong> Comparison with the 2009/10 El Niño. Monthly WeatherReview, 139, 2290–2299, doi: 10.1175/MWR-D-10-05043.1.
180 <strong>Coastal</strong> <strong>Impacts</strong>, <strong>Adaptation</strong>, <strong>and</strong> <strong>Vulnerabilities</strong>Swinomish Indian Tribal Community, Office of Planning & Community Development. (2010).Swinomish <strong>Climate</strong> Change Initiative <strong>Climate</strong> Change <strong>Adaptation</strong> Action Plan. Retrieved fromhttp://www.swinomish-nsn.gov/climate_change/Docs/SITC_CC_<strong>Adaptation</strong>ActionPlan_complete.pdf.Swiss Re. (2010). Weathering <strong>Climate</strong> Change: Insurance Solutions for More Resilient Communitie.Retrieved from http://media.swissre.com/documents/pub_climate_adaption_en.pdf.Syed, T.H., Famiglietti, J.S., Chambers, D.P., Willis, J.K., <strong>and</strong> Hilburn, K. (2010). Satellite-basedglobal-ocean mass balance estimates of interannual variability <strong>and</strong> emerging trends in continentalfreshwater discharge. Proceedings of the National Academy of Sciences, v. doi:10.1073/pnas.1003292107.Syvitski, J.P.M., Kettner, A.J., Overeem, I., Hutton, E.W.H., Hannon, M.T., Brakenridge, G.R.,Day, J., Vorosmarty, C., Saito, Y., Giosan, L., Nicholls, R.J. (2009). Sinking deltas due tohuman activities. Nature Geoscience, 2(10), pp. 681-686.Tang, Z., Brody, S.D., Li, R., Quinn, C., & Zhao, N. (2011). Examining locally driven climatechange policy efforts in three Pacific States. Ocean & <strong>Coastal</strong> Management, 54, pp. 415-426.Tanski, J.J. (2010). New York. In: The Likelihood of Shore Protection along the Atlantic Coast of theUnited States. Volume 1: Mid-Atlantic. Report by New York SeaGrant to the U.S. EnvironmentalProtection Agency. Washington, D.C. pp. 165-259.Tebaldi, C., Hayhoe, K., Arblaster, J.M., & Meehl, G.A. (2006). Going to the extremes: An intercomparisonof model-simulated historical <strong>and</strong> future changes in extreme events. ClimaticChange, 79(3-4), pp. 185-211.Thibault, K.M. & Brown, J.H. (2008). Impact of an extreme climatic event on communityassembly. PNAS, 105(9), 3410-3415.Thieler, E.R. & Hammar-Klose, E.S. (1999). National assessment of coastal vulnerability to sealevelrise: Preliminary results for the U.S. Atlantic coast. U.S. Geological Survey Open-FileReport 99-593, 1 map sheet. Retrieved from http://pubs.usgs.gov/of/of99-593/.Thieler, E.R. & Hammar-Klose, E.S. (2000a). National assessment of coastal vulnerability to sealevelrise: Preliminary results for the U.S. Pacific Coast. U.S. Geological Survey Open-FileReport 00-178, 1 map sheet. Retrieved from http://pubs.usgs.gov/of/of00-178/.Thieler, E.R. & Hammar-Klose, E.S. (2000b). National assessment of coastal vulnerability tosea-level rise: Preliminary results for the U.S. Gulf of Mexico Coast. U.S. Geological SurveyOpen-File Report 00-179, 1 map sheet. Retrieved from http://pubs.usgs.gov/of/of00-179/.Tirpak, S.M. (2009). United States Army Corps of Engineers, Galveston District operational experiences<strong>and</strong> response to Hurricane Ike. Journal of the Amer can Shore & Beach Preservation Association, 77(2).Titus, J.G. & Greene, M.S. (1989). An overview of studies estimating the nationwide cost ofholding back the sea. In Potential Effects of <strong>Climate</strong> Change on the United States: AppendixB, Sea Level Rise. Environmental Protection Agency, Washington, DC.Titus, J.G. & Hudgens, D. (2010). The Likelihood of Shore Protection along the Atlantic Coastof the United States, Volume 1: Mid-Atlantic. Report to the U.S. Environmental ProtectionAgency, Washington, DC. 1260 pp.Titus, J.G. & Richman, C. (2001). Maps of l<strong>and</strong>s vulnerable to sea level rise: Modeled elevationsalong the U.S. Atlantic <strong>and</strong> Gulf coasts. <strong>Climate</strong> Research 18, pp. 205-228.Titus, J.G. & Wang, J. (2008). Maps of L<strong>and</strong>s Close to Sea Level along the Middle Atlantic Coastof the United States: An Elevation Data Set to Use While Waiting for LIDAR. Section 1.1 in:Background Documents Supporting <strong>Climate</strong> Change Science Program Synthesis <strong>and</strong> AssessmentProduct 4.1, J.G. Titus <strong>and</strong> E.M. Strange (Eds.). EPA 430R07004. U.S. Environmental ProtectionAgency, Washington, DC, pp. 1-42.
References 181Titus, J.G. (1998). Rising Seas, <strong>Coastal</strong> Erosion, <strong>and</strong> the Takings Clause: How to Save Wetl<strong>and</strong>s<strong>and</strong> Beaches Without Hurting Property Owners. Maryl<strong>and</strong> Law Review, 56(4), pp.1279-1399.Titus, J.G. (2011). Rolling Easements. U.S. Environmental Protection Agency, Washington, DC,166 pp.Titus, J.G. (Ed.). (1985). Potential impacts of sea level rise on the beach at Ocean City, MD. U.S.Environmental Protection Agency, Washington DC. EPA-230-10-85-013, 175 pp.Titus, J.G., Hudgens, D.E., Trescott, D.L., Craghan, M., Nuckols, W.H., Hershner, C.H., Kassakian,J.M., Linn, C.J., Merritt, P.G., McCue, T.M., O’Connell, J.F., Tanski, J., & Wang, J. (2009).State <strong>and</strong> local governments plan for development of most l<strong>and</strong> vulnerable to rising sea levelalong the US Atlantic coast. Environmental Research Letters, 4 044008.Titus, J.G., Park, R.A., Leatherman, S., Weggel, R., Greene, M.S., Treehan, M., Brown, S. Gaunt,C., & Yohe, G. (1991). Greenhouse Effect <strong>and</strong> Sea Level Rise: The Cost of Holding Back theSea. <strong>Coastal</strong> Management, 19 (3), pp. 171-204.Toggweiller, J.R. & Russell, J. (2008). Ocean Circulation in a warming climate. Nature, 451(17),doi:10.1038/nature06500.Trenberth, K.E. (1999). Conceptual framework for changes of extremes of the hydrological cyclewith climate change. Climatic Change, 42, pp. 327-339.Trenberth, K.E. (2011). Changes in precipitation with climate change. <strong>Climate</strong> Research, 47, pp. 123-138.Turner, J.W, Good, B., Cole, D., & Lipp, E.K. (2009). Plankton composition <strong>and</strong> environmentalfactors contribute to Vibrio seasonality. The ISME Journal 3(9), pp. 1082-92.U.S. Commission on Ocean Policy. (2004). An Ocean Blueprint for the 21st Century: Final Reportof the U.S. Commission on Ocean Policy. Retrieved from http://www.oceancommission.gov/U.S. Congress. (2011). Flood Insurance Reform Act of 2011, H.R. 1309, 112th Cong.U.S. International Trade Commission. (2008). Property <strong>and</strong> Casualty Insurance Services: CompetitiveConditions in Foreign Markets, Investigation No. 332-499, USITC Pub. 4068.U.S. Travel Association. (2009). U.S. Travel Forecasts. Retrieved from http://www.ustravel.org/sites/default/files/page/2009/09/ForecastSummary.pdf (last updated November 1, 2011).UNESCO (United Nations Educational, Scientific, <strong>and</strong> Cultural Organization). (2008). PolicyDocument on the <strong>Impacts</strong> of <strong>Climate</strong> Change on World Heritage Properties, 14pp.United Nations World Tourism Organization. (2008). Discussion Paper on <strong>Climate</strong> Change MitigationMeasures for International Air Transport Tourism – Responding to Global Challenges.United Nations World Tourism Organization. (2009). From Davos to Copenhagen <strong>and</strong> Beyond:Advancing Tourism’s Response to <strong>Climate</strong> Change, UNWTO Background Paper.University of Maryl<strong>and</strong>. (2007). Center for Integrative Environmental Research. The U.S.Economic <strong>Impacts</strong> of <strong>Climate</strong> Change <strong>and</strong> the Costs of Inaction. 48 pp. Retrieved fromhttp://www.cier.umd.edu/documents/US%20Economic%20<strong>Impacts</strong>%20of%20<strong>Climate</strong>%20Change%20<strong>and</strong>%20the%20Costs%20of%20Inaction.pdf.USACE (U.S. Army Corps of Engineers). (2011). Incorporating Sea-Level Change Considerationsin Civil Works Programs. Engineering Circular 1165-2-212. Retrieved from http://planning.usace.army.mil/toolbox/library/ECs/EC11652212Nov2011.pdf.USDA (U.S. Department of Agriculture). (2010). <strong>Climate</strong> Change <strong>Impacts</strong> on Crop Insurance.Report completed by USDA Risk Management Agency. Retrieved from http://www.rma.usda.gov/pubs/index.html#climateUSGCRP (U.S. Global Change Research Program). (2009). Global <strong>Climate</strong> Change <strong>Impacts</strong> inthe United States. U.S. Global Change Research Program. T.R. Karl, J.M. Melillo <strong>and</strong> T.C.Peterson (Eds.), Cambridge University Press, 189 pp.
182 <strong>Coastal</strong> <strong>Impacts</strong>, <strong>Adaptation</strong>, <strong>and</strong> <strong>Vulnerabilities</strong>USGCRP (U.S. Global Change Research Program). (2011). NCA Report Series, Volume 9: Uses ofVulnerability Assessments for the National <strong>Climate</strong> Assessment. Washington, U.S. GlobalChange Research Program, 36 pp.Valsson T. & Ulfarsson, G.F. (2011). Future changes in activity structures of the globe under areceding Arctic ice scenario. Futures, 43(4), pp. 450-459.Van den Broeke, M., Bamber, J., Lanaerts, J., & Rignot, E. (2011). Ice Sheets <strong>and</strong> Sea Level:Thinking Outside the Box. Surveys in Geophysics, doi 10.1007/s10712-011-9137-Z.Van Dolah, F.M. (2000). Marine Algal Toxins: Origins, Health Effects, <strong>and</strong> Their Increased Occurrence.Environmental Health Perspectives, 108(Suppl 1), pp. 133-141.van Klooster, S.L. & Roebber, P.J. (2009). Surface-Based Convective Potential in the ContiguousUnited States in a Business-as-Usual Future <strong>Climate</strong>. Journal of <strong>Climate</strong>, 22, pp. 3317-3330.Vaquer-Sunyer, R. & Duarte, C.M. (2011). Temperature effects on oxygen thresholds forhypoxia in marine benthic organisms. Global Change Biology, 17, pp. 1788–1797. doi:10.1111/j.1365-2486.2010.02343.x.Vecchi, G.A. & Knutson, T.R. (2011). Estimating annual numbers of Atlantic hurricanes missingfrom the HURDAT database (1878-1965) using ship track density. Journal of <strong>Climate</strong>, 24(6),doi:10.1175/2010JCLI3810.1.Veloz, S., Nur, N., Salas, L., Stralberg, D., Jongsomjit, D., Wood, J., Liu, L., & Ballard, G. (2011).Tidal marsh bird population <strong>and</strong> habitat assessment for the San Francisco Estuary underfuture climate change conditions. Report to the California L<strong>and</strong>scape ConservationCooperative.Vermeer M. & Rahmstorf, S. (2009). Global sea level linked to global temperature. Proceedings ofthe National Academies of Science, 106, pp. 21527–21532.Vermeer, M. & Rahmstorf, S. (2009). Global sea level linked to global temperature. Proceedings ofthe National Academy of Sciences, doi/10/1073/pnas.0907765106.Vermeer, M. & Rahmstorf, S. (2009): Global sea level linked to global temperature. Proceedings ofthe National Academy of Sciences, 106(51), pp. 21527-21532.Villarini, G., Vecchi, G.A., Knutson, T.R., Zhao, M., & Smith, J.A. (2011). North Atlantic tropicalstorm frequency response to anthropogenic forcing: Projections <strong>and</strong> sources of uncertainty.Journal of <strong>Climate</strong>, 24(13), doi:10.1175/2011JCLI3853.1.Waldbusser, G.G., Voigt, E.P., Bergschneider, H., Green, M.A., & Newell, R.I.E. (2011). Biocalcificationin the Eastern Oyster (Crassostrea virginica) in Relation to Long-term Trends inChesapeake Bay pH. Estuaries <strong>and</strong> Coasts, 34(2), pp. 221-231.Wamsley, T.V., Cialone, M.A., Smith, J.M., Atkinson, J.H., & Rosati, J.D. (2010). The potential ofwetl<strong>and</strong>s in reducing storm surge. Ocean Engineering, 37(1), pp. 59-68.Wamsley, T.V., Cialone, M.A., Smith, J.M., Ebersole, B.A. (2009). Influence of l<strong>and</strong>scape restoration<strong>and</strong> degradation on storm surge <strong>and</strong> waves in southern Louisiana. Journal of NaturalHazards, 51 (1), pp. 207-224.Wang, C, Liu, H., Lee, S.-K., & Atlas, R. (2011). Impact of the Atlantic warm pool on United Statesl<strong>and</strong>falling hurricanes. Geophysical Research Letters, 38, L19702, doi: 10.1029/2011GL04.Wang, M., Overl<strong>and</strong>, J.E. (2009). A sea ice free summer Arctic within 30 years? GeophysicalResearch Letters, 36, L07502, doi:10.1029/2009GL037820.Wang, X.L. & Swail, V.R. (2006). <strong>Climate</strong> change signal <strong>and</strong> uncertainty in projections of oceanwave heights. <strong>Climate</strong> Dynamics, 26, pp. 109-126.Wang, X.L., Zwiers, F.W., & Swail, V.R. (2004). North Atlantic ocean wave climate changescenarios for the twenty-first century. Journal of <strong>Climate</strong>, 17, pp. 2368-2383.
References 183Washington Department of Ecology. (2006). <strong>Impacts</strong> of <strong>Climate</strong> Change on Washington’sEconomy: A Preliminary Assessment of Risks <strong>and</strong> Opportunities. Ecology publication 07-01-010. 118 pp. Retrieved from http://www.ecy.wa.gov/pubs/0701010.pdf.Webster, P.J., Holl<strong>and</strong>, G.J., Curry, J.A., & Chang, H.R. (2005). Changes in tropical cyclonenumber, duration, <strong>and</strong> intensity in a warming environment. Science, 309, pp. 1844-1846.Weeks, D., Malone, P, & Welling, L. (2011). <strong>Climate</strong> change scenario planning: A tool formanaging parks into uncertain futures. Park Science, 28 (1).Weiss, J., Overpeck, J., & Strauss, B. (2011). Implications of Recent Sea Level Rise Science for Low-Elevation Areas in <strong>Coastal</strong> Cities of the Conterminous U.S.A. Climatic Change, doi 10.1007/s10584-011-0024-x.Wendler, G. & Shulski, M. (2009). A Century of <strong>Climate</strong> Change for Fairbanks, Alaska. Arctic,62(3), pp. 295-300.Wendler, G., Shulski, M., & Moore, B. (2010). Changes in the climate of the Alaskan North Slope<strong>and</strong> the ice concentration of the adjacent Beaufort Sea. Theoretical <strong>and</strong> Applied Climatology, 99,pp. 67-74.Wentz, F.J., Ricciardulli, L., Hilburn, K., & Mears, C. (2007). How Much More Rain Will GlobalWarming Bring? Science, 317(5835), pp. 233-235.West, J.M., Julius, S.H., Kareiva, P., Enquist, C., Lawler, J.J., Petersen, B., Johnson, A.E., & Shaw,M.R. (2009). U.S. natural resources <strong>and</strong> climate change: Concepts <strong>and</strong> approaches formanagement adaptation. Environmental Management, 44, pp. 1001–1021.Westerink, J.J., Luettich, R.A., Baptista, A.M., Scheffner, N.W., Farrar, P. (1992). Tide <strong>and</strong> stormsurge predictions using finite element model. Journal of Hydraulic Engineering, 118(10), pp.1373-1390.Westerink, J.J., Luettich, R.A., Feyen, J.C., Atkinson, J.H., Dawson, C., Roberts, H.J., Powell, M.D.,Dunion, J.P., Kubatko, E.J., & Pourtaheri, H. (2007). A basin to channel scale unstructuredgrid hurricane storm surge model applied to Southern Louisiana. Monthly Weather Review,136(3), pp. 833-864.Wetherl<strong>and</strong>, R.T., Stouffer, R.J., & Dixon, K.W. (2001). Committed warming <strong>and</strong> itsimplications for climate change. Geophysical Research Letters, 28(8), pp. 1535-1538,doi:10.1029/2000GL011786.White House Council on Environmental Quality. (2011). Federal Actions for a <strong>Climate</strong> ResilientNation: Progress Report of the Interagency <strong>Climate</strong> Change <strong>Adaptation</strong> Task Force.Retrieved from http://www.whitehouse.gov/sites/default/files/microsites/ceq/2011_adaptation_progress_report.pdf.Whitehead, J.C. (2000). One Million Dollars A Mile? The Opportunity Costs of Hurricane Evacuation.White paper published by East Carolina University, Department of Economics for theNorth Carolina Division of Emergency Management. Retrieved from http://www.ecu.edu/cs-educ/econ/upload/ecu0005.pdfWhitehead, P.G., Wilby, R.L., Battarbee, R.W., Kernan, M., & Wade, A.J. (2009). A review of thepotential impacts of climate change on surface water quality. Hydrological Sciences Journal-Journal Des Sciences Hydrologiques, 54(1), pp. 101-123.Williams, K., Ewell, K.C., Stumpf, R.P., Putz, F.E. & Workman, T.W. (1999). Sea level rise <strong>and</strong>coastal forest retreat on the western coast of Florida, USA. Ecology, 80, pp. 2045-2063.Williams, K., MacDonald, M., McPherson, K., Mirti, T.H. (2007). Ecology of the coastal edge ofhydric hammocks on the Gulf Coast of Florida. In: Conner, W.H., Doyle, T.W. <strong>and</strong> Krauss,K.W. (Eds.). Ecology of tidal freshwater forested wetl<strong>and</strong>s of the Southeastern United States:The Netherl<strong>and</strong>s, Springer, pp. 255-289.
184 <strong>Coastal</strong> <strong>Impacts</strong>, <strong>Adaptation</strong>, <strong>and</strong> <strong>Vulnerabilities</strong>Williams, M.R., Filoso, S., Longstaff, B.J., & Dennison, W.C. (2010). Long-Term Trends of WaterQuality <strong>and</strong> Biotic Metrics in Chesapeake Bay: 1986 to 2008. Estuaries <strong>and</strong> Coasts. 33(6), pp.1279-1299.Williams, S.J. & Gutierrez, B.T. (2009). Sea-level Rise <strong>and</strong> <strong>Coastal</strong> Change: Causes <strong>and</strong> Implicationsfor the Future of Coasts <strong>and</strong> Low-Lying Regions. Shore <strong>and</strong> Beach, 77(4), pp. 13-21.Williams, S.J., Gutierrez, B.T., Titus, J.G., Gill, S.K., Cahoon, D.R., Thieler, E.R., Anderson, K.E.,FitzGerald, D., Burkett, V., & Samenow, J. (2009). Sea-level rise <strong>and</strong> its effects on the coast.In: <strong>Coastal</strong> Sensitivity to Sea-Level Rise: A Focus on the Mid-Atlantic Region. A report by theU.S. <strong>Climate</strong> Change Science Program <strong>and</strong> the Subcommittee on Global Change Research.[J.G. Titus (coordinating lead author), K.E. Anderson, D.R. Cahoon, D.B. Gesch, S.K. Gill,B.T. Gutierrez, E.R. Thieler, <strong>and</strong> S.J. Williams (lead authors)]. U.S. Environmental ProtectionAgency, Washington DC, pp. 11-24.Willis, J.K., Chambers, D.P., & Nerem, R.S. (2008). Assessing the globally averaged sea levelbudget on seasonal to interannual timescales. Journal of Geophysical Research, 113, C06015,doi:10.1029/2007JC004517.Woltemade, C.J. (2010). Impact of Residential Soil Disturbance on Infiltration Rate <strong>and</strong> StormwaterRunoff. Journal of the American Water Resources Association, 46(4), pp. 700-711.Woodworth, P.L., White, N.L., Jevrejeva, S., Holgate, S.J., Church, J.A., & Gehrels, W.R. (2008).Review: Evidence for the acceleration of sea level on multi-decade <strong>and</strong> century time scales.International Journal of Climatology, published online in Wiley InterScience, 13 pp.World Travel <strong>and</strong> Tourism Council. (2010). <strong>Climate</strong> Change: A Joint Approach to Addressing theChallenge. Retrieved from http://www.wttc.org/site_media/uploads/downloads/climate_change_-_a_joint_appro.pdf.Wu, L., Cai, W., Zhang, L., Nakamura, H., Timmermann, A., Joyce, T., McPhaden, M.J., Alex<strong>and</strong>er,M., Qiu, B., Visbeck, M., Chang, P., & Giese, B. (2012). Enhanced warming over the globalsubtropical western boundary currents. Nature <strong>Climate</strong> Change, doi: 10.1038/NCLIMATE1353.Wyatt M., Sergey K., & Anastasios T. (2011). Atlantic Multidecadal Oscillation <strong>and</strong> NorthernHemisphere’s climate variability. <strong>Climate</strong> Dynamics. Retrieved from https://pantherfile.uwm.edu/kravtsov/www/downloads/WKT_poster.pdf.Wyatt M., Sergey K., & Anastasios T. (2011). Atlantic Multidecadal Oscillation <strong>and</strong> NorthernHemisphere’s climate variability. <strong>Climate</strong> Dynamics. Published Online April 12, 2011.Yang, J.-L., Zhang, G.-L. (2011). Water infiltration in urban soils <strong>and</strong> its effects on the quantity<strong>and</strong> quality of runoff. Journal of Soils <strong>and</strong> Sediments, 11(5), pp. 751-761.Yates, D., Galbraith, H., Purkey, D., Huber-Lee, A., Sieber, J., West, J., Herrod-Julius, S., & Joyce,B. (2008). <strong>Climate</strong> warming, water storage, <strong>and</strong> Chinook salmon in California’s SacramentoValley. <strong>Climate</strong> Change, 91(3-4), pp. 335-350.Yin, J., Griffies, S.M., & Stouffer, R.J. (2011). Spatial variability of sea-level rise in 21st centuryprojections. Journal of <strong>Climate</strong>, 23, pp. 4585-4607.Yin, J., Schlesinger, M.E., & Stouffer, R.J. (2009). Model projections of rapid sea-level rise on thenortheast coast of the United States. Nature Geoscience, doi: 10.1038/NGEO462.Yin, J.H. (2005). A consistent poleward shift of the storm tracks in simulations of 21st centuryclimate. Geophysical Research Letters, 32, L18701.Young, I.R., Ziegler, S., & Babanin, A.V. (2011). Global trends in wind speed <strong>and</strong> wave height.Science, 332, pp. 451–455.Zervas, C. (2009). Sea Level Variations of the United States 1854-2006. NOAA Technical ReportNOS CO-OPS 053 <strong>and</strong> updates. Retrieved from http://tides<strong>and</strong>currents.noaa.gov/publications/Tech_rpt_53.pdf.
Zurich Financial Services. (2009). The <strong>Climate</strong> Risk Challenge: The Role of Insurance In Pricing<strong>Climate</strong>-Related Risks. Retrieved from http://www.zurich.com/internet/main/SiteCollection-Documents/insight/<strong>Climate</strong>RiskChallenge.pdfReferences 185
<strong>Coastal</strong> <strong>Impacts</strong>, <strong>Adaptation</strong>, <strong>and</strong> <strong>Vulnerabilities</strong>, one of a series of technicalinputs for the third national <strong>Climate</strong> Assessment (NCA) conducted underthe auspices of the U.S. Global Change Research Program, examines theknown effects <strong>and</strong> relationships of climate change variables on the coasts ofthe U.S. It describes the impacts on natural <strong>and</strong> human systems, includingseveral major sectors of the U.S. economy, <strong>and</strong> the progress <strong>and</strong> challengesto planning <strong>and</strong> implementing adaptation options.Cover photos: Courtesy of National Oceanic <strong>and</strong> Atmospheric AdministrationCover design: Maureen GatelyWashington | Covelo | Londonwww.isl<strong>and</strong>press.orgAll Isl<strong>and</strong> Press books are printed on recycled, acid-free paper.