digital image processing using matlab
digital image processing using matlab
digital image processing using matlab
- No tags were found...

Create successful ePaper yourself
Turn your PDF publications into a flip-book with our unique Google optimized e-Paper software.
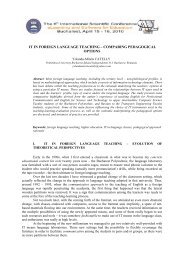
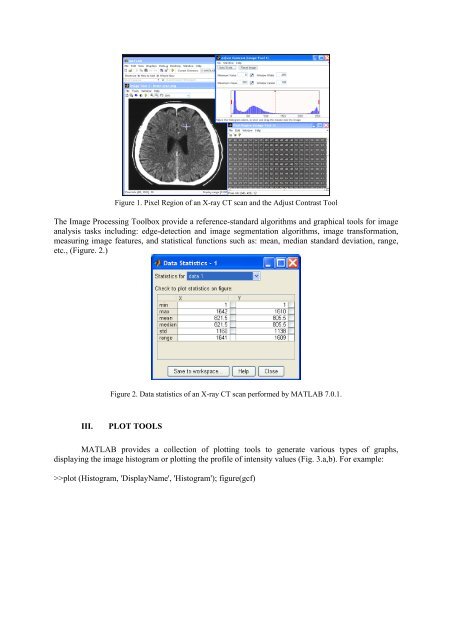
Figure 1. Pixel Region of an X-ray CT scan and the Adjust Contrast ToolThe Image Processing Toolbox provide a reference-standard algorithms and graphical tools for <strong>image</strong>analysis tasks including: edge-detection and <strong>image</strong> segmentation algorithms, <strong>image</strong> transformation,measuring <strong>image</strong> features, and statistical functions such as: mean, median standard deviation, range,etc., (Figure. 2.)Figure 2. Data statistics of an X-ray CT scan performed by MATLAB 7.0.1.III.PLOT TOOLSMATLAB provides a collection of plotting tools to generate various types of graphs,displaying the <strong>image</strong> histogram or plotting the profile of intensity values (Fig. 3.a,b). For example:>>plot (Histogram, 'DisplayName', 'Histogram'); figure(gcf)