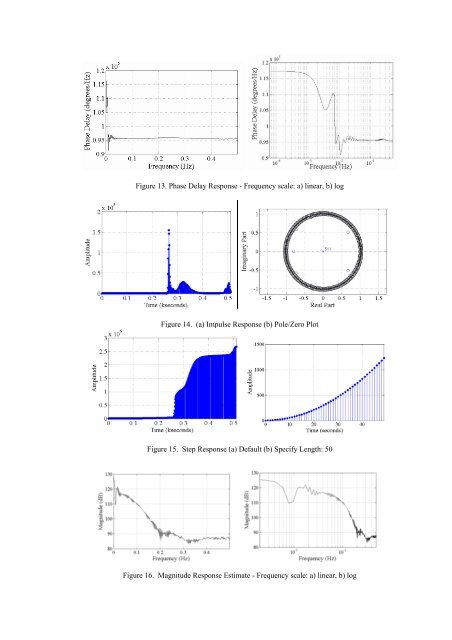
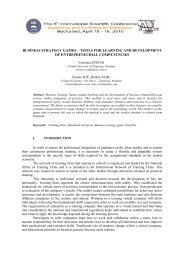
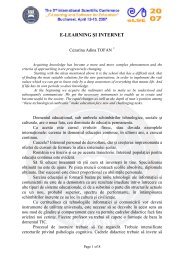
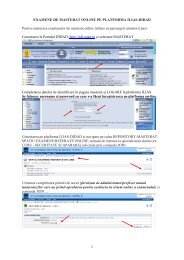
Figure 13. Phase Delay Response - Frequency scale: a) linear, b) logFigure 14. (a) Impulse Response (b) Pole/Zero PlotFigure 15. Step Response (a) Default (b) Specify Length: 50Figure 16. Magnitude Response Estimate- Frequency scale: a) linear, b) log
Figure 17. Magnitude Response and Round-off Noise Power Spectrum- Frequency scale: a) linear, b) logV. CONCLUDING REMARKSMATLAB provide functions and interactive tools for enhancing and analyzing <strong>digital</strong> <strong>image</strong>sand developing <strong>image</strong> <strong>processing</strong> algorithms. MATLAB visualization tools let us to represent theinformation contained in the X-ray CT <strong>image</strong> data through histograms, contour plots, pixel regions,transparent overlays, and <strong>image</strong>s texture-mapped onto surfaces.The Signal Processing Toolbox (SPTool) provides a suite of interactive graphical userinterfaces for: Signal plotting and analysis, spectral analysis and filter visualization: signal plotting andanalysis, spectral analysis and filtering signals.BIBLIOGRAPHY[1] E.G. Bistriceanu - Principiile Matematematice şi Fizice ale Tomografiei Computerizate,Matrix ROM, Bucureşti, 1996.[2] B. Hahn. D.T. Valentine – Essential MATLAB for Engineers and Scientists, Elsevier (Thirdedition), 2007.[3] Webb, S.- The Physics of Medical Imaging, Institute of Physics Publishing, London.[4] ImageJ – 1.37[5] MATLAB 7.0.1. – The Language of Technical Computing, The MathWorks, Inc., 2005.∗ PhD - University of Bucharest, Faculty of Physics, Bucharest, Romania , E-mail: seletchi@gmail.com