PRIVATISATION â WHAT'S NEXT 13 May 2013 - CASE
PRIVATISATION â WHAT'S NEXT 13 May 2013 - CASE
PRIVATISATION â WHAT'S NEXT 13 May 2013 - CASE

Create successful ePaper yourself
Turn your PDF publications into a flip-book with our unique Google optimized e-Paper software.
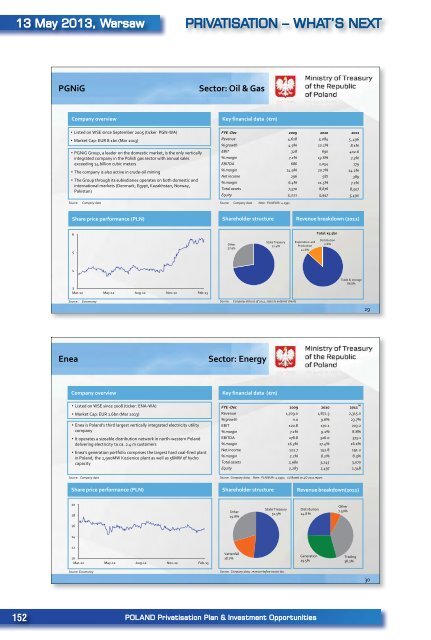
<strong>13</strong> <strong>May</strong> 20<strong>13</strong>, Warsaw<strong>PRIVATISATION</strong> – WHAT’S <strong>NEXT</strong>PGNiGSector: Oil & GasCompany overviewKey financial data (€m)• Listed on WSE since September 2005 (ticker PGN-WA)• Market Cap: EUR 8.1bn (Mar 20<strong>13</strong>)• PGNiG Group, a leader on the domestic market, is the only verticallyintegrated company in the Polish gas sector with annual salesexceeding 14 billion cubic meters• The company is also active in crude-oil mining• The Group through its subisdiaries operates on both domestic andinternational markets (Denmark, Egypt, Kazakhstan, Norway,Pakistan)FYE -Dec 2009 2010 2011Revenue 4,618 5,084 5 ,496% growth 4.9% 10.1% 8.1%EBIT 328 690 402.6% margin 7.1% <strong>13</strong>.6% 7.3%EBITDA 686 1,054 779% margin 14.9% 20.7% 14.2%Net income 296 587 389% margin 6.4% 11.5% 7.1%Total assets 7,570 8,676 8,507Equity 5,221 5,947 5,490Source:Company dataSource: Company data Note: PLN/EUR= 4.1991Share price performance (PLN)Shareholder structureRevenue breakdown (2011)6Total: €5.5bn527.6%State Treasury72.4%Exploration andProduction12.6%Distribution0.6%43Mar-12 <strong>May</strong>-12 Aug-12 Nov-12 Feb-<strong>13</strong>Trade & storage86.8%Source:EuromoneySource:Company data as of 2011, sales to external clients29EneaSector: EnergyCompany overview• Listed on WSE since 2008 (ticker: ENA-WA)• Market Cap: EUR 1.6bn (Mar 20<strong>13</strong>)• Enea is Poland’s third largest vertically integrated electricity utilitycompany• It operates a sizeable distribution network in north-western Polanddelivering electricity to ca. 2.4 m customers• Enea’s generation portfolio comprises the largest hard coal-fired plantin Poland, the 2,900MW Kozienice plant as well as 56MW of hydrocapacitySource: Company dataKey financial data (€m)FYE -Dec 2009 2010 2011 (1)Revenue 1,709.0 1,872.3 2,315.0% growth n.a 9.6% 23.7%EBIT 120.8 170.1 203.2% margin 7.1% 9.1% 8.8%EBITDA 278.8 326.0 373.1% margin 16.3% 17.4% 16.1%Net income 122.7 152.8 191.2% margin 7.2% 8.2% 8.3%Total assets 2,980 3,245 3,070Equity 2,283 2,497 2,348Source: Company data; Note: PLN/EUR= 4.1991; (1) Based on 4Q 2011 report.Share price performance (PLN)Shareholder structureRevenue breakdown(2011)2018Other29.8%State Treasury51.5%Distribution24.8 %Other7.50%16141210Mar-12 <strong>May</strong>-12 Aug-12 Nov-12 Feb-<strong>13</strong>Vattenfall18.7%Generation29.5%Trading38.2%Source: EuromoneySource: Company data; revenue before excise tax.30152 POLAND Privatisation Plan & Investment Opportunities