Strain Compatibility and Geogrid Stiffness Selection in ... - Harpo spa
Strain Compatibility and Geogrid Stiffness Selection in ... - Harpo spa
Strain Compatibility and Geogrid Stiffness Selection in ... - Harpo spa

Create successful ePaper yourself
Turn your PDF publications into a flip-book with our unique Google optimized e-Paper software.
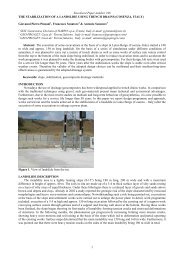
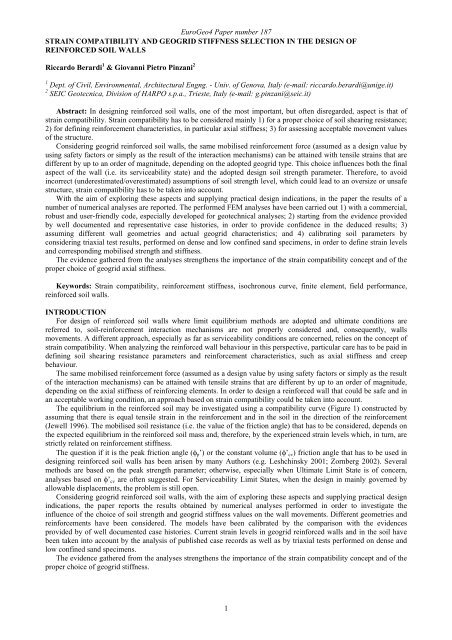
EuroGeo4 Paper number 187STRAIN COMPATIBILITY AND GEOGRID STIFFNESS SELECTION IN THE DESIGN OFREINFORCED SOIL WALLSRiccardo Berardi 1 & Giovanni Pietro P<strong>in</strong>zani 21 Dept. of Civil, Environmental, Architectural Engng. - Univ. of Genova, Italy (e-mail: riccardo.berardi@unige.it)2 SEIC Geotecnica, Division of HARPO s.p.a., Trieste, Italy (e-mail: g.p<strong>in</strong>zani@seic.it)Abstract: In design<strong>in</strong>g re<strong>in</strong>forced soil walls, one of the most important, but often disregarded, aspect is that ofstra<strong>in</strong> compatibility. <strong>Stra<strong>in</strong></strong> compatibility has to be considered ma<strong>in</strong>ly 1) for a proper choice of soil shear<strong>in</strong>g resistance;2) for def<strong>in</strong><strong>in</strong>g re<strong>in</strong>forcement characteristics, <strong>in</strong> particular axial stiffness; 3) for assess<strong>in</strong>g acceptable movement valuesof the structure.Consider<strong>in</strong>g geogrid re<strong>in</strong>forced soil walls, the same mobilised re<strong>in</strong>forcement force (assumed as a design value byus<strong>in</strong>g safety factors or simply as the result of the <strong>in</strong>teraction mechanisms) can be atta<strong>in</strong>ed with tensile stra<strong>in</strong>s that aredifferent by up to an order of magnitude, depend<strong>in</strong>g on the adopted geogrid type. This choice <strong>in</strong>fluences both the f<strong>in</strong>alaspect of the wall (i.e. its serviceability state) <strong>and</strong> the adopted design soil strength parameter. Therefore, to avoid<strong>in</strong>correct (underestimated/overestimated) assumptions of soil strength level, which could lead to an oversize or unsafestructure, stra<strong>in</strong> compatibility has to be taken <strong>in</strong>to account.With the aim of explor<strong>in</strong>g these aspects <strong>and</strong> supply<strong>in</strong>g practical design <strong>in</strong>dications, <strong>in</strong> the paper the results of anumber of numerical analyses are reported. The performed FEM analyses have been carried out 1) with a commercial,robust <strong>and</strong> user-friendly code, especially developed for geotechnical analyses; 2) start<strong>in</strong>g from the evidence providedby well documented <strong>and</strong> representative case histories, <strong>in</strong> order to provide confidence <strong>in</strong> the deduced results; 3)assum<strong>in</strong>g different wall geometries <strong>and</strong> actual geogrid characteristics; <strong>and</strong> 4) calibrat<strong>in</strong>g soil parameters byconsider<strong>in</strong>g triaxial test results, performed on dense <strong>and</strong> low conf<strong>in</strong>ed s<strong>and</strong> specimens, <strong>in</strong> order to def<strong>in</strong>e stra<strong>in</strong> levels<strong>and</strong> correspond<strong>in</strong>g mobilised strength <strong>and</strong> stiffness.The evidence gathered from the analyses strengthens the importance of the stra<strong>in</strong> compatibility concept <strong>and</strong> of theproper choice of geogrid axial stiffness.Keywords: <strong>Stra<strong>in</strong></strong> compatibility, re<strong>in</strong>forcement stiffness, isochronous curve, f<strong>in</strong>ite element, field performance,re<strong>in</strong>forced soil walls.INTRODUCTIONFor design of re<strong>in</strong>forced soil walls where limit equilibrium methods are adopted <strong>and</strong> ultimate conditions arereferred to, soil-re<strong>in</strong>forcement <strong>in</strong>teraction mechanisms are not properly considered <strong>and</strong>, consequently, wallsmovements. A different approach, especially as far as serviceability conditions are concerned, relies on the concept ofstra<strong>in</strong> compatibility. When analyz<strong>in</strong>g the re<strong>in</strong>forced wall behaviour <strong>in</strong> this perspective, particular care has to be paid <strong>in</strong>def<strong>in</strong><strong>in</strong>g soil shear<strong>in</strong>g resistance parameters <strong>and</strong> re<strong>in</strong>forcement characteristics, such as axial stiffness <strong>and</strong> creepbehaviour.The same mobilised re<strong>in</strong>forcement force (assumed as a design value by us<strong>in</strong>g safety factors or simply as the resultof the <strong>in</strong>teraction mechanisms) can be atta<strong>in</strong>ed with tensile stra<strong>in</strong>s that are different by up to an order of magnitude,depend<strong>in</strong>g on the axial stiffness of re<strong>in</strong>forc<strong>in</strong>g elements. In order to design a re<strong>in</strong>forced wall that could be safe <strong>and</strong> <strong>in</strong>an acceptable work<strong>in</strong>g condition, an approach based on stra<strong>in</strong> compatibility could be taken <strong>in</strong>to account.The equilibrium <strong>in</strong> the re<strong>in</strong>forced soil may be <strong>in</strong>vestigated us<strong>in</strong>g a compatibility curve (Figure 1) constructed byassum<strong>in</strong>g that there is equal tensile stra<strong>in</strong> <strong>in</strong> the re<strong>in</strong>forcement <strong>and</strong> <strong>in</strong> the soil <strong>in</strong> the direction of the re<strong>in</strong>forcement(Jewell 1996). The mobilised soil resistance (i.e. the value of the friction angle) that has to be considered, depends onthe expected equilibrium <strong>in</strong> the re<strong>in</strong>forced soil mass <strong>and</strong>, therefore, by the experienced stra<strong>in</strong> levels which, <strong>in</strong> turn, arestrictly related on re<strong>in</strong>forcement stiffness.The question if it is the peak friction angle (φ p ’) or the constant volume (φ’ cv ) friction angle that has to be used <strong>in</strong>design<strong>in</strong>g re<strong>in</strong>forced soil walls has been arisen by many Authors (e.g. Leshch<strong>in</strong>sky 2001; Zornberg 2002). Severalmethods are based on the peak strength parameter; otherwise, especially when Ultimate Limit State is of concern,analyses based on φ’ cv are often suggested. For Serviceability Limit States, when the design <strong>in</strong> ma<strong>in</strong>ly governed byallowable displacements, the problem is still open.Consider<strong>in</strong>g geogrid re<strong>in</strong>forced soil walls, with the aim of explor<strong>in</strong>g these aspects <strong>and</strong> supply<strong>in</strong>g practical design<strong>in</strong>dications, the paper reports the results obta<strong>in</strong>ed by numerical analyses performed <strong>in</strong> order to <strong>in</strong>vestigate the<strong>in</strong>fluence of the choice of soil strength <strong>and</strong> geogrid stiffness values on the wall movements. Different geometries <strong>and</strong>re<strong>in</strong>forcements have been considered. The models have been calibrated by the comparison with the evidencesprovided by of well documented case histories. Current stra<strong>in</strong> levels <strong>in</strong> geogrid re<strong>in</strong>forced walls <strong>and</strong> <strong>in</strong> the soil havebeen taken <strong>in</strong>to account by the analysis of published case records as well as by triaxial tests performed on dense <strong>and</strong>low conf<strong>in</strong>ed s<strong>and</strong> specimens.The evidence gathered from the analyses strengthens the importance of the stra<strong>in</strong> compatibility concept <strong>and</strong> of theproper choice of geogrid stiffness.1
EuroGeo4 Paper number 187Figure 1. Example of compatibility curveSTRAIN LEVELS FROM CASE HISTORIESIn order to consider the displacements <strong>and</strong> stra<strong>in</strong> levels actually experienced <strong>in</strong> walls <strong>and</strong> <strong>in</strong> their re<strong>in</strong>forc<strong>in</strong>gelements, that have to be compared with soil stra<strong>in</strong>s occurr<strong>in</strong>g <strong>in</strong> peak/constant volume conditions, a number of casehistories have been considered. Only very well documented cases could supply detailed <strong>in</strong>formation useful for thescope, so the database collected <strong>and</strong> published by Allen <strong>and</strong> Bathurst (2002) <strong>and</strong> Bathurst et al. (2002) has been taken<strong>in</strong>to account. The reported measurements refer to walls characterized by different heights (H=3÷12 m); fac<strong>in</strong>g type(wrapped-around, segmental, concrete panel, etc.); re<strong>in</strong>forc<strong>in</strong>g elements (uniaxial/biaxial geogrids, woven/non wovengeotextiles); polymer (HDPE, PP, PET), soil gradation; measurement technique (local/global).Peak axial stra<strong>in</strong>s <strong>in</strong> the re<strong>in</strong>forcements do not exceed 3% with a slight <strong>in</strong>crease due to creep phenomena; <strong>in</strong> mostcases stra<strong>in</strong>s are less than 1%. The ratio of the maximum horizontal displacement of the fac<strong>in</strong>g to the wall height(U x /H) ranges between 0.1 to 1.5%. At failure peak stra<strong>in</strong> <strong>in</strong>creases up to 10%.Mc Gown et al. (1998) states that the maximum stra<strong>in</strong> measured <strong>in</strong> re<strong>in</strong>forc<strong>in</strong>g elements is usually much less than2%; the values above reported well agree with this <strong>in</strong>dication.MOBILISED SOIL STRENGTHThe mechanical behaviour of compacted soil fill is characterized by dilation due to high relative density <strong>and</strong> lowconf<strong>in</strong><strong>in</strong>g stresses. Consider<strong>in</strong>g usual wall heights <strong>and</strong> soil unit weight, mean stress less than, say, 100 kN/m 2 , couldbe assumed. Therefore, for properly compacted fills, differences up to 13° between peak (φ p ’) <strong>and</strong> constant volume(φ’ cv ) friction angles should be taken <strong>in</strong>to account (Bolton, 1986). Figure 2 illustrates dilation <strong>in</strong>fluence on the peakshear strength.Follow<strong>in</strong>g the concept of stra<strong>in</strong> compatibility between soil <strong>and</strong> re<strong>in</strong>forcement, it appears relevant to assess theaverage stra<strong>in</strong> levels to which peak <strong>and</strong> constant volume state have to be referred. Various Authors suggest the stra<strong>in</strong>range ε=3÷6% for mobilisation of peak strength <strong>and</strong> stra<strong>in</strong>s up to 12% for reach<strong>in</strong>g constant volume conditions (McGown et al. 1998).Figure 2. Dilatancy effects on s<strong>and</strong> strength (Bolton’s data, from Jewell 1996)2
EuroGeo4 Paper number 187In order to verify these f<strong>in</strong>d<strong>in</strong>gs (based on experimental evidences) a set of triaxial compression tests on a uniformsilica s<strong>and</strong> (Tic<strong>in</strong>o S<strong>and</strong>), hav<strong>in</strong>g relative density D R rang<strong>in</strong>g from 70 to 80% have been <strong>in</strong>terpreted. The ma<strong>in</strong>properties of the tested s<strong>and</strong> are <strong>in</strong>dicated <strong>in</strong> Table 1. Low conf<strong>in</strong><strong>in</strong>g stresses (σ’ 3 =20÷50 kN/m 2 ) have been applied.The results, illustrated <strong>in</strong> Figure 3, <strong>in</strong>dicate that the peak strength is mobilized for axial stra<strong>in</strong>s ε 1 =2÷4%, whileconstant volume conditions are atta<strong>in</strong>ed for ε 1 >10%.Table 1. Summary of ma<strong>in</strong> physical properties of Tic<strong>in</strong>o S<strong>and</strong>G S D 50 (mm) U % f<strong>in</strong>es (
EuroGeo4 Paper number 187heigth from wall base (m)654321GW8-FEMGW8-stra<strong>in</strong>gagePWRI-FEMPWRI-stra<strong>in</strong>gage00,0% 0,5% 1,0% 1,5%peak stra<strong>in</strong> ε peakFigure 4. Comparison between measured <strong>and</strong> calculated re<strong>in</strong>forcement peak stra<strong>in</strong>sheigth from wall base [m]65432GW11-stra<strong>in</strong>gagesGW11-FEMGW9-<strong>in</strong>cl<strong>in</strong>ometerGW9-FEM100 20 40 60 80horizontal displacement Ux [mm]Figure 5. Comparison between measured <strong>and</strong> calculated wall horizontal displacements<strong>Selection</strong> of geogrid stiffnessThe re<strong>in</strong>forcement geometrical <strong>and</strong> mechanical characteristics obviously <strong>in</strong>fluence wall performance, both withregard to stability conditions <strong>and</strong> to global displacements. In the numerical analyses the re<strong>in</strong>forcements are modelledas flexible elastic elements that can susta<strong>in</strong> only tensile forces (no compression). The only property to def<strong>in</strong>e is theaxial stiffness EA, that is the ratio of the axial force per unit width <strong>and</strong> the axial stra<strong>in</strong>. Different values of the axialstiffness can be so determ<strong>in</strong>ed by the knowledge of the normalized isochronous curve of the re<strong>in</strong>forcement, hav<strong>in</strong>gdef<strong>in</strong>ed the ultimate tensile strength.As far as soil-geogrid <strong>in</strong>teraction is concerned, around the re<strong>in</strong>forcements set of <strong>in</strong>terfaces (suited to model bondmechanisms) <strong>and</strong> ref<strong>in</strong>ement have been applied. The <strong>in</strong>terface strength (analogous to an “efficiency” parameter) canbe def<strong>in</strong>ed accord<strong>in</strong>g to soil <strong>and</strong> geogrid characteristics, as outl<strong>in</strong>ed by Jewell (1996).Two different geogrids are considered <strong>in</strong> the follow<strong>in</strong>g. Table 3 <strong>and</strong> Figure 6 report, respectively, the ma<strong>in</strong>characteristics <strong>and</strong> the isochronous curves.Table 3. Summary of geogrid general characteristicsName Symbol Description Polymer Grid size(mm)EnkagridPRO/40<strong>Harpo</strong>ter40/20Ultimate TensileStrength(kN/m)Tolerance TensileStrength(kN/m)EG Extruded bars(laser welded)PET 40x94 48 40HT Woven PET 15x15 40 40(PVC coated)4
EuroGeo4 Paper number 187Figure 6. Isochronous curves for geogrids EG (left) <strong>and</strong> HT (right)<strong>Geogrid</strong> “EG” is evidently stiffer than “HT”; the choice of select<strong>in</strong>g these types of re<strong>in</strong>forc<strong>in</strong>g elements has beenmade just to enhance the importance of re<strong>in</strong>forcement behaviour <strong>in</strong> approaches based on stra<strong>in</strong> compatibility.Assum<strong>in</strong>g secant stiffness values, calculated with regard to stra<strong>in</strong> levels (Figure 7), the differences are moreevident <strong>and</strong> stress the importance of def<strong>in</strong><strong>in</strong>g <strong>in</strong> which range the wall (<strong>and</strong> thus the soil) is expected to work. A stiffgeogrid, such as type EG, show very high performance especially for stra<strong>in</strong> levels less than 2-3%, typical value, asobserved <strong>in</strong> the section dedicated to the analysis of case histories, for re<strong>in</strong>forcements walls <strong>in</strong> a work<strong>in</strong>g state. On thecontrary, geogrid like type HT, are characterized by a low <strong>and</strong> almost constant stiffness, regardless to the mobilisedstra<strong>in</strong> (<strong>and</strong> strength) level.The numerical analyses have been carried out assum<strong>in</strong>g different values of axial stiffness, as <strong>in</strong>dicated <strong>in</strong> Table 4.20001750stiffness EA (kN/m)150012501000750500250EGHT00 2 4 6 8 10 12 14stra<strong>in</strong> (%)Figure 7. Axial stiffness for geogrids EG <strong>and</strong> HTTable 4. Summary of geogrid performance characteristics considered <strong>in</strong> FEM analyses<strong>Stra<strong>in</strong></strong> (%) Stress ratio EG (%) Stress ratio HT (%) <strong>Stiffness</strong> EG (kN/m) <strong>Stiffness</strong> HT (kN/m)0.5 20 - 1920 -1 25 10 1250 3502 35 20 850 3003 45 - 720 -5 75 30 720 2505
EuroGeo4 Paper number 187Cases considered <strong>in</strong> numerical analysesThe numerical analyses are aimed to highlight the importance of consider<strong>in</strong>g compatibility conditions betweenre<strong>in</strong>forcement <strong>and</strong> soil. Therefore, soil parameters representative of a different mobilization of soil strength have beenassumed, together with the two geogrids EG <strong>and</strong> HT.Three walls of different heights (4, 6, 8 m) are analyzed; the models have been generated start<strong>in</strong>g from theevidences gathered <strong>in</strong> the calibration phase, extend<strong>in</strong>g to the new cases the choices <strong>and</strong> parameters there adopted. Thewalls have a wrapped-around fac<strong>in</strong>g; the ratio of the geogrid length L to the wall height H is equal to 0.5, <strong>in</strong> order tohave relatively high stressed re<strong>in</strong>forcements. On the backfill acts a surcharge. Dry conditions are assumed. A sketch ofthe adopted mesh is illustrated <strong>in</strong> Figure 8; Tables 5 <strong>and</strong> 6 report geometrical <strong>and</strong> soil characteristics . The analyseshave been performed with the elastic perfectly-plastic Mohr-Coulomb soil model.Figure 8. Example of adopted meshTable 5. Summary of geogrid performance characteristics considered <strong>in</strong> FEM analysesCase GW-H4 GW-H6 GW-H8Height H (m) 4.2 6.0 7.8<strong>Geogrid</strong> total length L (m) 2.0 3.0 4.0Vertical <strong>spa</strong>c<strong>in</strong>g Sv (m) 0.60 0.60 0.60L/H ~ 0.5 0.5 ~ 0.5Sv/H 0.14 0.10 0.08Number of re<strong>in</strong>forcements 7 10 13Overlap length (m) 0.8 1.2 1.6Surcharge q (kN/m 2 ) 50 80 100q/σ v (H/2) ~ 1.3 ~ 1.5 ~ 1.4Table 6. Soil ma<strong>in</strong> characteristicsSoil type # 1 # 2Backfill unit weight γ (kN/m 3 ) 18.0 18.0Friction angle φ’ p 45° 39°Constant volume friction angle φ’ cv 32° 32°Dilatancy angle ψ 15° 8°Young modulus E (MN/m 2 ) 60 24Shear modulus G (MN/m 2) 25 10Poisson’s ratio 0.2 0.2The soil type #1 may be referred to at-rest or “pre-peak” conditions while type #2 is <strong>in</strong>troduced for a fictitioussimulation of “post-peak” conditions, both for strength <strong>and</strong> deformability parameters.RESULTSA set of “calibration” analyses has been carried out on the wall GW-H6 <strong>in</strong> order to assess the mean level of tensilestra<strong>in</strong> <strong>in</strong> the re<strong>in</strong>forcements. It is worth observ<strong>in</strong>g that these are assumed as global stra<strong>in</strong>s, calculated consider<strong>in</strong>g the“net” horizontal displacement, which is deduct<strong>in</strong>g from the total displacement of the geogrid the value at the rear.These tests are been made vary<strong>in</strong>g the geogrid stiffness (Table 4) <strong>and</strong> adopt<strong>in</strong>g soil type #1. As expected, theresults are particularly affected by the value of EA for the stiff geogrid EG, be<strong>in</strong>g the peak stra<strong>in</strong> ε however less than1%. On the contrary, for geogrid HT, ε is always higher than 1% , with maximum values reach<strong>in</strong>g 3%.6
EuroGeo4 Paper number 187With effect from these prelim<strong>in</strong>ary outcomes, all the walls have been simulated, consider<strong>in</strong>g, accord<strong>in</strong>g to soilre<strong>in</strong>forcementstra<strong>in</strong> compatibility:• <strong>Geogrid</strong> EG – stiffness EA=1250 kN/m - Soil type #1• <strong>Geogrid</strong> HT – stiffness EA=250 kN/m - Soil type #1 – Soil type #2Because of the typical stra<strong>in</strong> levels expected for very extensible geogrids, like HT, it appeared more appropriatedanalyz<strong>in</strong>g the so re<strong>in</strong>forced wall performance with both soil types.The results of the numerical analyses are summarized plott<strong>in</strong>g peak stra<strong>in</strong>s ε <strong>and</strong> normalized horizontaldisplacements (Ux/H) aga<strong>in</strong>st normalized re<strong>in</strong>forcement heights (Y/H) (Figures 9-10).Figures 11 reports the values of the maximum tensile force mobilized <strong>in</strong> each re<strong>in</strong>forcement (divided by theultimate value); the distributions along wall height <strong>and</strong> along geogrid length (not shown) follow the expected trends.Y / H10,80,60,4geogrid EGGW-H4 - #1GW-H6 - #1GW-H8 - #110,80,60,4geogrid HTGW-H4 - #1GW-H6 - #1GW-H8 - #1GW-H4 - #2GW-H6 - #2GW-H8 - #20,20,200,0% 0,2% 0,4% 0,6% 0,8% 1,0%ε00% 2% 4% 6% 8% 10%εFigure 9. <strong>Stra<strong>in</strong></strong>s <strong>in</strong> re<strong>in</strong>forc<strong>in</strong>g elements1geogrid EG1geogrid HT0,80,8Y / H0,60,40,20GW-H4 - #1GW-H6 - #1GW-H8 - #10,0% 0,2% 0,4% 0,6% 0,8% 1,0%Ux/HFigure 10. Horizontal displacements <strong>in</strong> re<strong>in</strong>forced walls0,6GW-H4 - #10,4GW-H6 - #1GW-H8 - #1GW-H4 - #20,2GW-H6 - #2GW-H8 - #200% 2% 4% 6% 8% 10%Ux/H1,0geogrid EGGW-H4 - #1GW-H6 - #10,8GW-H8 - #10,6Y/H0,40,20,00,0 0,1 0,1 0,2 0,2 0,3 0,3 0,4T max /T ult1,0geogrid HTGW-H4 - #1GW-H6 - #1GW-H8 - #10,80,6GW-H4 - #2GW-H6 - #2GW-H8 - #20,40,20,00,0 0,1 0,2 0,3 0,4 0,5 0,6 0,7 0,8Figure 11. Tensile forces mobilized <strong>in</strong> the re<strong>in</strong>forcements7
EuroGeo4 Paper number 187The obta<strong>in</strong>ed results allow to remark that:• as expected, when stiff re<strong>in</strong>forc<strong>in</strong>g elements are adopted, the global displacements are limited, allow<strong>in</strong>g thestructure to be considered <strong>in</strong> a serviceability limit state;• the displacements are obviously also affected by the soil mechanical characteristics, which, <strong>in</strong> turn, may beaffected by the compaction quality or, if proper techniques are adopted <strong>and</strong> backfill soil shows dilativebehaviour, by the <strong>in</strong>duced stra<strong>in</strong> levels;• for these reasons it is important, <strong>in</strong> the selection of the values of soil parameters, tak<strong>in</strong>g <strong>in</strong>to account that withvery extensible geogrids large displacements <strong>and</strong> stra<strong>in</strong>s will take place; <strong>in</strong> this case it is more difficult todef<strong>in</strong>e which value of soil strength is to be considered;• for geogrids characterized by low axial stiffness, it seems advisable to assume the constant volume frictionangle φ’ cv , this result<strong>in</strong>g <strong>in</strong> a more correct <strong>and</strong> conservative choice of soil strength;• design<strong>in</strong>g with high stiffness geogrids, on the other h<strong>and</strong>, allows to consider peak strength condition, at leastas far as serviceability states are considered; the stra<strong>in</strong> levels <strong>in</strong> the re<strong>in</strong>forcements, <strong>in</strong> fact, are compatiblewith the stra<strong>in</strong>s mobilized <strong>in</strong> the soil before reach<strong>in</strong>g its peak resistance,• the stress ratio mobilized <strong>in</strong> the stiff re<strong>in</strong>forcements (adopt<strong>in</strong>g peak friction angle (φ p ’) are almost half the onesfor very extensible geogrids with same ultimate strength (but lower friction angle);• this means that <strong>in</strong> the former case the wall is stable with adequate level of safety while <strong>in</strong> the latter the stabilityconditions are critical, the safety factors low <strong>and</strong>, aga<strong>in</strong>, the displacements probably unacceptable.CONCLUSIONSIn the paper the problem of stra<strong>in</strong> compatibility between soil <strong>and</strong> geosynthetic re<strong>in</strong>forcement has been consideredas far as geogrid re<strong>in</strong>forced walls are concerned.The careful analysis of well selected case histories has <strong>in</strong>dicate that, at work<strong>in</strong>g state, <strong>in</strong> the re<strong>in</strong>forc<strong>in</strong>g elementsthe mobilised stra<strong>in</strong>s are usually compatible with the levels of stra<strong>in</strong> experienced <strong>in</strong> dilative soil <strong>in</strong> pre-peakconditions.In consider<strong>in</strong>g stra<strong>in</strong> compatibility as a design approach, particularly for serviceability limit state, the selection ofgeogrid axial stiffness plays a relevant role, because the soil strength parameters have to be chosen with respect to theexpected wall displacements.The use of stiff geogrids results <strong>in</strong> small displacements <strong>and</strong> <strong>in</strong> a safe mobilization of soil <strong>and</strong> re<strong>in</strong>forcementstrengths. The opposite verifies for very extensible geogrids.These aspects are also relevant if one considers the possible creep phenomena <strong>in</strong> re<strong>in</strong>forced walls, which may havevery negative consequences for wall displacements, when occurr<strong>in</strong>g <strong>in</strong> an already high loaded <strong>and</strong> stra<strong>in</strong>ed re<strong>in</strong>forc<strong>in</strong>gelement, characterized by a low axial stiffness.Acknowledgements: The authors acknowledge the careful work done by A Verardo, M Tabellario <strong>and</strong> E Mortola.Correspond<strong>in</strong>g author: Prof Riccardo Berardi, Dept. of Civil, Environmental, Architectural Engng. - Univ. ofGenova, Via Montallegro, 1, Genova, 16145, Italy. Tel: +39 010 353 2506/2491. Email: riccardo.berardi@unige.it.REFERENCESAllen, T.M., & Bathurst, R.J. 2002. Soil re<strong>in</strong>forcement loads <strong>in</strong> geosynthetic walls at work<strong>in</strong>g stress conditions.Geosynthetics International, vol 9, No 5-6, 525-566.Allen, T.M., Bathurst, R.J. & Berg, R.R. 2002. Global level of safety <strong>and</strong> performance of geosynthetic walls: anhistorical perspective. Geosynthetics International, vol 9, No 5-6, 395-450.Bathurst, R.J., Allen, T.M., & Walters, D.L. 2002. Short term stra<strong>in</strong> <strong>and</strong> deformation behavior of geosynthetic walls atwork<strong>in</strong>g stress conditions. Geosynthetics International, vol 9, No 5-6, 451-482.Bolton, M.D. 1986. The strength <strong>and</strong> dilatancy of s<strong>and</strong>s. Géotechnique, 36, No.1, 65-78.Jewell, R. 1996. Soil re<strong>in</strong>forcement with geotextiles. CIRIA Special Publication 123, Thomas Telford, pp. 332.Leshch<strong>in</strong>sky, D. 2001. Design dilemma: use peak or residual strength of soil. Geotextiles <strong>and</strong> Geomembranes, vol.19,111-125.L<strong>in</strong>g, H.I., Cardany, C.P., Sun, L-X & Hashimoto, H. 2000. F<strong>in</strong>ite Element study of a geosynthetic-re<strong>in</strong>forced soilreta<strong>in</strong><strong>in</strong>g wall with concrete-block fac<strong>in</strong>g. Geosynthetics International, vol. 7, No. 3, 163-188.Mc Gown, A., Andrawes, K.Z., Pradham, S. & Khan, A.J. 1998. Limit state design of geosynthetic re<strong>in</strong>forcedstructures. Proceed<strong>in</strong>gs. 6 th Int. Conference on Geosynthetics, Atlanta, IFAI, 143-179.Zornberg, J.G. 2002. Peak versus residual shear strength <strong>in</strong> geosynthetic-re<strong>in</strong>forced soil design. GeosyntheticsInternational, vol. 9, No. 4, 301-318.8