View - Journal of Threatened Taxa
View - Journal of Threatened Taxa
View - Journal of Threatened Taxa
Create successful ePaper yourself
Turn your PDF publications into a flip-book with our unique Google optimized e-Paper software.
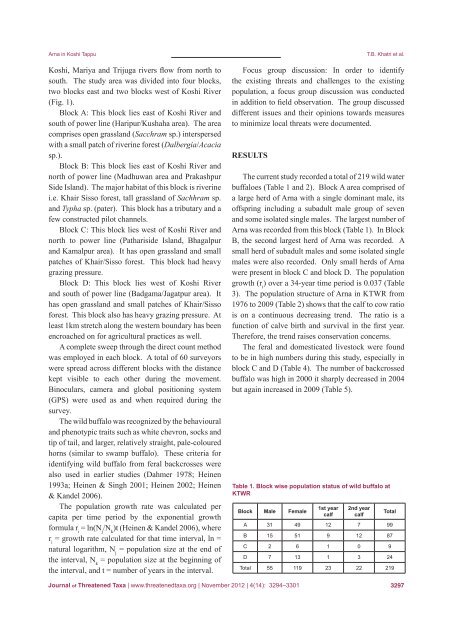
Arna in Koshi TappuKoshi, Mariya and Trijuga rivers flow from north tosouth. The study area was divided into four blocks,two blocks east and two blocks west <strong>of</strong> Koshi River(Fig. 1).Block A: This block lies east <strong>of</strong> Koshi River andsouth <strong>of</strong> power line (Haripur/Kushaha area). The areacomprises open grassland (Sacchram sp.) interspersedwith a small patch <strong>of</strong> riverine forest (Dalbergia/Acaciasp.).Block B: This block lies east <strong>of</strong> Koshi River andnorth <strong>of</strong> power line (Madhuwan area and PrakashpurSide Island). The major habitat <strong>of</strong> this block is riverinei.e. Khair Sisso forest, tall grassland <strong>of</strong> Sachhram sp.and Typha sp. (pater). This block has a tributary and afew constructed pilot channels.Block C: This block lies west <strong>of</strong> Koshi River andnorth to power line (Pathariside Island, Bhagalpurand Kamalpur area). It has open grassland and smallpatches <strong>of</strong> Khair/Sisso forest. This block had heavygrazing pressure.Block D: This block lies west <strong>of</strong> Koshi Riverand south <strong>of</strong> power line (Badgama/Jagatpur area). Ithas open grassland and small patches <strong>of</strong> Khair/Siss<strong>of</strong>orest. This block also has heavy grazing pressure. Atleast 1km stretch along the western boundary has beenencroached on for agricultural practices as well.A complete sweep through the direct count methodwas employed in each block. A total <strong>of</strong> 60 surveyorswere spread across different blocks with the distancekept visible to each other during the movement.Binoculars, camera and global positioning system(GPS) were used as and when required during thesurvey.The wild buffalo was recognized by the behaviouraland phenotypic traits such as white chevron, socks andtip <strong>of</strong> tail, and larger, relatively straight, pale-colouredhorns (similar to swamp buffalo). These criteria foridentifying wild buffalo from feral backcrosses werealso used in earlier studies (Dahmer 1978; Heinen1993a; Heinen & Singh 2001; Heinen 2002; Heinen& Kandel 2006).The population growth rate was calculated percapita per time period by the exponential growthformula r i= ln(N j/N k)t (Heinen & Kandel 2006), wherer i= growth rate calculated for that time interval, ln =natural logarithm, N j= population size at the end <strong>of</strong>the interval, N k= population size at the beginning <strong>of</strong>the interval, and t = number <strong>of</strong> years in the interval.T.B. Khatri et al.Focus group discussion: In order to identifythe existing threats and challenges to the existingpopulation, a focus group discussion was conductedin addition to field observation. The group discusseddifferent issues and their opinions towards measuresto minimize local threats were documented.ResultsThe current study recorded a total <strong>of</strong> 219 wild waterbuffaloes (Table 1 and 2). Block A area comprised <strong>of</strong>a large herd <strong>of</strong> Arna with a single dominant male, its<strong>of</strong>fspring including a subadult male group <strong>of</strong> sevenand some isolated single males. The largest number <strong>of</strong>Arna was recorded from this block (Table 1). In BlockB, the second largest herd <strong>of</strong> Arna was recorded. Asmall herd <strong>of</strong> subadult males and some isolated singlemales were also recorded. Only small herds <strong>of</strong> Arnawere present in block C and block D. The populationgrowth (r i) over a 34-year time period is 0.037 (Table3). The population structure <strong>of</strong> Arna in KTWR from1976 to 2009 (Table 2) shows that the calf to cow ratiois on a continuous decreasing trend. The ratio is afunction <strong>of</strong> calve birth and survival in the first year.Therefore, the trend raises conservation concerns.The feral and domesticated livestock were foundto be in high numbers during this study, especially inblock C and D (Table 4). The number <strong>of</strong> backcrossedbuffalo was high in 2000 it sharply decreased in 2004but again increased in 2009 (Table 5).Table 1. Block wise population status <strong>of</strong> wild buffalo atKTWRBlock Male Female1st yearcalf2nd yearcalfTotalA 31 49 12 7 99B 15 51 9 12 87C 2 6 1 0 9D 7 13 1 3 24Total 55 119 23 22 219<strong>Journal</strong> <strong>of</strong> <strong>Threatened</strong> <strong>Taxa</strong> | www.threatenedtaxa.org | November 2012 | 4(14): 3294–33013297


