Perceptual Quality Assessment of Wireless Video ... - ResearchGate
Perceptual Quality Assessment of Wireless Video ... - ResearchGate
Perceptual Quality Assessment of Wireless Video ... - ResearchGate

You also want an ePaper? Increase the reach of your titles
YUMPU automatically turns print PDFs into web optimized ePapers that Google loves.
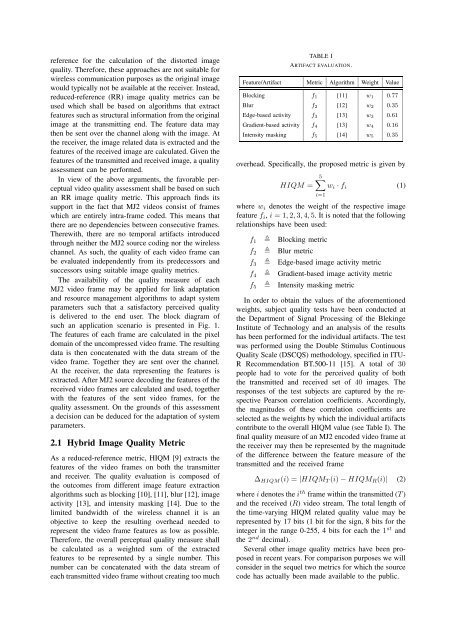
eference for the calculation <strong>of</strong> the distorted imagequality. Therefore, these approaches are not suitable forwireless communication purposes as the original imagewould typically not be available at the receiver. Instead,reduced-reference (RR) image quality metrics can beused which shall be based on algorithms that extractfeatures such as structural information from the originalimage at the transmitting end. The feature data maythen be sent over the channel along with the image. Atthe receiver, the image related data is extracted and thefeatures <strong>of</strong> the received image are calculated. Given thefeatures <strong>of</strong> the transmitted and received image, a qualityassessment can be performed.In view <strong>of</strong> the above arguments, the favorable perceptualvideo quality assessment shall be based on suchan RR image quality metric. This approach finds itssupport in the fact that MJ2 videos consist <strong>of</strong> frameswhich are entirely intra-frame coded. This means thatthere are no dependencies between consecutive frames.Therewith, there are no temporal artifacts introducedthrough neither the MJ2 source coding nor the wirelesschannel. As such, the quality <strong>of</strong> each video frame canbe evaluated independently from its predecessors andsuccessors using suitable image quality metrics.The availability <strong>of</strong> the quality measure <strong>of</strong> eachMJ2 video frame may be applied for link adaptationand resource management algorithms to adapt systemparameters such that a satisfactory perceived qualityis delivered to the end user. The block diagram <strong>of</strong>such an application scenario is presented in Fig. 1.The features <strong>of</strong> each frame are calculated in the pixeldomain <strong>of</strong> the uncompressed video frame. The resultingdata is then concatenated with the data stream <strong>of</strong> thevideo frame. Together they are sent over the channel.At the receiver, the data representing the features isextracted. After MJ2 source decoding the features <strong>of</strong> thereceived video frames are calculated and used, togetherwith the features <strong>of</strong> the sent video frames, for thequality assessment. On the grounds <strong>of</strong> this assessmenta decision can be deduced for the adaptation <strong>of</strong> systemparameters.2.1 Hybrid Image <strong>Quality</strong> MetricAs a reduced-reference metric, HIQM [9] extracts thefeatures <strong>of</strong> the video frames on both the transmitterand receiver. The quality evaluation is composed <strong>of</strong>the outcomes from different image feature extractionalgorithms such as blocking [10], [11], blur [12], imageactivity [13], and intensity masking [14]. Due to thelimited bandwidth <strong>of</strong> the wireless channel it is anobjective to keep the resulting overhead needed torepresent the video frame features as low as possible.Therefore, the overall perceptual quality measure shallbe calculated as a weighted sum <strong>of</strong> the extractedfeatures to be represented by a single number. Thisnumber can be concatenated with the data stream <strong>of</strong>each transmitted video frame without creating too muchTABLE IARTIFACT EVALUATION.Feature/Artifact Metric Algorithm Weight ValueBlocking f 1 [11] w 1 0.77Blur f 2 [12] w 2 0.35Edge-based activity f 3 [13] w 3 0.61Gradient-based activity f 4 [13] w 4 0.16Intensity masking f 5 [14] w 5 0.35overhead. Specifically, the proposed metric is given byHIQM =5∑w i · f i (1)i=1where w i denotes the weight <strong>of</strong> the respective imagefeature f i , i = 1, 2, 3, 4, 5. It is noted that the followingrelationships have been used:f 1 Blocking metricf 2 Blur metricf 3 Edge-based image activity metricf 4 Gradient-based image activity metricf 5 Intensity masking metricIn order to obtain the values <strong>of</strong> the aforementionedweights, subject quality tests have been conducted atthe Department <strong>of</strong> Signal Processing <strong>of</strong> the BlekingeInstitute <strong>of</strong> Technology and an analysis <strong>of</strong> the resultshas been performed for the individual artifacts. The testwas performed using the Double Stimulus Continuous<strong>Quality</strong> Scale (DSCQS) methodology, specified in ITU-R Recommendation BT.500-11 [15]. A total <strong>of</strong> 30people had to vote for the perceived quality <strong>of</strong> boththe transmitted and received set <strong>of</strong> 40 images. Theresponses <strong>of</strong> the test subjects are captured by the respectivePearson correlation coefficients. Accordingly,the magnitudes <strong>of</strong> these correlation coefficients areselected as the weights by which the individual artifactscontribute to the overall HIQM value (see Table I). Thefinal quality measure <strong>of</strong> an MJ2 encoded video frame atthe receiver may then be represented by the magnitude<strong>of</strong> the difference between the feature measure <strong>of</strong> thetransmitted and the received frame∆ HIQM (i) = |HIQM T (i) − HIQM R (i)| (2)where i denotes the i th frame within the transmitted (T )and the received (R) video stream. The total length <strong>of</strong>the time-varying HIQM related quality value may berepresented by 17 bits (1 bit for the sign, 8 bits for theinteger in the range 0-255, 4 bits for each the 1 st andthe 2 nd decimal).Several other image quality metrics have been proposedin recent years. For comparison purposes we willconsider in the sequel two metrics for which the sourcecode has actually been made available to the public.