Perceptual Quality Assessment of Wireless Video ... - ResearchGate
Perceptual Quality Assessment of Wireless Video ... - ResearchGate
Perceptual Quality Assessment of Wireless Video ... - ResearchGate

You also want an ePaper? Increase the reach of your titles
YUMPU automatically turns print PDFs into web optimized ePapers that Google loves.
<strong>Perceptual</strong> <strong>Quality</strong> <strong>Assessment</strong> <strong>of</strong> <strong>Wireless</strong> <strong>Video</strong> ApplicationsUlrich Engelke 1 , Tubagus Maulana Kusuma 2 , and Hans-Jürgen Zepernick 11 Blekinge Institute <strong>of</strong> Technology, SE-372 25 Ronneby, Sweden, {ulrich.engelke, hans-jurgen.zepernick}@bth.se2 Gunadarma University, Jl. Margonda Raya 100, Depok 16424, Indonesia, mkusuma@staff.gunadarma.ac.idAbstractThe rapid evolution <strong>of</strong> wireless networks is driven by the growth <strong>of</strong> wireless packet data applications suchas interactive mobile multimedia applications, wireless streaming services, and video-on-demand. The largelyheterogeneous network structures, severe channel impairments, and complex traffic patterns make the wirelessnetworks much more unpredictable compared to their wired counterparts. One <strong>of</strong> the major challenges with theroll-out <strong>of</strong> these services is therefore the design <strong>of</strong> wireless networks that fulfill the stringent quality <strong>of</strong> servicerequirements <strong>of</strong> wireless video applications. In this paper, the applicability <strong>of</strong> perceptual image quality metrics forreal-time quality assessment <strong>of</strong> Motion JPEG2000 (MJ2) video streams over wireless channels is investigated. Inparticular, a reduced-reference hybrid image quality metric (HIQM) is identified as suitable for an extension tovideo applications. It outperforms other known metrics in terms <strong>of</strong> required overhead and prediction performance.1 IntroductionWith the implementation <strong>of</strong> current and the development<strong>of</strong> future mobile radio networks, there hasbeen an increasing demand for efficient transmission<strong>of</strong> multimedia services over wireless channels. Theseservices typically require much higher bandwidth forthe delivery <strong>of</strong> the different applications subject to anumber <strong>of</strong> quality constraints.On the other hand, impairments such as the timevaryingnature <strong>of</strong> the wireless channel caused by multipathpropagation and changing interference conditionsmake the channel very unreliable. Link adaptation andother techniques have been employed to adapt thetransmission parameters in order to compensate forthese variations [1]–[3]. The conventional adaptationtechniques are based on measures such as the signalto-noiseratio (SNR) or the bit error rate (BER) asindicators <strong>of</strong> the received quality. However, in case<strong>of</strong> multimedia services it has been shown that thesemeasures do not necessarily correlate well with thequality as perceived by humans [4], [5]. Therefore, thebest quality judgement <strong>of</strong> a multimedia service wouldbe done by humans themselves. Clearly, this would bea tedious and expensive approach that cannot be performedin real-time. Therefore, quality measures havebeen proposed that incorporate characteristics <strong>of</strong> thehuman auditory and visual system and inherently accountfor user-perceived quality. In contrast to alreadystandardized perceptual quality metrics for audio [6]and speech [7], the standardization process for imageand video quality assessment in not yet as developed.In the sequel, the applicability <strong>of</strong> perceptual imagequality metrics for real-time video quality assessment <strong>of</strong>Motion JPEG2000 (MJ2) video streams over wirelesschannels is investigated. This approach is motivatedby the fact that MJ2 is solely based on intra-framecoding techniques. In addition, it has been shown thatMJ2 encoded video streams can provide good performanceover low bit rate error-prone wireless channels[8]. This is mainly due to the non-existence <strong>of</strong> interframedependencies and the related suppression <strong>of</strong>error propagation. This characteristic makes MJ2 veryerror resilient compared to other state-<strong>of</strong>-the-art videocodecs such as MPEG-4, defined by the Moving PictureExperts Group (MPEG). Furthermore, MJ2 <strong>of</strong>fers highcoding efficiency and low complexity.In this paper, a number <strong>of</strong> image quality metricsare considered for application to real-time perceptualquality assessment <strong>of</strong> MJ2 video streams over wirelesschannels. Simulation results reveal that the reducedreferencehybrid image quality metric (HIQM) performsfavorable over the other examined metrics interms <strong>of</strong> required overhead and prediction performance.This paper is structured as follows. Section 2 presentsan overview <strong>of</strong> the considered quality metrics andmeasurement techniques. In Section 3, the ideas behindusing quality prediction functions for automaticquality assessment are described. Simulation results forthe different perceptual quality assessment techniquesare provided in Section 4. Conclusions are drawn inSection 5.2 <strong>Perceptual</strong> <strong>Quality</strong> <strong>Assessment</strong>:From Image to <strong>Video</strong>Traditionally, fidelity metrics such as the peak signalto-noiseratio (PSNR) or the mean-squared error (MSE)have been utilized to estimate the quality <strong>of</strong> an image.These belong to the group <strong>of</strong> full-reference (FR) metricswhich means that the original image is needed as a
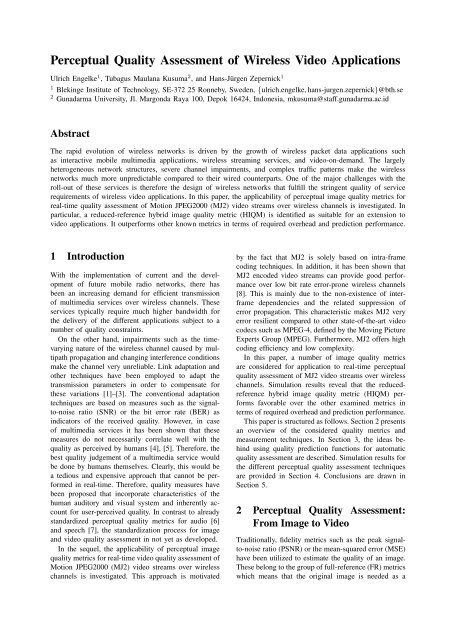
eference for the calculation <strong>of</strong> the distorted imagequality. Therefore, these approaches are not suitable forwireless communication purposes as the original imagewould typically not be available at the receiver. Instead,reduced-reference (RR) image quality metrics can beused which shall be based on algorithms that extractfeatures such as structural information from the originalimage at the transmitting end. The feature data maythen be sent over the channel along with the image. Atthe receiver, the image related data is extracted and thefeatures <strong>of</strong> the received image are calculated. Given thefeatures <strong>of</strong> the transmitted and received image, a qualityassessment can be performed.In view <strong>of</strong> the above arguments, the favorable perceptualvideo quality assessment shall be based on suchan RR image quality metric. This approach finds itssupport in the fact that MJ2 videos consist <strong>of</strong> frameswhich are entirely intra-frame coded. This means thatthere are no dependencies between consecutive frames.Therewith, there are no temporal artifacts introducedthrough neither the MJ2 source coding nor the wirelesschannel. As such, the quality <strong>of</strong> each video frame canbe evaluated independently from its predecessors andsuccessors using suitable image quality metrics.The availability <strong>of</strong> the quality measure <strong>of</strong> eachMJ2 video frame may be applied for link adaptationand resource management algorithms to adapt systemparameters such that a satisfactory perceived qualityis delivered to the end user. The block diagram <strong>of</strong>such an application scenario is presented in Fig. 1.The features <strong>of</strong> each frame are calculated in the pixeldomain <strong>of</strong> the uncompressed video frame. The resultingdata is then concatenated with the data stream <strong>of</strong> thevideo frame. Together they are sent over the channel.At the receiver, the data representing the features isextracted. After MJ2 source decoding the features <strong>of</strong> thereceived video frames are calculated and used, togetherwith the features <strong>of</strong> the sent video frames, for thequality assessment. On the grounds <strong>of</strong> this assessmenta decision can be deduced for the adaptation <strong>of</strong> systemparameters.2.1 Hybrid Image <strong>Quality</strong> MetricAs a reduced-reference metric, HIQM [9] extracts thefeatures <strong>of</strong> the video frames on both the transmitterand receiver. The quality evaluation is composed <strong>of</strong>the outcomes from different image feature extractionalgorithms such as blocking [10], [11], blur [12], imageactivity [13], and intensity masking [14]. Due to thelimited bandwidth <strong>of</strong> the wireless channel it is anobjective to keep the resulting overhead needed torepresent the video frame features as low as possible.Therefore, the overall perceptual quality measure shallbe calculated as a weighted sum <strong>of</strong> the extractedfeatures to be represented by a single number. Thisnumber can be concatenated with the data stream <strong>of</strong>each transmitted video frame without creating too muchTABLE IARTIFACT EVALUATION.Feature/Artifact Metric Algorithm Weight ValueBlocking f 1 [11] w 1 0.77Blur f 2 [12] w 2 0.35Edge-based activity f 3 [13] w 3 0.61Gradient-based activity f 4 [13] w 4 0.16Intensity masking f 5 [14] w 5 0.35overhead. Specifically, the proposed metric is given byHIQM =5∑w i · f i (1)i=1where w i denotes the weight <strong>of</strong> the respective imagefeature f i , i = 1, 2, 3, 4, 5. It is noted that the followingrelationships have been used:f 1 Blocking metricf 2 Blur metricf 3 Edge-based image activity metricf 4 Gradient-based image activity metricf 5 Intensity masking metricIn order to obtain the values <strong>of</strong> the aforementionedweights, subject quality tests have been conducted atthe Department <strong>of</strong> Signal Processing <strong>of</strong> the BlekingeInstitute <strong>of</strong> Technology and an analysis <strong>of</strong> the resultshas been performed for the individual artifacts. The testwas performed using the Double Stimulus Continuous<strong>Quality</strong> Scale (DSCQS) methodology, specified in ITU-R Recommendation BT.500-11 [15]. A total <strong>of</strong> 30people had to vote for the perceived quality <strong>of</strong> boththe transmitted and received set <strong>of</strong> 40 images. Theresponses <strong>of</strong> the test subjects are captured by the respectivePearson correlation coefficients. Accordingly,the magnitudes <strong>of</strong> these correlation coefficients areselected as the weights by which the individual artifactscontribute to the overall HIQM value (see Table I). Thefinal quality measure <strong>of</strong> an MJ2 encoded video frame atthe receiver may then be represented by the magnitude<strong>of</strong> the difference between the feature measure <strong>of</strong> thetransmitted and the received frame∆ HIQM (i) = |HIQM T (i) − HIQM R (i)| (2)where i denotes the i th frame within the transmitted (T )and the received (R) video stream. The total length <strong>of</strong>the time-varying HIQM related quality value may berepresented by 17 bits (1 bit for the sign, 8 bits for theinteger in the range 0-255, 4 bits for each the 1 st andthe 2 nd decimal).Several other image quality metrics have been proposedin recent years. For comparison purposes we willconsider in the sequel two metrics for which the sourcecode has actually been made available to the public.
Uncompressed<strong>Video</strong>Motion JPEG2000Source EncoderFeature CalculationConcatenationChannelEncoderModFlat Rayleigh Fading<strong>Wireless</strong> ChannelDecision<strong>Quality</strong><strong>Assessment</strong>FeatureCalculationMotion JPEG2000Source DecoderDecompositionChannelDecoderDemodFig. 1.Block diagram <strong>of</strong> a wireless link using reduced-reference perceptual quality metrics for video quality monitoring.2.2 Reduced-Reference Image <strong>Quality</strong> <strong>Assessment</strong>The reduced-reference image quality assessment(RRIQA) technique has been proposed in [16]. It isbased on natural image statistic model in the waveletdomain. The distortion between the received and thetransmitted image is calculated as(D = log 2 1 + 1 K)∑|D ˆd k (p k ‖q k )| (3)0k=1where the constant D 0 is used as a scaler <strong>of</strong> thedistortion measure, ˆd k (p k ‖q k ) denotes the estimation <strong>of</strong>the Kullback-Leibler distance between the probabilitydensity functions p k and q k <strong>of</strong> the k th subband in thetransmitted and received image, and K is the number<strong>of</strong> subbands. The overhead needed to represent thereduced-reference features is given in [16] as 162 bits.2.3 Measure <strong>of</strong> Structural SimilarityThe full-reference metric reported in [17] is also takeninto account. Although the applicability <strong>of</strong> this metricfor wireless communications is not necessarily givendue to its full-reference nature, the comparison regardingthe quality prediction performance is <strong>of</strong> highinterest as it would serve as a benchmark test for thereduced-reference metrics. The considered metric isbased on the degradation <strong>of</strong> structural information. Itsoutcome is a measure <strong>of</strong> structural similarity (SSIM)between the reference and the distorted imageSSIM(x, y) = (2µ xµ y + C 1 )(2σ xy + C 2 )(µ 2 x + µ 2 y + C 1 )(σ 2 x + σ 2 y + C 2 ) (4)where µ x , µ y and σ x , σ y denote the mean intensity andcontrast <strong>of</strong> image signals x and y, respectively. Theconstants C 1 and C 2 are used to avoid instabilitiesin the structural similarity comparison that may occurfor particular mean intensity and contrast combinations(µ 2 x + µ 2 y = 0 or σ 2 x + σ 2 y = 0). Clearly, the overheadwith this approach would be the entire original image.3 Prediction <strong>of</strong> Subjective <strong>Quality</strong>Subjective ratings from experiments are typically averagedinto a mean opinion score (MOS) which representsthe subjective quality <strong>of</strong> a particular image. On theother hand, the examined metrics relate to the objectiveimage quality and shall be used to predict perceivedimage quality automatically. In the sequel, exponentialfunctions are suggested for predicting the subjectivequality from the considered image quality metrics.3.1 System Under TestThe system under test comprised <strong>of</strong> a flat Rayleighfading channel in the presence <strong>of</strong> additive white Gaussiannoise (AWGN) along with hybrid automatic repeatrequest (H-ARQ) and a s<strong>of</strong>t-combining scheme.A (31, 21) Bose-Chaudhuri-Hocquenghem (BCH) codewas used for error protection purposes and binary phaseshift keying (BPSK) as modulation technique. Theaverage bit energy to noise power spectral density ratio(E b /N 0 ) was chosen as 5dB and the maximum number<strong>of</strong> retransmissions in the s<strong>of</strong>t-combining algorithm wasset to 4. These particular settings turned out to bebeneficial in generating impaired images and vide<strong>of</strong>rames with a wide range <strong>of</strong> artifacts. It should bementioned that these are the same settings that havebeen used in the derivation <strong>of</strong> the weights given inTable I.To obtain the MJ2 videos, a total <strong>of</strong> 100 consecutiveframes <strong>of</strong> uncompressed quarter common intermediateformat (QCIF) videos were compressed at a bit rate<strong>of</strong> 1bpp using the Kakadu s<strong>of</strong>tware [18]. No errorresiliencetools were used during source encoding anddecoding to get the full impact <strong>of</strong> the errors introducedby the channel. The MJ2 videos were then sent overthe channel and decompressed on the receiver side toobtain the QCIF videos. In Fig. 2 it can be seen thata wide range <strong>of</strong> distortions could be created. In orderto automatically quantify subjective quality <strong>of</strong> this type<strong>of</strong> impaired video frames in real-time, suitable qualitypredication functions are needed.3.2 Exponential Prediction FunctionThe selection <strong>of</strong> an exponential prediction functionfinds its support in the fact that the image qualitymetrics considered here relate to image distortion anddegradation <strong>of</strong> structural information. As such, a highlydistorted image would be expected to relate to a lowMOS while images with low structural degradationwould result in high MOS. A curve fitting <strong>of</strong> MOSvalues from subjective tests versus quality measure may
TABLE IIIPREDICTION PERFORMANCE∆ HIQM RRIQA SSIMPearson 0.896 0.769 0.599Spearman 0.887 0.677 0.461(a) Frame no. 2 (b) Frame no. 33(c) Frame no. 80 (d) Frame no. 89Fig. 2. Frame samples <strong>of</strong> the video “Highway drive” [19] aftertransmission over the wireless channel.TABLE IICURVE FITTING PARAMETERS∆ HIQM RRIQA SSIMa 96.15 109.1 14.93b −0.2975 −0.1817 1.662then be based on an exponential function leading to theprediction functionMOS QM = a e b·QM (5)where QM ∈ {∆ HIQM , RRIQA, SSIM} denotes therespective perceptual quality metric. The parameters aand b are obtained from the curve fitting and definethe exponential prediction function <strong>of</strong> the respectiveperceptual quality metric.Figs. 3 a-c show the MOS obtained for the 40 differentimage samples used in our subjective tests versusthe considered metrics ∆ HIQM , RRIQA, and SSIM, respectively.The parameters a and b <strong>of</strong> the correspondingexponential prediction function are given in Table II.The figures also show the 95% confidence intervalfrom which only a small scattering <strong>of</strong> image samplesaround the fitting curve is observed for ∆ HIQM whilelarger scattering and hence more prediction uncertaintyis noticed for the cases <strong>of</strong> RRIQA and SSIM.The prediction performance <strong>of</strong> the considered objectivequality metrics with respect to the subjectiveratings shall be characterized by the Pearson linearcorrelation coefficient and the Spearman rank order[20]. The Pearson linear correlation coefficient characterizesthe degree <strong>of</strong> scattering <strong>of</strong> data pairs around alinear function while the Spearman rank order measuresthe prediction monotonicity. For the purpose<strong>of</strong> calculating these prediction performance measures,the relationships between MOS and predicted scoresMOS QM with QM ∈ {∆ HIQM , RRIQA, SSIM} havebeen established using (5) and are shown in Fig. 4 a-c. The Pearson linear correlation coefficient and theSpearman rank order can be deduced from the datapairs shown in these figures and the results are reportedin Table III. It turns out that the prediction performance<strong>of</strong> ∆ HIQM outperforms RRIQA and SSIM in bothaccuracy and monotonicity.4 Simulation ResultsThe extensive simulations involved a wide range <strong>of</strong>video streams which were taken from the data baseprovided in [19]. The common findings from thesesimulations will be discussed in the sequel using arepresentative video stream. Specifically, the “Highwaydrive” video has been chosen to illustrate the ability <strong>of</strong>the considered measures in assessing perceptual qualityfor wireless video applications. The same wirelessscenario as described in Section 3 was used with thesimulations. The actual quality assessment has beenperformed on both the transmitted and received uncompressedQCIF videos. The exponential predictioncurve (5) with parameters a and b given in Table II wasused to translate the perceptual quality measures intopredicted mean opinion scores MOS QM . Finally, theMOS QM values were normalized to fall in the interval[0, 100]. The progression <strong>of</strong> the quality measures overthe 100 consecutive frames are shown in Fig. 5.It can be seen from the results shown in Fig. 5that ∆ HIQM very closely follows the assessment <strong>of</strong>the benchmark given by SSIM. In particular, ∆ HIQMclearly identifies the same frames as <strong>of</strong> perceptuallylower quality as those detected by SSIM and providesalso stable quality assessments for the frames that havegood quality. It is remarkable that this behavior canbe achieved without requiring reference frames at thereceiver as would be the case with SSIM. It shouldalso be noted that SSIM appears to overestimate theperceptual quality as is the case with frame number 89(see Fig. 2 d). Although this particular frame is clearlyindicated by both ∆ HIQM and SSIM as <strong>of</strong> reducedquality, the low value given by ∆ HIQM seems to moreaccurately reflect the severe quality degradation.As far as the comparison with the other reducedreferencemetric in terms <strong>of</strong> RRIQA is concerned,the proposed ∆ HIQM can much better differentiateamong perceptual quality levels while RRIQA appearsto be rather unstable. Therefore, ∆ HIQM would be thepreferred metric when it comes to applications for realtimequality assessment or the extraction <strong>of</strong> decisions
∆ HIQM(MOS)RRIQA (MOS)SSIM (MOS)PSNR (dB)1005001005001005001005000 10 20 30 40 50 60 70 80 90 100Frame numberFig. 5. Progression <strong>of</strong> the different quality metrics for the video “Highway drive” [19].perceptual quality assessment approaches.5 ConclusionsIn this paper, we examined the potential <strong>of</strong> perceptualimage quality metrics for quality assessment <strong>of</strong> MJ2video streams in the context <strong>of</strong> wireless channels. Thereduced-reference hybrid image quality metric has beenidentified as suitable for an extension from image tointra-frame coded video applications. The simulationresults have shown that ∆ HIQM outperforms RRIQAin both the overhead that is needed for representing thefeatures <strong>of</strong> MJ2 video frames and the quality predictionperformance.References[1] K. L. Baum, T. A. Kostas, P. J. Sartori, and B. K. Classon, “Performancecharacteristics <strong>of</strong> cellular systems with different linkadaptation strategies,” IEEE Trans. on Vehicular Technology,vol. 52, no. 6, pp. 1497–1507, Nov. 2003.[2] A. J. Goldsmith and S.-G. Chua, “Variable-rate variable-powerMQAM for fading channels,” IEEE Trans. on Communications,vol. 45, no. 10, pp. 1218–1230, Oct. 1997.[3] L. Hanzo, C. H. Wong, and M. S. Lee, Adaptive <strong>Wireless</strong>Transceivers. John Wiley & Sons, 2002.[4] S. Winkler, E. D. Gelasca, and T. Ebrahimi, “<strong>Perceptual</strong> qualityassessment for video watermarking,” in Proc. <strong>of</strong> IEEE Int. Conf.on Information Technology: Coding and Computing, Las Vegas,USA, Apr. 2002, pp. 90–94.[5] A. W. Rix, A. Bourret, and M. P. Hollier, “Models <strong>of</strong> humanperception,” Journal <strong>of</strong> BT Technology, vol. 17, no. 1, pp. 24–34, Jan. 1999.[6] “Method for objective measurements <strong>of</strong> perceived audio quality,”ITU-R, Rec. BS.1387-1, Dec. 2001.[7] “<strong>Perceptual</strong> evaluation <strong>of</strong> speech quality (PESQ), an objectivemethod for end-to-end speech quality assessment <strong>of</strong> narrowband telephone networks and speech codecs,” ITU-T, Rec.P.862, Feb. 2001.[8] F. Dufaux and T. Ebrahimi, “Motion JPEG2000 for wireless applications,”in Proc. <strong>of</strong> First Int. JPEG2000 Workshop, Lugano,Switzerland, July 2003.[9] T. M. Kusuma and H.-J. Zepernick, “A reduced-reference perceptualquality metric for in-service image quality assessment,”in IEEE Symposium on Trends in Communications, Bratislava,Slovakia, Oct. 2003, pp. 71–74.[10] Z. Wang, A. C. Bovik, and B. L. Evans, “Blind measurement<strong>of</strong> blocking artifacts in images,” in Proc. <strong>of</strong> IEEE Int. Conf. onImage Processing, vol. 3, Vancouver, Canada, Sept. 2000, pp.981–984.[11] Z. Wang, H. R. Sheikh, and A. C. Bovik, “No-referenceperceptual quality assessment <strong>of</strong> JPEG compressed images,” inProc. <strong>of</strong> IEEE Int. Conf. on Image Processing, vol. 1, Rochester,USA, Sept. 2002, pp. 477–480.[12] P. Marziliano, F. Dufaux, S. Winkler, and T. Ebrahimi, “A noreferenceperceptual blur metric,” in Proc. <strong>of</strong> IEEE Int. Conf.on Image Processing, vol. 3, Rochester, USA, Sept. 2002, pp.57–60.[13] S. Saha and R. Vemuri, “An analysis on the effect <strong>of</strong> imagefeatures on lossy coding performance,” IEEE Signal ProcessingLetters, vol. 7, no. 5, pp. 104–107, May 2000.[14] A. R. Weeks, Fundamentals <strong>of</strong> Electronic Image Processing.SPIE Optical Engineering Press, 1996.[15] “Methodology for the subjective assessment <strong>of</strong> the quality <strong>of</strong>television pictures,” ITU-R, Rec. BT.500-11, 2002.[16] Z. Wang and E. P. Simoncelli, “Reduced-reference image qualityassessment using a wavelet-domain natural image statisticmodel,” in Proc. <strong>of</strong> SPIE Human Vision and Electronic Imaging,vol. 5666, Mar. 2005, pp. 149–159.[17] Z. Wang, A. C. Bovik, H. R. Sheikh, and E. P. Simoncelli,“Image quality assessment: From error visibility to structuralsimilarity,” IEEE Trans. on Image Processing, vol. 13, no. 4,pp. 600–612, Apr. 2004.[18] D. Taubman. (2005) Kakadu s<strong>of</strong>tware: A comprehensiveframework for JPEG2000. [Online]. Available:http://www.kakadus<strong>of</strong>tware.com[19] Arizona State University, <strong>Video</strong> Traces Research Group. (2005)QCIF sequences c○Acticom GmbH. [Online]. Available:http://trace.eas.asu.edu/yuv/qcif.html[20] S. Winkler, Digital <strong>Video</strong> <strong>Quality</strong> - Vision Models and Metrics.John Wiley & Sons, 2005.