Wave experiments using low-cost 40 kHz ultrasonic transducers
Wave experiments using low-cost 40 kHz ultrasonic transducers
Wave experiments using low-cost 40 kHz ultrasonic transducers

Create successful ePaper yourself
Turn your PDF publications into a flip-book with our unique Google optimized e-Paper software.
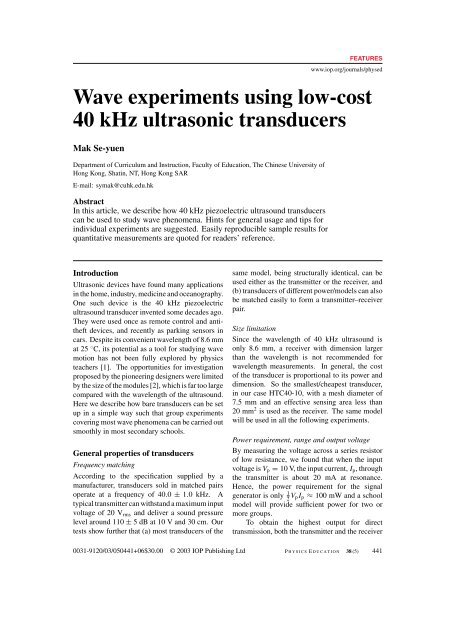
FEATURESwww.iop.org/journals/physed<strong>Wave</strong> <strong>experiments</strong> <strong>using</strong> <strong>low</strong>-<strong>cost</strong><strong>40</strong> <strong>kHz</strong> <strong>ultrasonic</strong> <strong>transducers</strong>Mak Se-yuenDepartment of Curriculum and Instruction, Faculty of Education, The Chinese University ofHong Kong, Shatin, NT, Hong Kong SARE-mail: symak@cuhk.edu.hkAbstractIn this article, we describe how <strong>40</strong> <strong>kHz</strong> piezoelectric ultrasound <strong>transducers</strong>can be used to study wave phenomena. Hints for general usage and tips forindividual <strong>experiments</strong> are suggested. Easily reproducible sample results forquantitative measurements are quoted for readers’ reference.IntroductionUltrasonic devices have found many applicationsin the home, industry, medicine and oceanography.One such device is the <strong>40</strong> <strong>kHz</strong> piezoelectricultrasound transducer invented some decades ago.They were used once as remote control and antitheftdevices, and recently as parking sensors incars. Despite its convenient wavelength of 8.6 mmat 25 ◦ C, its potential as a tool for studying wavemotion has not been fully explored by physicsteachers [1]. The opportunities for investigationproposed by the pioneering designers were limitedby the size of the modules [2], which is far too largecompared with the wavelength of the ultrasound.Here we describe how bare <strong>transducers</strong> can be setup in a simple way such that group <strong>experiments</strong>covering most wave phenomena can be carried outsmoothly in most secondary schools.General properties of <strong>transducers</strong>Frequency matchingAccording to the specification supplied by amanufacturer, <strong>transducers</strong> sold in matched pairsoperate at a frequency of <strong>40</strong>.0 ± 1.0 <strong>kHz</strong>. Atypical transmitter can withstand a maximum inputvoltage of 20 V rms and deliver a sound pressurelevel around 110 ± 5 dB at 10 V and 30 cm. Ourtests show further that (a) most <strong>transducers</strong> of thesame model, being structurally identical, can beused either as the transmitter or the receiver, and(b) <strong>transducers</strong> of different power/models can alsobe matched easily to form a transmitter–receiverpair.Size limitationSince the wavelength of <strong>40</strong> <strong>kHz</strong> ultrasound isonly 8.6 mm, a receiver with dimension largerthan the wavelength is not recommended forwavelength measurements. In general, the <strong>cost</strong>of the transducer is proportional to its power anddimension. So the smallest/cheapest transducer,in our case HTC<strong>40</strong>-10, with a mesh diameter of7.5 mm and an effective sensing area less than20 mm 2 is used as the receiver. The same modelwill be used in all the fol<strong>low</strong>ing <strong>experiments</strong>.Power requirement, range and output voltageBy measuring the voltage across a series resistorof <strong>low</strong> resistance, we found that when the inputvoltage is V p = 10 V, the input current, I p , throughthe transmitter is about 20 mA at resonance.Hence, the power requirement for the signalgenerator is only 1 2 V pI p ≈ 100 mW and a schoolmodel will provide sufficient power for two ormore groups.To obtain the highest output for directtransmission, both the transmitter and the receiver0031-9120/03/050441+06$30.00 © 2003 IOP Publishing Ltd P HYSICS E DUCATION 38 (5) 441
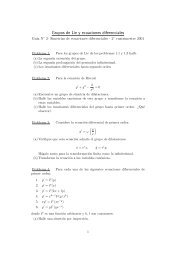
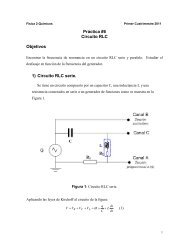
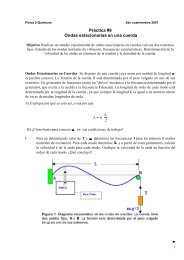
Mak Se-yuenreflections from the signal generator and the CRO,both bits of apparatus should be kept at least 50 cmaway from the path of propagation. A shuntresistor, of the order of 10 k, connected acrossthe receiver will filter out unwanted 50 Hz noisefrom the mains.Figure 1. A simple set-up <strong>using</strong> a pair of bare <strong>40</strong> <strong>kHz</strong><strong>transducers</strong>.are placed on the bench facing one another. Inthis way, the bench acts as a Lloyd’s mirror [3],generating a pressure antinode all the way alongthe line of transmission on the bench surface. Theoutput signal of the receiver at resonance, 1 maway from the transmitter, gives a CRO displayof V pp ≈ 80 mV.Set-up precautionsWith the exception of foc<strong>using</strong> <strong>experiments</strong> <strong>using</strong>spherical lenses and mirrors, all <strong>experiments</strong> willbe carried out with the transmitter fixed to thebench with Blu-Tack and the receiver attachedto a small weight (figure 1) sufficiently heavy toprevent turning and sliding caused by the twistingof connecting cables. To prevent unwantedExperimentsFinding the resonance frequency of thetransducerConnect the circuit as shown in figure 2. Thetransmitter is driven by a signal generator withan output voltage set at 6.0 V rms and frequencyin the range 10 <strong>kHz</strong> to 100 <strong>kHz</strong>. The receiver isheld facing the transmitter about 50 cm away. It isconnected to a CRO at some convenient settings,say, e.g., 0.5 V cm −1 and 10 µscm −1 .To find the resonance frequency, the finefrequency control dial of the signal generatoris adjusted until a maximum voltage trace isdisplayed on the CRO screen. In the absence ofmechanical defects in the <strong>transducers</strong>, resonancenormally happens at <strong>40</strong> <strong>kHz</strong> with a tolerance nobigger than that specified. The period can beread directly from the on-screen trace, which issinusoidal irrespective of the triggering waveform.Timebase10 µs cm –1V 1GainY 1shiftSignalgenerator1 Vcm –1Channel 1TransmitterReceiver andshunt resistorFigure 2. Determination of the resonance frequency of the transducer. (The transmitter and the receiver arerepresented by different symbols but they are identical in structure.)442 P HYSICS E DUCATION September 2003
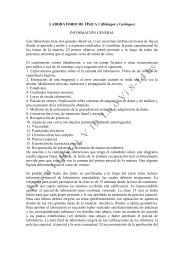
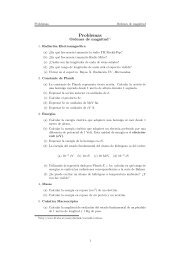
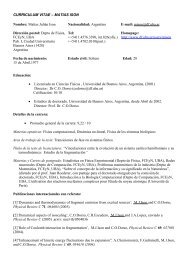
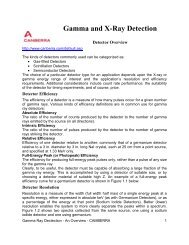
<strong>Wave</strong> <strong>experiments</strong> <strong>using</strong> <strong>low</strong>-<strong>cost</strong> <strong>40</strong> <strong>kHz</strong> <strong>ultrasonic</strong> <strong>transducers</strong>Plane reflectorTransmitter (fixed)Movable receiverTransmitterirReceiverTo SGTo CROConcavemirror30 cmTo SGTo CRO(a)(b)Figure 3. (a) Reflection by a flat surface. (b) Reflection by a concave mirror.Reflection by plane/concave mirrorTo show the law of reflection (figure 3(a)), apartially collimated ‘beam’ can be obtained byattaching a small paper cone to the opening of eachtransducer. Any flat vertical surface can be usedas the reflector. Maximum reception is observedwhen i ≈ r.Like the 2.8 cm microwave, ultrasound canbe focused by a giant concave mirror. Whenin use, both <strong>transducers</strong> should be placed on themirror axis and facing the mirror. The receiver ismoved along the axis until a maximum is detected(figure 3(b)). Lloyd’s reflection from the benchsurface has little effect in this experiment becausethe converging signal comes mainly from themirror.(a)Refraction by a ‘lens’A ‘skinless’ condom-balloon 1 about 20 cm indiameter filled with liquid petroleum gas 2 (LPG)can be used as a converging lens. The arrangementand procedure are similar to that in the mirror setup.Figure 4 shows the CRO trace with and withoutthe lens.Diffraction through a single slitFigure 5 shows an arrangement to show qualitativelythe diffraction of ultrasound througha5cmslit. The source is placed about 50 cm behindthe slit and the detector 25 cm in front. Thecentral maximum can be found near the axis of1 A condom-balloon is used instead of a rubber balloonbecause the ultrasound generated by a SG–transmittercombination available in most schools is not powerful enoughto penetrate the skin of an inflated rubber balloon.2 LPG is used instead of CO 2 because the latter leaks rapidly ina condom. Moreover, LPG is acoustically denser and producesa better converging effect than CO 2 .(b)Figure 4. (a) Refraction and foc<strong>using</strong> by a LPG lens.(b) Same arrangement without the lens.symmetry with secondary maxima and minima intwo ‘shaded’ regions. Attaching the receiver to astraight rule, which can slide against a fixed ruleon the bench, will minimize disturbances by hand.Young’s interference <strong>experiments</strong>Young’s experiment can be carried out <strong>using</strong> adouble source (figure 6(a)), a single source withSeptember 2003 P HYSICS E DUCATION 443
Mak Se-yuenRegions where secondary maximaand minima can be detectedTransmitterReceiverFixed ruleTo CROTo SGSliding ruleFigure 5. Qualitative demonstration of diffraction through a single slit.To SGdPair oftransmittersLReceiverTo CRO(a)TransmitterTo SGd/2LReceiverTo CROImage oftransmitterVertical reflector as Lloyd’s mirror(b)Figure 6. (a) Young’s double source. (b) Young’s experiment <strong>using</strong> one transmitter and a Lloyd’s mirror.a Lloyd’s mirror (a flat vertical surface at least30 cm long, figure 6(b)) or a double slit. The traceamplitude and fringe separations obtained fromthe first two methods are sufficiently distinct forquantitative measurement of the wavelength. Atypical data set is as fol<strong>low</strong>s:• Source separation, d = 10.0 ± 0.5cm• Distance between midpoint of sources anddetector, L = 44 ± 0.4 cm• Fringe separation, x = 3.8 ± 0.2 cm• Angular fringe separation,θ ≈ x/L = 0.086 ± 0.006• <strong>Wave</strong>length, λ = d sin θ = 0.86 ± 0.06 cmAmplitude modulationAmplitude modulation can be done if the outputtransducer is driven by a signal generator equippedwith such a function. The transmitted range is overa metre when a CRO is used to display a periodicmodulated signal, but limited to only a fewcentimetres if a <strong>low</strong>-power amplifier–loudspeakeris used to play music.Music transmitted by a waveguideThe range of audio-signal transmission can beincreased to about 1.0 m by feeding the ultrasoundwave into one end of a 1.5 cm bore air-pipe with444 P HYSICS E DUCATION September 2003
<strong>Wave</strong> <strong>experiments</strong> <strong>using</strong> <strong>low</strong>-<strong>cost</strong> <strong>40</strong> <strong>kHz</strong> <strong>ultrasonic</strong> <strong>transducers</strong>Amplifier/speakerAudio equipmentAMSGTransmitterAir pipeReceiverGe diodeFigure 7. Transmission of an audio signal <strong>using</strong> a waveguide.PlanereflectorSignalgeneratorTransmitterReceiverChannel 1 Channel 2Straight ruleFigure 8. Determination of wavelength by a stationary wave method.the receiver placed a few mm from the other end(figure 7). In this way, a standing wave is set upinside the pipe and a local pressure antinode iscreated at the diaphragm of the pick-up transducer.By slightly adjusting the position of the receiver,the speaker can respond to a rectified audio signaleven when the pipe is bent. The method oftransmitting audio information by an air-pipe isactually used in some monophonic earphones andpublic address systems.<strong>Wave</strong>length and speed measurementA standing wave in free space. A standing wavecan be set up by directing a beam of ultrasoundtowards a vertical plane reflector (figure 8).If the receiver is moved s<strong>low</strong>ly and smoothlytowards or away from the reflector, the amplitudeof the CRO trace will vary periodically andrepeatedly every time the receiver traverses adistance of half a wavelength (λ/2 = node-tonodeseparation ≈ 4.3 mm). The same result canbe obtained by moving the reflector while keepingthe receiver stationary.Phase shift of a progressive wave. Theexperiment is best carried out <strong>using</strong> a dualtraceCRO with the transmitter (T) connectedto channel 1 and the receiver (R) to channel 2(figure 9). The T signal should be the triggersource if the CRO can display only the R trace.In any case, the xy mode can also be used insteadof the trigger sweep mode and Lissajous’ figureswould be observed.When R is moved towards or away fromT a distance of one wavelength λ, a change inphase of 2π is observed in the R trace. Soby counting the number (n) of complete wavesof trace 2 passing trace 1 and the distance (d)moved by R, the wavelength of the wave can bedetermined. A typical result would be n = 10 andd = 8.6 ± 0.5 cm, givingλ = L n= 0.86 ± 0.05 cm.September 2003 P HYSICS E DUCATION 445