Import Share Of U.S. Food Consumption Stable At 11 Percent
Import Share Of U.S. Food Consumption Stable At 11 Percent
Import Share Of U.S. Food Consumption Stable At 11 Percent
You also want an ePaper? Increase the reach of your titles
YUMPU automatically turns print PDFs into web optimized ePapers that Google loves.
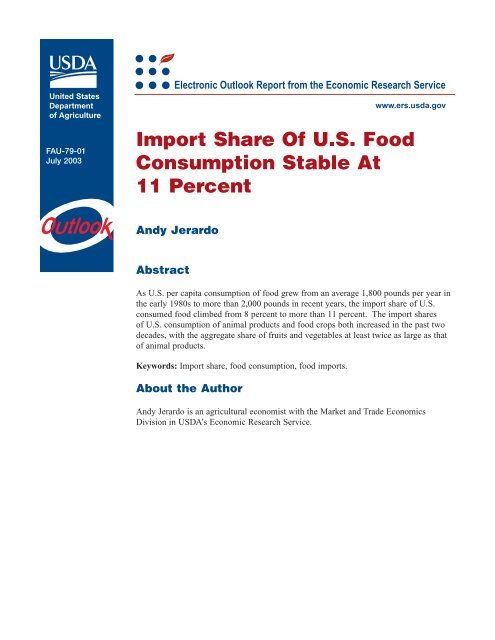
United StatesDepartmentof AgricultureFAU-79-01July 2003Electronic Outlook Report from the Economic Research Servicewww.ers.usda.gov<strong>Import</strong> <strong>Share</strong> <strong>Of</strong> U.S. <strong>Food</strong><strong>Consumption</strong> <strong>Stable</strong> <strong>At</strong><strong>11</strong> <strong>Percent</strong>Andy JerardoAbstractAs U.S. per capita consumption of food grew from an average 1,800 pounds per year inthe early 1980s to more than 2,000 pounds in recent years, the import share of U.S.consumed food climbed from 8 percent to more than <strong>11</strong> percent. The import sharesof U.S. consumption of animal products and food crops both increased in the past twodecades, with the aggregate share of fruits and vegetables at least twice as large as thatof animal products.Keywords: <strong>Import</strong> share, food consumption, food imports.About the AuthorAndy Jerardo is an agricultural economist with the Market and Trade EconomicsDivision in USDA’s Economic Research Service.
The New American DietU.S. per capita food consumption grew from about1,800 pounds per year in the early 1980s to more than2,000 pounds in 2000. In this period, the average shareof imports in U.S. food consumption climbed fromapproximately 8 percent to more than <strong>11</strong> percent.While the average U.S. resident consumed 20 percentmore fruits, vegetables, and cereals over the past twodecades, consumption of animal products increased byonly 7 percent. In 2001, the U.S. import share of consumptionfor animal products was 4.6 percent, whilethe share for crops and products was 16 percent. Theseshares are up from 3.4 and 10 percent, respectively, inthe early 1980s.A gradual rise in the share of food crops and productsand a decline in the share of meat and dairy productsin U.S. food consumption occurred in the past 20years. In 2000, crops and products made up 57 percentof the average U.S. diet, and animal products comprisedthe remaining 43 percent. These relative shareswere 54 and 46 percent, respectively, in 1981.Specifically, U.S. per capita consumption of red meatfell from more than 9 percent of the average U.S. dietin the 1980s to less than 8 percent in recent years.Dairy products declined from 30 to 28 percent in thesame period. On the other hand, the consumptionshare of vegetables rose from 19 percent to 21 percent,and grain cereals went up from 8 to 9.5 percent in thatperiod. Clearly, the perceived health-related benefits ofmore plant fiber and less animal fat in diets shaped thepattern of U.S. food consumption. These long-termtrends, moreover, tend to favor more imports of foreignfood products, e.g., due to higher off-season fruitdemand.Summary import shares of U.S. food consumption 1Average Average Average Average1981-85 1986-90 1991-95 1996 1997 1998 1999 2000 2001 1997-2001<strong>Percent</strong>Average import share oftotal food consumed 7.8 8.6 9.4 10.4 10.9 <strong>11</strong>.2 <strong>11</strong>.2 <strong>11</strong>.1 <strong>11</strong>.2 <strong>11</strong>.1Animal products 2 3.4 3.7 3.5 3.5 3.6 4.4 4.5 4.5 4.6 4.3Red meat 6.7 8.1 7.3 6.4 7.1 7.7 8.2 8.9 9.3 8.2Dairy products 1.9 1.8 1.9 2.0 1.9 2.9 2.9 2.7 2.8 2.6Fish and shellfish 50.9 56.0 56.0 58.5 62.1 64.7 68.1 68.3 68.2 66.3Animal fat 1.0 1.6 3.5 3.6 5.9 5.5 5.9 6.9 2.6 5.4Crops and products 3 <strong>11</strong>.5 12.6 13.9 15.6 16.3 16.3 16.3 16.2 16.4 16.3Fruits, juices and nuts 14.1 17.9 17.0 16.9 18.8 18.4 21.0 21.9 21.4 20.3Vegetables 4.7 6.0 5.9 7.8 7.9 9.0 9.0 8.7 9.4 8.8Vegetable oils 15.5 17.6 17.4 19.3 19.4 16.3 16.9 18.3 15.5 17.3Grain products 1.1 2.3 4.8 3.9 5.8 5.3 5.3 4.6 4.9 5.2Sweeteners and candy 21.6 <strong>11</strong>.9 10.8 15.2 16.1 12.9 <strong>11</strong>.0 9.8 9.7 <strong>11</strong>.91 Calculated from units of weight, weight equivalents, or content weight.2 <strong>Import</strong> shares of poultry and eggs are negligible, but accounted for. Red meats are estimated from carcass weights.3 Includes coffee, cocoa, and tea whose import shares are 100 percent; also includes wine and beer.2 Economic Research Service, USDA
Factors That Influence U.S. <strong>Food</strong> <strong>Import</strong>sThe import share of a food product is the ratio of itsimported volume to total volume consumed.Year-to-year effects on the demand for food importsinclude short-term changes in domestic food supply,the cost of imported food, and taste preferences, suchas for food fads. Longer term factors that drive importdemand include income growth, a sustained exchangerateappreciation, and changes in diet that increase thedemand for food products not readily available in largequantities in the United States, particularly tropicalfruits and crops not available during the off-season.Among the fastest growing U.S. food imports are redmeats, fish, and shellfish. <strong>Import</strong>s of vegetables suchas bell and chili peppers, tomatoes, cucumbers, asparagus,onions, and olives have also risen significantlysince 1990. Further, the import shares of fruits, wheat,rice, candy, wine, and beer jumped dramatically asU.S. tastes shifted. More reliable supplies from foreignsources, particularly during the off-season, improvedshipping and storage technology; and wider U.S. ethnicdiet preferences contributed to these import trendsover time.Helping drive the sharp rise in import share of U.S.-consumed foods from 1996 to 2001 were the robustU.S. economy and the strong dollar. The increase inthe import share of red meats from 6.5 percent of redmeat consumption to more than 9 percent (in carcassweight) during this period was also due to widespreadliquidation of the U.S. cattle herd, which cut thedomestic supply of processing beef. Also, the economicrecession in many Asian countries divertedAustralian and New Zealand meat to the U.S. market.The phased lifting of tariffs on Mexican fruit and vegetableexports to the United States as mandated by theNorth American Free Trade Agreement induced growersin Mexico to ship more of their produce across theU.S. border. Mexico is now the source of 27 percent ofU.S. fruit imports and 38 percent of vegetable imports.Tomatoes and bell and chili peppers lead vegetableimports from Mexico. <strong>Of</strong>f-season fruit imports fromChile and Argentina, and vegetable imports from Peru,Ecuador, and other South American countries are drivingup overall U.S. import shares of these crops. LatinAmerican countries supply an additional 40 percent ofU.S. imported fruits (in weight terms), chieflybananas, grapes, and melons.Economic Research Service, USDA 3
<strong>Food</strong> <strong>Import</strong> Growth PatternsAlthough U.S. per capita consumption of red meatdropped from an average 175 pounds per year in theearly 1980s to 164 pounds in 2000, the import share ofpork rose from 3 to 5 percent, and import share forlamb meat quadrupled between those years. Fish andshellfish import share reached 68 percent in 2001, upfrom 45 percent in 1980. Even beef's import share rosefrom 8 to <strong>11</strong>.6 percent from 1996 to 2001.The import share of fresh fruits also more than doubledfrom 9 percent in 1985 to 23 percent in 2001.Among the fastest growing are avocados, mangos,melons, grapes, and pears. For fruit juices—mainlyorange, apple, and grape—overall import share rosefrom <strong>11</strong>.6 to 32 percent in the past two decades.Among tree nuts, 49 percent of which were importedin 2001 versus only 27 percent in 1985, the importshare of pecans shot up from 1.5 percent to 17 percent.Equally dramatic growth in import share of vegetablesoccurred since 1985. For fresh and frozen vegetablesas a group, the share doubled from 8 percent to 17 percentin 2001. Tomatoes' import share reached 36 percentin 2001, up from only 21 percent in 1990.Asparagus' share almost quadrupled from 16 percentto 60 percent. For olives (processed), the respectiveshares are 43 to 60 percent. And for artichokes andspices, the corresponding estimates more than doubled.From less than 1-percent import share in 1980, wheatand rice expanded significantly to <strong>11</strong> percent in 2001.Also, the import share of confectionery products quintupled,as did malt beverages. <strong>Import</strong> shares fell forcheese, vegetable oils, and sugar.These overall rising trends in import shares of majorfoods are largely demand-driven, by both per capitaU.S. income growth and the appreciation of the dollarover the past decade. <strong>At</strong> the same time, the need forexport earnings has likewise induced foreign producersto supply the large U.S. market.4 Economic Research Service, USDA
<strong>Import</strong> share of U.S. food consumptionAverageimports,Selected items 1980 1985 1990 1995 1996 1997 1998 1999 2000 2001 1999-2000<strong>Percent</strong>$ millionBeef 8.7 8.0 9.7 8.1 7.9 9.0 9.9 10.6 <strong>11</strong>.0 <strong>11</strong>.6 2,151.3Pork 3.3 7.1 5.6 3.7 3.7 3.8 3.9 4.4 5.2 5.1 633.2Lamb 9.5 9.4 10.2 18.4 21.7 25.0 31.2 31.3 36.6 39.8 206.7Fish and shellfish 45.3 53.8 56.3 55.3 58.5 62.1 64.7 68.1 68.3 68.2 9,341.1Fresh and frozen 56.8 62.8 65.8 66.0 70.6 74.3 76.6 78.5 81.7 83.3 N.A.Canned 21.8 34.9 36.0 30.8 29.8 33.0 36.1 43.8 38.4 35.7 N.A.Dairy products 1.7 2.0 1.9 1.9 2.0 1.9 2.9 2.9 2.7 2.8 1,650.7Cheese 5.8 5.6 4.8 4.7 4.5 4.1 4.5 5.3 4.8 5.1 706.5Fruits--fresh andfrozen 5.8 9.0 13.2 15.6 16.9 18.0 19.5 21.5 22.3 23.1 2,028.5Citrus, fresh 2.1 3.1 3.6 7.3 6.7 7.5 8.2 13.6 <strong>11</strong>.8 12.5 220.4Non-citrus, fresh 7.3 10.9 16.0 18.2 20.2 21.6 23.3 23.4 25.3 26.4 1,808.1Apples 4.0 5.9 4.3 6.1 7.7 7.3 7.0 6.6 7.2 7.0 99.6Avocados 1.6 1.6 7.3 <strong>11</strong>.6 12.0 14.1 18.4 31.0 26.0 29.8 83.3Grapes 12.6 29.6 41.1 41.8 37.8 41.9 42.8 43.1 44.3 44.5 548.4Melons 10.5 9.7 15.4 17.2 18.8 22.4 25.3 23.6 26.2 24.1 276.7Pears 3.4 6.8 <strong>11</strong>.4 <strong>11</strong>.6 14.1 20.9 16.0 21.1 21.2 20.6 77.2Strawberries 22.1 10.0 13.0 12.3 10.6 8.5 10.1 14.3 10.8 <strong>11</strong>.3 85.5Fruits--processed 1.7 2.2 2.6 2.8 2.8 2.8 2.7 3.2 3.3 3.3 681.2Fruit juices <strong>11</strong>.6 50.4 48.7 27.2 27.2 32.8 28.9 34.9 31.9 31.5 734.4Orange juice 8.9 55.4 56.1 19.3 15.1 20.5 17.1 21.6 20.8 17.4 238.1Apple juice 19.3 60.3 58.0 52.1 53.5 62.2 63.3 60.3 61.6 63.4 239.9Grape juice 2.0 <strong>11</strong>.3 33.7 21.5 47.7 62.1 29.9 55.0 39.3 41.1 64.8Tree nuts 25.6 26.8 35.7 34.1 43.9 44.5 42.0 46.8 39.3 48.9 718.2Pecans 0.3 1.5 8.7 25.7 27.3 21.9 21.7 23.4 24.5 17.2 68.3Wine 20.7 23.1 13.0 15.8 18.8 23.0 20.7 20.0 21.4 22.6 2,191.9Vegetables--fresh,frozen 5.9 8.0 9.6 <strong>11</strong>.2 13.6 13.3 15.5 14.7 14.0 16.6 2,793.4Asparagus 10.8 16.2 29.8 53.3 48.8 49.3 54.4 57.0 59.0 59.7 <strong>11</strong>7.9Cucumbers 36.0 36.3 33.7 38.3 42.9 38.1 40.2 39.7 42.4 44.2 169.2Onions 5.5 8.7 10.1 10.2 12.6 <strong>11</strong>.2 <strong>11</strong>.9 <strong>11</strong>.4 9.3 12.3 146.4Peppers, bell 26.5 23.7 19.7 19.1 19.8 22.5 24.8 24.4 22.2 26.0 428.2Potatoes 1.9 3.7 5.8 5.2 7.3 5.8 8.2 6.9 6.0 5.0 408.6Squash N.A. N.A. 19.8 24.3 29.4 29.3 30.0 29.3 27.2 N.A. <strong>11</strong>7.9Tomatoes 22.3 24.0 20.5 30.5 34.6 35.8 38.6 32.8 32.4 35.5 692.2Vegetables--processed 1.7 3.3 1.9 1.7 1.5 1.8 1.8 2.2 1.8 2.0 1,996.9Artichokes 20.6 23.2 25.7 39.0 42.5 41.9 50.4 46.3 47.9 48.6 66.4Mushrooms 31.3 30.8 24.3 35.3 26.0 34.0 36.5 24.7 36.7 35.3 <strong>11</strong>3.9Olives 21.8 43.7 47.0 60.0 37.1 56.0 67.0 50.2 78.8 60.1 192.8Vegetable oils 16.9 20.1 16.5 16.8 19.3 19.4 16.3 16.9 18.3 15.5 1,359.2Olive oil 1 96.6 98.2 103.1 109.6 106.5 105.9 104.9 104.4 104.9 105.0 384.2Canola oil 1 100.0 100.0 105.4 87.5 97.5 98.1 85.5 81.7 69.7 76.5 250.5Economic Research Service, USDA 5
<strong>Import</strong> share of U.S. food consumption—continuedAverageimports,Selected items 1980 1985 1990 1995 1996 1997 1998 1999 2000 2001 1999-2000<strong>Percent</strong>$ millionSpices 4.8 7.3 7.7 6.4 8.4 8.9 10.3 13.1 14.3 15.4 66.8Wheat 0.3 2.1 4.1 6.9 9.3 9.4 10.4 9.3 8.7 10.7 252.3Rice 0.3 3.4 5.1 7.2 10.3 9.0 9.4 8.3 9.4 <strong>11</strong>.0 178.6Barley 3.3 3.5 7.7 23.7 21.4 23.4 17.5 16.1 17.0 13.9 79.8Cane and beetsugar 45.4 34.9 29.9 19.6 29.3 28.4 22.0 18.2 16.4 15.5 542.3Confectioneryproducts 5.4 20.9 17.1 14.2 16.2 18.6 22.7 26.5 28.7 27.3 732.2Malt beverages 2.6 4.2 4.5 5.8 6.5 7.2 8.3 9.0 9.9 10.7 2,095.7N.A. = Not available.1 When some imports are re-exported and consumption falls below import levels, import share exceeds 100 percent.Source: Economic Research Service, USDA.6 Economic Research Service, USDA


