- Page 6 and 7: 4.3 Design of Power Distribution Po
- Page 8 and 9: 6.6 Conclusions and Future Work ...
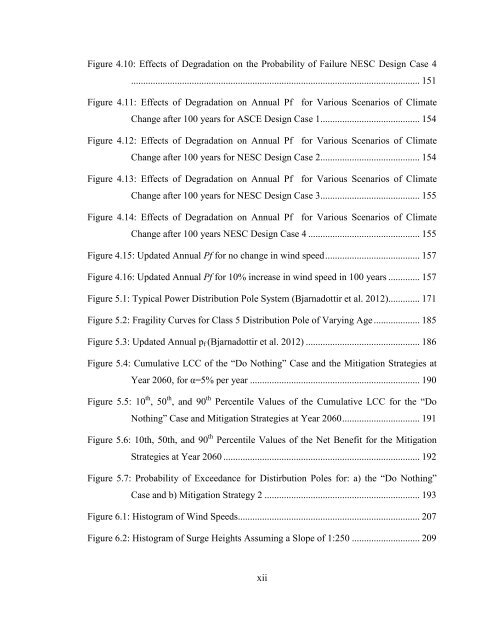
- Page 10 and 11: List of FiguresFigure 1.1:Simulatio
- Page 14 and 15: List of TablesTable 2.1: Percentage
- Page 16 and 17: PrefaceThe research presented in th
- Page 18 and 19: AcknowledgementsI would like to sta
- Page 20 and 21: AbstractStudies are suggesting that
- Page 22 and 23: Chapter 1__________________________
- Page 24 and 25: 1.1 Literature Review and Critical
- Page 26 and 27: assumed, between now and 2080, it c
- Page 28: due to climate change. Similar rese
- Page 33 and 34: The "peaks-over-threshold" method i
- Page 35 and 36: Hurricane vulnerability models deve
- Page 37 and 38: vulnerability of structures to dama
- Page 39 and 40: purchase insurance to protect again
- Page 41 and 42: 1.1.4 Hurricane Risk for Power Dist
- Page 43 and 44: for both the potential impacts of c
- Page 45 and 46: where Q is air density factor, k i
- Page 47 and 48: degradation due to the ageing of ut
- Page 49: aspects of climate change and may n
- Page 52 and 53: • Climatic adaptation should be d
- Page 54 and 55: surge height model, and hurricane v
- Page 56 and 57: that assesses the cost-effectivenes
- Page 58 and 59: Dagher, H.J., Lu, Q., and Peyrot, A
- Page 60 and 61: Grigg, N.S, and Helweg, O.J. (1975)
- Page 62 and 63:
Knuston, T.R., McBride, J.L., Chan,
- Page 64 and 65:
Mitsuta, Y., Fujii, T., and Nagashi
- Page 66 and 67:
Rumpf, J., Weindl, H., Hoppe, P., R
- Page 68 and 69:
USACE (1970) Guidelines for Flood I
- Page 70 and 71:
Chapter 2__________________________
- Page 72 and 73:
devastating effect of Hurricane Kat
- Page 74 and 75:
There is a great uncertainty, both
- Page 76 and 77:
they can be incorporated into the f
- Page 78 and 79:
These are increases of 15.9% and 35
- Page 80 and 81:
50% greater than the house replacem
- Page 82 and 83:
wind speed of 5% with COV of 0.50 i
- Page 84 and 85:
different exposure sites, differenc
- Page 86 and 87:
damage costs can be reduced by arou
- Page 88 and 89:
3. Strengthening a percentage of co
- Page 90 and 91:
1.201.00Net Benefit, E b ($ billion
- Page 92 and 93:
2.001.50Net Benefit, E b ($ billion
- Page 94 and 95:
Figure 2.11 shows adaptation strate
- Page 96 and 97:
ecause of the sheer number of housi
- Page 98 and 99:
An increase of 5% and 10% in wind s
- Page 100 and 101:
the reduction factor (50% or 80%),
- Page 102 and 103:
[22] AGO. An Assessment of the Need
- Page 104 and 105:
[42] Pinelli JP, Torkian BB, Gurley
- Page 106 and 107:
3.1 AbstractThis paper presents a f
- Page 108 and 109:
over the last 100 years. For exampl
- Page 110 and 111:
these peaks have a Poisson arrival
- Page 112 and 113:
The parameters in Table 3.1 are imp
- Page 114 and 115:
3.5 Regional Loss Estimation Consid
- Page 116 and 117:
where j represents the exposure sit
- Page 118 and 119:
3.6.1 Annual Regional Loss Estimati
- Page 120 and 121:
wind or frequency) is 0.0260, 0.020
- Page 122 and 123:
increasing the frequency of hurrica
- Page 124 and 125:
Figure 3.3: Cumulative Damage Costs
- Page 126 and 127:
eplacement house value is $98,000,
- Page 128 and 129:
that the sea level rise may vary al
- Page 130 and 131:
Table 3.8: Combined Hurricane Damag
- Page 132 and 133:
Figure 3.6: Percentage Change in Da
- Page 134 and 135:
Hanover County, and $120 million pe
- Page 136 and 137:
Bjarnadottir, S., Li, Y. and Stewar
- Page 138 and 139:
Johnson, B. (2005) After the Disast
- Page 140 and 141:
National Cooperative Highway Resear
- Page 142 and 143:
Structural Engineers- Proc. Structu
- Page 144 and 145:
Chapter 4__________________________
- Page 146 and 147:
customers in New Orleans, Louisiana
- Page 148 and 149:
Southern pine is the most common ma
- Page 150 and 151:
type of load being designed for. Di
- Page 152 and 153:
Figure 4.2: Flowchart of the Design
- Page 154 and 155:
a(t) = π (D − 32 d(t))3 (4.6)whe
- Page 156 and 157:
3025Decay Depth (mm)201510500 5 10
- Page 158 and 159:
eliability of the pole, while the p
- Page 160 and 161:
f v (V, t) = α(t)u(t) ∙ Vu(t)
- Page 162 and 163:
Table 4.2: Design Variables and Val
- Page 164 and 165:
The wind load for the poles is dete
- Page 166 and 167:
parameters. Fragility curves are de
- Page 168 and 169:
4.6.3 Effect of Degradation on P fT
- Page 170 and 171:
2 and 3. This is attributed to the
- Page 172 and 173:
10.9Probability of Failure0.80.70.6
- Page 174 and 175:
Table 4.8: Annual P f for Design Ca
- Page 176 and 177:
0.250.20P f0.150.100.0550 years30 y
- Page 178 and 179:
Updated Annual P f1.00.90.80.70.60.
- Page 180 and 181:
4.7 ConclusionsThis paper proposes
- Page 182 and 183:
Bhuyan, G., and Li, H. (2006) Achie
- Page 184 and 185:
Kwasinski, A., Weaver, W.W., Chapma
- Page 186 and 187:
Vanderbilt, M D., Criswell, M.E., F
- Page 188 and 189:
Chapter 5__________________________
- Page 190 and 191:
(Johnson 2005). Hurricane Andrew, i
- Page 192 and 193:
Figure 5.1: Typical Power Distribut
- Page 194 and 195:
where R(t) is the actual capacity o
- Page 196 and 197:
speeds than poles located further i
- Page 198 and 199:
eplacement in these exposure catego
- Page 200 and 201:
the larger pole and therefore a low
- Page 202 and 203:
that specified by the U.K. is used
- Page 204 and 205:
Table 5.2: Statistics for Wind Load
- Page 206 and 207:
Figure 5.2: Fragility Curves for Cl
- Page 208 and 209:
initial strength of Class 5 poles f
- Page 210 and 211:
decreased vulnerability of the pole
- Page 212 and 213:
2060. These results confirm the res
- Page 214 and 215:
Figure 5.7: Probability of Exceedan
- Page 216 and 217:
American Society of Civil Engineers
- Page 218 and 219:
Leicester, R.H., Wang, C.H., Minh,
- Page 220 and 221:
Viscusi, W.K. (2007) Rational Disco
- Page 222 and 223:
6.1 AbstractThis paper presents the
- Page 224 and 225:
social characteristics may have an
- Page 226 and 227:
(HDRI). The HDRI was calculated by
- Page 228 and 229:
The maximum annual wind speed for M
- Page 230 and 231:
Using the Irish model and data from
- Page 232 and 233:
6.3.3 Coastal Community Social Vuln
- Page 234 and 235:
H surge (t) = X H2 (t)(6.7b)where H
- Page 236 and 237:
Queensland, Australia. A recent stu
- Page 238 and 239:
Table 6.2: Results of PCA, includin
- Page 240 and 241:
Table 6.3: Social Indicators for th
- Page 242 and 243:
Lambert (2001). The second ratio (4
- Page 244 and 245:
height of 5%. From this comparison,
- Page 246 and 247:
their respective region to hurrican
- Page 248 and 249:
Figure 6.3: Distributions of CCSVI(
- Page 250 and 251:
including injury and death can be c
- Page 252 and 253:
GAO (2007) Climate Change: Financia
- Page 254 and 255:
Pryor, S.C., Barthelmie, R.J., and
- Page 256 and 257:
Chapter 7__________________________
- Page 258 and 259:
specifications, etc. Aging effects
- Page 260 and 261:
estimate system reliability indices
- Page 262 and 263:
esidential construction and then ad
- Page 264 and 265:
parameters, and the social characte
- Page 266 and 267:
Chapter 8__________________________
- Page 268 and 269:
the mitigation strategies, it was f
- Page 270 and 271:
Baraneedaran, S., Gad, E.F., Flatle
- Page 272 and 273:
Climate Change Advisory Task Force.
- Page 274 and 275:
FEMA (1999). HAZUS-MH Hurricane Mod
- Page 276 and 277:
Gustavsen, B., and Rolfseng, L. (20
- Page 278 and 279:
Klima, K., Lin, N., Emanuel, K., Mo
- Page 280 and 281:
Li, Y. and Stewart, M.G. (2011) Cyc
- Page 282 and 283:
National Research Council (NRC) (20
- Page 284 and 285:
Pistrika A. and Jonkman S. (2010).
- Page 286 and 287:
Scawthorn, C., Blais, N., Seligson,
- Page 288 and 289:
Unanwa, C.O., and McDonald, J.R. (2
- Page 290 and 291:
Wang, C.-h., Leicester, R.H., and N
- Page 292 and 293:
Appendix I_________________________
- Page 294 and 295:
Table AI.2: The expected cumulative
- Page 296 and 297:
Percentage Increase in Cumulative D
- Page 298 and 299:
Table AI.3: Comparing the net benef
- Page 300 and 301:
Figure AI.3 shows the various combi
- Page 302 and 303:
Appendix II________________________
- Page 304 and 305:
Figure AII.1: Fragility Curve for C
- Page 306 and 307:
Appendix III_______________________
- Page 308 and 309:
AIII.2 ResultsA principal component
- Page 310 and 311:
Appendix IV________________________
- Page 312 and 313:
Expected completion dateEstimated s
- Page 314 and 315:
This is documentation for Chapters
- Page 316 and 317:
may use the publisher-supplied PDF
- Page 318 and 319:
This is documentation for Chapter 6


