GMM estimated means confidence intervals - Mplus
GMM estimated means confidence intervals - Mplus
GMM estimated means confidence intervals - Mplus

You also want an ePaper? Increase the reach of your titles
YUMPU automatically turns print PDFs into web optimized ePapers that Google loves.
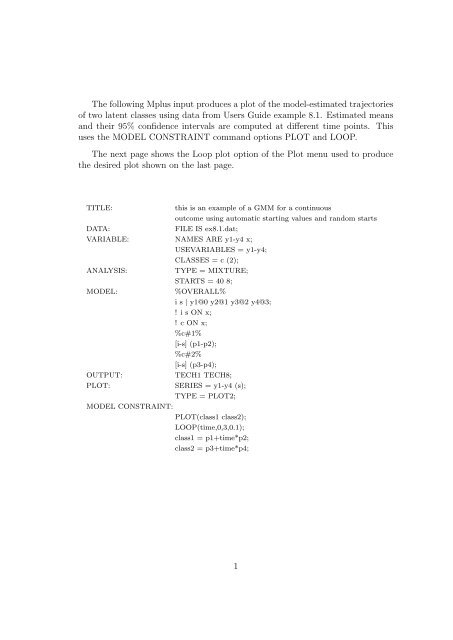
The following <strong>Mplus</strong> input produces a plot of the model-<strong>estimated</strong> trajectoriesof two latent classes using data from Users Guide example 8.1. Estimated <strong>means</strong>and their 95% <strong>confidence</strong> <strong>intervals</strong> are computed at different time points. Thisuses the MODEL CONSTRAINT command options PLOT and LOOP.The next page shows the Loop plot option of the Plot menu used to producethe desired plot shown on the last page.TITLE:this is an example of a <strong>GMM</strong> for a continuousoutcome using automatic starting values and random startsDATA:FILE IS ex8.1.dat;VARIABLE: NAMES ARE y1-y4 x;USEVARIABLES = y1-y4;CLASSES = c (2);ANALYSIS:TYPE = MIXTURE;STARTS = 40 8;MODEL:%OVERALL%i s | y1@0 y2@1 y3@2 y4@3;! i s ON x;! c ON x;%c#1%[i-s] (p1-p2);%c#2%[i-s] (p3-p4);OUTPUT:TECH1 TECH8;PLOT:SERIES = y1-y4 (s);TYPE = PLOT2;MODEL CONSTRAINT:PLOT(class1 class2);LOOP(time,0,3,0.1);class1 = p1+time*p2;class2 = p3+time*p4;1
Figure 1: Plot Menu2
Figure 2: Loop Plot76.565.55CLASS1Lower for CLASS1Upper for CLASS1CLASS2Lower for CLASS2Upper for CLASS24.543.532.521.510.5000.10.20.30.40.50.60.70.80.911.11.21.31.41.51.61.71.81.922.12.22.32.42.52.62.72.82.933.1TIME3