Fayek & Kyser 2000 uraninite fractionations.pdf - Queen's University
Fayek & Kyser 2000 uraninite fractionations.pdf - Queen's University
Fayek & Kyser 2000 uraninite fractionations.pdf - Queen's University
- No tags were found...

Create successful ePaper yourself
Turn your PDF publications into a flip-book with our unique Google optimized e-Paper software.
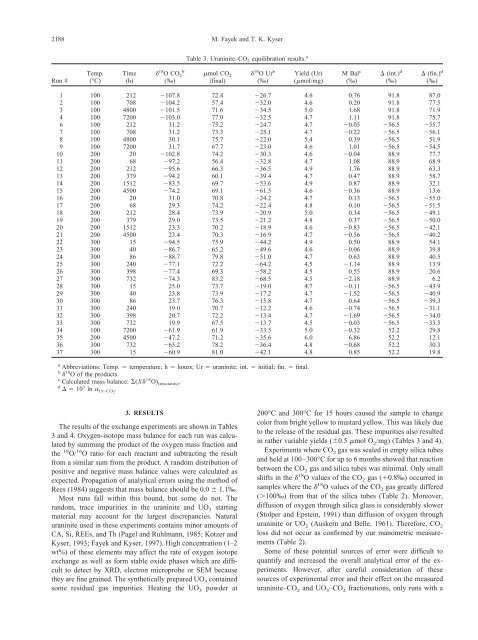
2188 M. <strong>Fayek</strong> and T. K. <strong>Kyser</strong>Table 3. Uraninite–CO 2 equilibration results. aRun #Temp.(°C)Time(h) 18 OCO 2b(‰)mol CO 2(final) 18 OUr b(‰)Yield (Ur)(mol/mg)M Bal c(‰) (int.) d(‰) (fin.) d(‰)1 100 212 107.8 72.4 26.7 4.6 0.76 91.8 87.02 100 708 104.2 57.4 32.0 4.6 0.20 91.8 77.53 100 4800 101.5 71.6 34.5 5.0 1.68 91.8 71.94 100 7200 103.0 77.0 32.5 4.7 1.11 91.8 75.76 100 212 31.2 75.2 24.7 4.7 0.05 56.5 55.77 100 708 31.2 73.3 25.1 4.7 0.22 56.5 56.18 100 4800 30.1 75.7 22.0 5.4 0.39 56.5 51.99 100 7200 31.7 67.7 23.0 4.6 1.01 56.5 54.510 200 20 102.8 74.2 30.3 4.6 0.04 88.9 77.711 200 68 97.2 56.4 32.8 4.7 1.08 88.9 68.912 200 212 95.6 66.3 36.5 4.9 1.76 88.9 63.313 200 379 94.2 60.1 39.4 4.7 0.47 88.9 58.714 200 1512 83.5 69.7 53.6 4.9 0.87 88.9 32.115 200 4500 74.2 69.1 61.5 4.6 0.36 88.9 13.616 200 20 31.0 70.8 24.2 4.7 0.13 56.5 55.017 200 68 29.3 74.2 22.4 4.8 0.10 56.5 51.518 200 212 28.4 73.9 20.9 5.0 0.34 56.5 49.119 200 379 29.0 73.5 21.2 4.8 0.37 56.5 50.020 200 1512 23.3 70.2 18.9 4.6 0.83 56.5 42.121 200 4500 23.4 70.3 16.9 4.7 0.56 56.5 40.222 300 15 94.5 75.9 44.2 4.9 0.50 88.9 54.123 300 40 86.7 65.2 49.6 4.6 0.06 88.9 39.824 300 86 88.7 79.8 51.0 4.7 0.63 88.9 40.525 300 240 77.1 72.2 64.2 4.5 1.14 88.9 13.926 300 398 77.4 69.3 58.2 4.5 0.55 88.9 20.627 300 732 74.3 83.2 68.5 4.5 2.18 88.9 6.228 300 15 25.0 73.7 19.0 4.7 0.11 56.5 43.929 300 40 23.8 73.9 17.2 4.7 1.52 56.5 40.930 300 86 23.7 76.3 15.8 4.7 0.64 56.5 39.331 300 240 19.0 70.7 12.2 4.6 0.74 56.5 31.132 300 398 20.7 72.2 13.4 4.7 1.69 56.5 34.033 300 732 19.9 67.5 13.7 4.5 0.03 56.5 33.534 100 7200 61.9 61.9 33.5 5.0 0.32 52.2 29.835 200 4500 47.2 71.2 35.6 6.0 6.86 52.2 12.136 300 732 65.2 78.2 36.4 4.8 0.68 52.2 30.337 300 15 60.9 81.0 42.1 4.8 0.85 52.2 19.8a Abbreviations: Temp. temperature; h hours; Ur <strong>uraninite</strong>; int. initial; fin. final.b 18 O of the products.c Calculated mass balance: (X 18 O) (reactants) .d 10 3 ln Ur–CO2 .3. RESULTSThe results of the exchange experiments are shown in Tables3 and 4. Oxygen-isotope mass balance for each run was calculatedby summing the product of the oxygen mass fraction andthe 18 O/ 16 O ratio for each reactant and subtracting the resultfrom a similar sum from the product. A random distribution ofpositive and negative mass balance values were calculated asexpected. Propagation of analytical errors using the method ofRees (1984) suggests that mass balance should be 0.0 1.1‰.Most runs fall within this bound, but some do not. Therandom, trace impurities in the <strong>uraninite</strong> and UO 3 startingmaterial may account for the largest discrepancies. Natural<strong>uraninite</strong> used in these experiments contains minor amounts ofCA, Si, REEs, and Th (Pagel and Ruhlmann, 1985; Kotzer and<strong>Kyser</strong>, 1993; <strong>Fayek</strong> and <strong>Kyser</strong>, 1997). High concentration (1–2wt%) of these elements may affect the rate of oxygen isotopeexchange as well as form stable oxide phases which are difficultto detect by XRD, electron microprobe or SEM becausethey are fine grained. The synthetically prepared UO 3 containedsome residual gas impurities. Heating the UO 3 powder at200°C and 300°C for 15 hours caused the sample to changecolor from bright yellow to mustard yellow. This was likely dueto the release of the residual gas. These impurities also resultedin rather variable yields (0.5 mol O 2 /mg) (Tables 3 and 4).Experiments where CO 2 gas was sealed in empty silica tubesand held at 100–300°C for up to 6 months showed that reactionbetween the CO 2 gas and silica tubes was minimal. Only smallshifts in the 18 O values of the CO 2 gas (0.8‰) occurred insamples where the 18 O values of the CO 2 gas greatly differed(100‰) from that of the silica tubes (Table 2). Moreover,diffusion of oxygen through silica glass is considerably slower(Stolper and Epstein, 1991) than diffusion of oxygen through<strong>uraninite</strong> or UO 2 (Auskern and Belle, 1961). Therefore, CO 2loss did not occur as confirmed by our manometric measurements(Table 2).Some of these potential sources of error were difficult toquantify and increased the overall analytical error of the experiments.However, after careful consideration of thesesources of experimental error and their effect on the measured<strong>uraninite</strong>–CO 2 and UO 3 –CO 2 <strong>fractionations</strong>, only runs with a