eval report cover.indd - New Jersey Farm to School Network Wiki
eval report cover.indd - New Jersey Farm to School Network Wiki
eval report cover.indd - New Jersey Farm to School Network Wiki

Create successful ePaper yourself
Turn your PDF publications into a flip-book with our unique Google optimized e-Paper software.
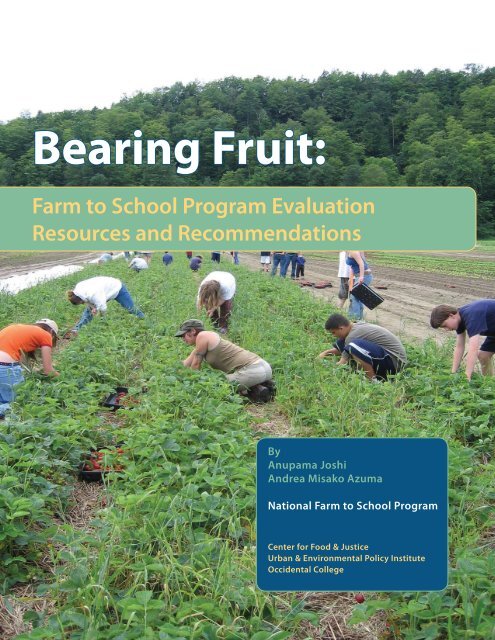
Bearing Fruit:<strong>Farm</strong> <strong>to</strong> <strong>School</strong> Program EvaluationResources and RecommendationsByAnupama JoshiAndrea Misako AzumaNational <strong>Farm</strong> <strong>to</strong> <strong>School</strong> ProgramCenter for Food & JusticeUrban & Environmental Policy InstituteOccidental College
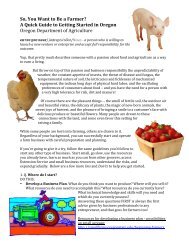
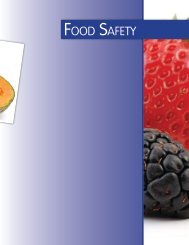
Front <strong>cover</strong>: Youth from the HealthyCity Youth <strong>Farm</strong> pick berries <strong>to</strong> befrozen and used in cafeteria meals forthe Burling<strong>to</strong>n <strong>School</strong> District , VT.Pho<strong>to</strong> by Aziza Malik.Below: 4th grade students at CentralElementary in Haywood County, NC,cook with chefs from Sunburst Trout.Pho<strong>to</strong> by Molly Nicholie.
BEARING FRUIT<strong>Farm</strong> <strong>to</strong> <strong>School</strong> Program EvaluationResources and RecommendationsByAnupama JoshiAndrea Misako AzumaNational <strong>Farm</strong> <strong>to</strong> <strong>School</strong> <strong>Network</strong>Center for Food & JusticeUrban & Environmental Policy Institute, Occidental College
AcknowledgementsWe extend our gratitude <strong>to</strong> many who helped this <strong>report</strong> come <strong>to</strong> fruition. This publicationwould not be possible without the contributions of farm <strong>to</strong> school practitionersand <strong>eval</strong>ua<strong>to</strong>rs from across the country. Moira Beery, Vanessa Zajfen, Debra Eschmeyer,Mark Valliana<strong>to</strong>s, Amanda Shaffer and Bob Gottlieb from the Center for Food & Justice,UEPI, Occidental College provided feedback and edited earlier versions of this publication.Gail Feenstra and Jeri Ohmart from the Sustainable Agriculture Research andEducation Program, University of California, Davis provided input <strong>to</strong>ward the developmen<strong>to</strong>f this resource, and we are thankful for their guidance. Amanda Shaffer and BenNyberg designed the layout for the publication, making the information more accessible<strong>to</strong> readers.Funding for this project came from the following sources:(a) Community Food Projects Program of the USDA Cooperative State Research,Education and Extension Service, grant number 2004-33800-25065 “National <strong>Farm</strong> <strong>to</strong><strong>School</strong> Training and Technical Assistance Project.”(b) The W.K. Kellogg Foundation via grants P3000982 and P3004209 supporting theplanning and establishment of a National <strong>Farm</strong> <strong>to</strong> <strong>School</strong> <strong>Network</strong>.
Table of ContentsAcknowledgements....................................................................2Executive Summary.....................................................................5I. Introduction <strong>to</strong> <strong>Farm</strong> <strong>to</strong> <strong>School</strong> Evaluation............................9Planning for Program Evaluation....................................9II. Resources and Tools for Measuring<strong>Farm</strong> <strong>to</strong> <strong>School</strong> Impact .............................................................13Common Tools and Methods for Use in<strong>Farm</strong> <strong>to</strong> <strong>School</strong> Evaluations...............................................14III. Review of <strong>Farm</strong> <strong>to</strong> <strong>School</strong> Evaluation Literature................23Feasibility Analysis for <strong>Farm</strong> <strong>to</strong> <strong>School</strong> Projects.........25Student Impacts....................................................................29Teacher Impacts....................................................................38Policy Impacts........................................................................39Food Service Impacts..........................................................42<strong>Farm</strong>er Impacts......................................................................49Parent Impacts.......................................................................51Community Impacts............................................................52IV. Conclusion and Recommendations.....................................53Endnotes..................................................................................56V. Appendices............................................................................61Program Profiles....................................................................61Sample Tools and Resources.............................................85
Executive Summary<strong>Farm</strong> <strong>to</strong> school programs, which link local farmers with schools, have increased innumber, from fewer than ten in 1997 <strong>to</strong> more than an estimated 2,000 programsin 2008. With this phenomenal increase, many in the farm <strong>to</strong> school movementare faced with the question: what are the specifi c impacts of the program? Fundingagencies, advocates and policy makers grapple with this question as they considerfarm <strong>to</strong> school programs as a model <strong>to</strong> improve school nutrition and farm profitability.While it may seem intuitive that linking students with local foods would lead <strong>to</strong> positiveoutcomes in student dietary intake and farm income, well-designed <strong>eval</strong>uations andresearch projects are needed <strong>to</strong> examine impacts on student health, dietary behaviors,school district policies, local farm profitability, and other aspects of the community atlarge.It can be diffi cult <strong>to</strong> plan farm <strong>to</strong> school <strong>eval</strong>uations given the variety of program componentsand goals. <strong>Farm</strong> <strong>to</strong> school programs inherently involve numerous stakeholdersand partners, and these different parties ask a diverse range of questions, which maybe <strong>to</strong>o many <strong>to</strong> <strong>eval</strong>uate depending upon available resources and data. Food servicedirec<strong>to</strong>rs assessing the impacts of farm <strong>to</strong> school programs question financial viabilityissues as well as impacts on children’s knowledge, attitudes, and behaviors regardinghealthy eating. For farmers, transportation and distribution issues are questions ofinterest. Health and nutrition professionals are concerned about fruit and vegetableconsumption as well as weight and /or BMI (body mass index) outcomes. With thefarm <strong>to</strong> school model being interpreted and implemented in a plethora of ways, it isdifficult <strong>to</strong> devise common <strong>eval</strong>uation indica<strong>to</strong>rs that are relevant <strong>to</strong> programs acrossthe spectrum. For this reason, generalizations based on results from a specifi c program<strong>eval</strong>uation may not be directly applicable <strong>to</strong> other programs.Definition of <strong>Farm</strong> <strong>to</strong> <strong>School</strong>For the purpose of this <strong>report</strong>, “farm<strong>to</strong> school” is broadly defi n ed as aschool-based program that connectsschools (K-12) and local farms with theobjectives of serving healthy meals inschool cafeterias, improving studentnutrition, providing agriculture, healthand nutrition education opportunities,and supporting local and regionalfarmers. The defi n ition of “local” or“regional” farms or food is flexible andvaries. Some interpret “local” according<strong>to</strong> political/geographic boundariesranging from a city <strong>to</strong> a state or aregion. Others suggest the ecoregionor bioregion size. i This lack of a commondefinition presents challenges forcomparing <strong>eval</strong>uation results.i “Local food,” <strong>Wiki</strong>pedia,http://en.wikipedia.org/wiki/Local_food#_ref-0, accessed April 2008.Given the challenges of <strong>eval</strong>uating farm <strong>to</strong>school programs, this <strong>report</strong> is intended asa resource guide for planning farm <strong>to</strong> school<strong>eval</strong>uations. Drawing upon <strong>to</strong>ols and methodsthat have been used or have the potential <strong>to</strong>be used for <strong>eval</strong>uating program impacts, the<strong>report</strong> includes a compilation of existing farm<strong>to</strong> school <strong>eval</strong>uations, making comparisonswhere appropriate, and placing them in contextwhen possible. The aim of this comprehensivesummary of key <strong>eval</strong>uation results from farm<strong>to</strong> school projects is <strong>to</strong> facilitate the refi n e-ment of farm <strong>to</strong> school programs and theirassessments <strong>to</strong> maximize positive impacts onstudent diets, farm viability, school meal andsnack offerings, and educational programs.<strong>Farm</strong> <strong>to</strong> school programs purchase locally andfeature farm fresh foods such as fruits and vegetables,eggs, grains, honey, meat, and beanson their menus. Other programs may usethese products in the classroom for education,Executive Summarywww.farm<strong>to</strong>school.org 5
Executive Summaryincorporate nutrition-based curriculum, and provide students experiential learningopportunities through farm visits, gardening, and recycling programs. Th is relationshipwith area schools gives farmers access <strong>to</strong> a new market, as well as provides anopportunity <strong>to</strong> connect with the community and educate children about local food andsustainable agriculture. Most cafeteria components of farm <strong>to</strong> school programs focuson the lunch program with some programs including breakfast and snack programs.Studies reviewed in this <strong>report</strong> under<strong>to</strong>ok interventions that integrated local purchasingof food products along with one or more of the farm <strong>to</strong> school components listedabove. The resources and reviews of farm <strong>to</strong> school <strong>eval</strong>uations presented in this <strong>report</strong>are based on the information available <strong>to</strong> us in 2007. Additional data and resources onthe <strong>to</strong>pic may have become available since then.Letter from a student at Davis Joint Unifi e d <strong>School</strong> District(DJUSD) <strong>to</strong> the <strong>School</strong> Board supporting the “Crunch Lunch”- the DJUSD <strong>Farm</strong> <strong>to</strong> <strong>School</strong> Salad Bar Program6 Bearing Fruit: <strong>Farm</strong> <strong>to</strong> <strong>School</strong> Evaluation Resources and Recommendations
Table 1. A Summary of <strong>Farm</strong> <strong>to</strong> <strong>School</strong> Program Impacts iImpacts on Indica<strong>to</strong>r Demonstrated ImpactsStudentsTeachersPolicyFood ServiceCosts,Revenue,Interest<strong>Farm</strong>ersStudent knowledge10,26-28,42-44,51Student attitudes 10,14,42,45-46,86Student behaviors 14,18-20,28,43-49,86Other studentbenefits 14,26-27,46,51Teacher attitudes/behaviors 14,28,43,44-46,52-53Policy changesFood service operations 18-20,45,47-49,80-82,87Food service staff interest 14,46<strong>School</strong> meal participation 18-20,45,47-49,80,83Financial costs 18-20,45,49,60,80Food service revenue 47,49,84Local food procurement 14,18-20,44,46-47,49,52,60,80-85<strong>Farm</strong>er income 14,18-19,46-47,52,81-83,88<strong>Farm</strong>er benefits 81,82Gains in knowledge and awareness about gardening,agriculture, healthy eating, local foods and seasonalityDemonstrated willingness <strong>to</strong> try out new foods and healthier optionsStudents choose healthier options in cafeteria; consume morefruits and vegetables through farm <strong>to</strong> school meals (+0.99 <strong>to</strong>+1.3 servings/day) and at home; consume less of unhealthyfoods and sodas; reduce television watching time; positivelifestyle modifications such as a daily exercise routinePositive gains in phonological awareness of thealphabet, increased social skills, self-esteemPositive attitudes about integrating farm <strong>to</strong> school related informationin curriculum, positive changes in teachers’ diets and lifestyles.<strong>Farm</strong> <strong>to</strong> <strong>School</strong> supportive policies, other health / nutritionpolicies enacted at school district, county or state levels, thoughpolicy development has not been assessed as an impact.<strong>Farm</strong> <strong>to</strong> school cafeteria offerings serve more fruits and vegetablesthan regular meals; farm <strong>to</strong> school facilitates development of newseasonal recipes for use in school food service operations, andfacilitates changes in cafeteria waste management policies.Increase in knowledge and interest in local food preparation, gainsin knowledge regarding seasonal recipes, interest in interactingwith teachers <strong>to</strong> strengthen classroom-cafeteria connectionsIncrease in participation rates observed in the range of3% <strong>to</strong> 16% due <strong>to</strong> farm <strong>to</strong> school programmingNo clear indication on whether food costs for farm <strong>to</strong> school mealsare higher; labor costs for preparing farm <strong>to</strong> school meals are higher<strong>Farm</strong> <strong>to</strong> school meals bring in additional revenues throughincreases in student and adult meal participationPurchases from local sources increase as the farm <strong>to</strong>school program matures <strong>to</strong>wards institutionalization, mayreach up <strong>to</strong> 50% of all produce purchases in seasonAverage income from farm <strong>to</strong> school represents up<strong>to</strong> 5% of all sales for individual farmersDiversification of market, positive relationships with schooldistrict, parents and community; farmers contracted <strong>to</strong> plant cropsfor schools; opportunities <strong>to</strong> explore processing and preservationmethods for institutional markets; establishment of growercollaboratives or cooperatives <strong>to</strong> supply institutional marketsParents Parent benefits 14,26-27,,43-44,46,51 family diets and guiding children <strong>to</strong> make healthier choices, positiveGains in ability and interest in incorporating healthier foods inchanges in shopping patterns reflecting healthy and local foodsCommunity Community benefits 14,46 Awareness about local foods, interest in purchasing local foods,interest and awareness about foods served in school cafeterias.i Information based on a literature review of farm <strong>to</strong> school <strong>eval</strong>uation studies as presented in the <strong>report</strong> “Bearing Fruit:<strong>Farm</strong> <strong>to</strong> <strong>School</strong> Program Evaluation Resources and Recommendations” by Joshi A and Azuma A M, National <strong>Farm</strong> <strong>to</strong> <strong>School</strong><strong>Network</strong>, Center for Food & Justice, Occidental College, 2008. Please refer <strong>to</strong> the full <strong>report</strong> for data specifics and references.
I. Introduction <strong>to</strong> <strong>Farm</strong><strong>to</strong> <strong>School</strong> EvaluationIn this section:Planning for <strong>Farm</strong> <strong>to</strong><strong>School</strong> Program Evaluation
Previous page: Students from Vance Elementaryin Asheville, NC participate in the AppalachianSustainable Agriculture Project’s Chef Fest.Pho<strong>to</strong> by Molly Nicholie.Above: <strong>Farm</strong>er Dewain Mackey of Madison <strong>Farm</strong>sdelivers local <strong>to</strong>ma<strong>to</strong>es and strawberries <strong>to</strong> HotSprings Elementary in North Carolina.Pho<strong>to</strong> by Libby Hinsley.
I. Introduction <strong>to</strong><strong>Farm</strong> <strong>to</strong> <strong>School</strong> EvaluationPlanning for Program EvaluationAcommon mistake made by farm <strong>to</strong> school planners is waiting until the end ofa <strong>report</strong>ing period for a grant, or after the project is up and running, <strong>to</strong> thinkabout <strong>eval</strong>uation. Ideally, <strong>eval</strong>uation planning should take place at the same timeas program planning. In order <strong>to</strong> measure the impacts of a project or <strong>to</strong> answer specifi cresearch questions relating <strong>to</strong> farm <strong>to</strong> school, specifi c data may need <strong>to</strong> be gatheredfrom the start of the program.Involving a multitude of stakeholders, program areas and variables, the complexity offarm <strong>to</strong> school programs presents a challenge in designing a comprehensive <strong>eval</strong>uation.In addition, most farm <strong>to</strong> school programs are not adequately funded, or are dependen<strong>to</strong>n external support for start up and operational expenses such as costs for equipmentand labor. <strong>Farm</strong> <strong>to</strong> school organizers may therefore be wary of focusing on <strong>eval</strong>uationactivities with the fear that <strong>eval</strong>uation will divert limited resources from program activities,or will over-burden program staff. Also, <strong>eval</strong>uation terminology and modelsmay appear foreign and academic <strong>to</strong> grassroots organizers of farm <strong>to</strong> school programs.For these reasons, it is no surprise that farm <strong>to</strong> school program <strong>eval</strong>uations have beenlimited, and those that have been conducted vary widely in focus.For relatively new program models such as farm <strong>to</strong> school, it is essential <strong>to</strong> utilize sound<strong>eval</strong>uation methods that add <strong>to</strong> the body of knowledge on working models. Fundingagencies are increasingly focused on <strong>eval</strong>uation results that provide clear evidence ofproject impacts. Well-designed <strong>eval</strong>uations can help program planners gauge how wellthey are meeting their goals and provide a feedback loop so that programs can adaptand achieve maximum benefits. Evaluations can also guide policy makers in the developmen<strong>to</strong>f specifi c legislation that can further farm <strong>to</strong> school goals.<strong>Farm</strong> <strong>to</strong> school practitioners around the country need <strong>to</strong> build their capacity <strong>to</strong> conductmore comprehensive <strong>eval</strong>uations and invest in the necessary resources. The fundsrequired <strong>to</strong> <strong>eval</strong>uate a farm <strong>to</strong> school program depend on a variety of fac<strong>to</strong>rs including:what aspects of the program are <strong>to</strong> be <strong>eval</strong>uated, the size of the program, kindsof outcomes <strong>eval</strong>uated, who is conducting the <strong>eval</strong>uation, the availability of existingdata sources, and in-house <strong>eval</strong>uation expertise. An allocation of 5-10% of the overallprogram budget for <strong>eval</strong>uation is recommended, though this may not be feasible for allprograms.Th e first step in planning for program <strong>eval</strong>uation is working out the <strong>eval</strong>uation goals,objectives, strategies, and target populations. Th e next step is <strong>to</strong> develop an <strong>eval</strong>uationframework by identifying feasible <strong>eval</strong>uation methods, indica<strong>to</strong>rs, and targets forthe program. For additional resources and information on planning and structuring an<strong>eval</strong>uation, please see the Community Food Projects Evaluation Handbook 1 developedby the Community Food Security Coalition.Introduction <strong>to</strong> <strong>Farm</strong> <strong>to</strong> <strong>School</strong> Evaluationwww.farm<strong>to</strong>school.org 9
Introduction <strong>to</strong> <strong>Farm</strong> <strong>to</strong> <strong>School</strong> EvaluationIt is important <strong>to</strong> <strong>eval</strong>uate both the processes and impacts of farm <strong>to</strong> school programs.Process <strong>eval</strong>uation indica<strong>to</strong>rs may be moni<strong>to</strong>red <strong>to</strong> meet the project deliverables anddescribe implementation of a project. These typically include, but are not limited <strong>to</strong>,the number of operational programs, schools participating, children participating,farmers supplying food, school gardens developed, trainings and educational sessionsconducted, recipes developed, curriculum or lessons implemented, etc. Impact <strong>eval</strong>uationindica<strong>to</strong>rs are aimed at examining outcomes related <strong>to</strong> program implementation,and usually require more expertise and financial resources <strong>to</strong> gather and analyze. <strong>Farm</strong><strong>to</strong> school impact <strong>eval</strong>uation can be conducted through a variety of qualitative methods(interviews, focus groups, surveys with open ended questions), and quantitativemethods (changes in weight, body mass index, academic scores, and in local productpurchased).Another consideration for <strong>eval</strong>uation planning is ethics, which includes the use of humansubjects in <strong>eval</strong>uation. Federal regulations govern the protection of research participants,especially children. An entity known as the Institutional Review Board (IRB),based at universities and other research organizations, is charged with reviewing andapproving any research that involves the participation of people. It is important <strong>to</strong> beaware of and follow these regulations, especially if a farm <strong>to</strong> school program is fundedwith public monies. See www.hhs.gov/ohrp/ for more information.Deciding on the scope and focus area for a farm <strong>to</strong> school program <strong>eval</strong>uation dependson resources available – financial, staff expertise, and skills. Hiring or developing a contractualrelationship with an experienced professional <strong>eval</strong>ua<strong>to</strong>r is an option, though itmay pose a challenge for programs with limited financial resources. Researchers fromlocal universities and colleges may be interested in developing connections with farm <strong>to</strong>school programs and could serve as valuable partners for <strong>eval</strong>uation.For farm <strong>to</strong> school programs, information generated through research and <strong>eval</strong>uationmay be broadly classified in<strong>to</strong> the following categories, with some examples providedbelow:Baseline / Existing Program Information / Feasibility StudiesBaseline information on pre-program indica<strong>to</strong>rs, existing information on number offarm <strong>to</strong> school programs already in operation, key components and features. Th is mayalso include a feasibility analysis using findings from the baseline data collection.Student ImpactsChanges in knowledge, attitudes, behaviors regarding food choices and nutrition, health,local foods, agriculture, environment; changes in Body Mass Index (BMI), academicperformance, discipline, attendance, and activity patterns.10 Bearing Fruit: <strong>Farm</strong> <strong>to</strong> <strong>School</strong> Evaluation Resources and Recommendations
Teacher ImpactsChanges in knowledge and attitudes of teachers and school administra<strong>to</strong>rs, changes indietary behaviors.Policy ImpactsChanges <strong>to</strong> school district nutrition and health policies, practices and policies regardingwaste management and recycling.Food Service ImpactsChanges in menu plans and recipes <strong>to</strong> offer more fruits and vegetables and local, healthyfood options, changes in meal participation rates, financial viability of food service operations,changes <strong>to</strong> food procurement patterns, changes in the knowledge, attitudesand behaviors of food service staff.<strong>Farm</strong>er ImpactsSales <strong>to</strong> schools, changes in planting patterns, adoption of sustainable farming practices,breakthroughs in handling distribution and transportation issues, prevention offarmland loss, increase in the number of farms or farmers in the region.Parent ImpactsKnowledge, attitude and behavior changes regarding diet and health, support for localfarms and agriculture, changes in lifestyle, and food purchasing patterns at home.Introduction <strong>to</strong> <strong>Farm</strong> <strong>to</strong> <strong>School</strong> EvaluationCommunity ImpactsAwareness and interest in local foods and farming, access <strong>to</strong> local healthier foods, impactson local economy.www.farm<strong>to</strong>school.org 11
II. Resources and Toolsfor Measuring <strong>Farm</strong><strong>to</strong> <strong>School</strong> ImpactsIn this section:Common <strong>to</strong>ols andmethods for use in farm<strong>to</strong> school <strong>eval</strong>uations
Previous Page: 3rd grade students from Gouge Elementaryplant strawberries at Green Toe Ground farm in Celo, NC.Pho<strong>to</strong> by Emily Jackson.Above: A student enjoys the farm <strong>to</strong> school salad bar atEmerson Elementary <strong>School</strong> in Riverside, CA.Pho<strong>to</strong> by Riverside USD.
II. Resources and Tools for Measuring<strong>Farm</strong> <strong>to</strong> <strong>School</strong> ImpactOnce <strong>eval</strong>uation questions and indica<strong>to</strong>rs have been decided, the next step in<strong>eval</strong>uation planning is <strong>to</strong> choose the best method <strong>to</strong> measure the selectedindica<strong>to</strong>r(s). A wide variety of data collection methods are available, anddecisions about which method <strong>to</strong> select will depend not only on the outcomes <strong>to</strong> bemeasured, but also on the credibility of the collected data for the target audience. Assessment<strong>to</strong>ols can be developed from scratch, or <strong>to</strong>ols already developed for otherprojects can be used in their entirety or modified <strong>to</strong> suit specifi c needs. Using <strong>to</strong>olsdeveloped by other projects not only saves time, it may also ensure rigor of the methodif the <strong>to</strong>ol has been validated. In some cases, data gathered from other projects that haveused the same <strong>to</strong>ol may be used as a control or reference data for comparison. Onlinesurvey services, which also provide data analysis services, are increasingly being usedin program <strong>eval</strong>uations, though their use is limited <strong>to</strong> populations with internet accessand basic computer skills. In the case of farm <strong>to</strong> school <strong>eval</strong>uations, this may includefood service direc<strong>to</strong>rs, school administra<strong>to</strong>rs, parents, community members, farmersand older students.A compilation of common <strong>to</strong>ols that have been used by existing farm <strong>to</strong> school program<strong>eval</strong>uations is included in this section for reference. Before a <strong>to</strong>ol can be consideredfor use, project planners are advised <strong>to</strong> consider how the <strong>to</strong>ols relate <strong>to</strong> the <strong>eval</strong>uationgoals as well as the rigor of the <strong>to</strong>ols and methods. Where possible, samples have beenprovided in the Appendices. Unless clearly indicated for wider use and distribution, it isadvisable <strong>to</strong> contact the authors or organizations for permission <strong>to</strong> use the <strong>to</strong>ol in par<strong>to</strong>r in its entirety.Resources and Tools for Measuring <strong>Farm</strong> <strong>to</strong> <strong>School</strong> Impactwww.farm<strong>to</strong>school.org 13
Resources and Tools for Measuring <strong>Farm</strong> <strong>to</strong> <strong>School</strong> Impact►►►Food frequency questionnairesgather dietary data throughthe completion of a questionnairethat <strong>cover</strong>s foods eatenover a span of time, often manymonths. Th e questionnairemust be culturally specific soas <strong>to</strong> capture foods eaten in theparticipant’s diet.24 hour dietary recall is amethod whereby an interviewerasks a participant <strong>to</strong>remember all food items andquantities consumed within a24-hour period.Screeners are usually shorter survey instruments that focus on certain type(s) offoods in the diet, such as fruits and vegetables, or fiber.Th ese methods have been widely used in nutrition and nutritional epidemiology researchand validation studies have been conducted for many versions of these methods.In the farm <strong>to</strong> school program <strong>eval</strong>uations reviewed for this <strong>report</strong>, other approacheshave been used as a proxy for measuring dietary intake, for example:►►►Digital pho<strong>to</strong>graphs of school meals have been taken and analyzed <strong>to</strong> assesswhat students serve themselves in cafeteria food lines. 15-20 If used along withfood waste data in the cafeteria, these pho<strong>to</strong>graphs can reveal information on anaverage amount of food students consume through the school meal program.Analyses of food production records from the school cafeteria are an indirectmethod used <strong>to</strong> estimate how many servings of a particular product (typicallyfruits and vegetables) every meal produced in the school cafeteria contains. Th ismethod assumes that the amount of product offered on each tray is the amountconsumed by the students.Analysis of meal choices made by students, such as trend data for number ofstudents choosing a farm <strong>to</strong> school salad bar meal versus a hot meal optioncombined with nutrition information per meal served can provide informationon average student dietary intake from the school meal.c) Measures of weight and healthExamples of <strong>to</strong>ols used in assessingstudent dietary behavior (seeappendices p 154-162):Assessing body mass index (BMI) – BMI is a ratio of weight in kilograms divided byheight in meters squared (wt/ht2) <strong>to</strong> measure body fat. BMI measurements are basedon height and weight and require trained staff <strong>to</strong> perform measurements. Some school››››››Diet His<strong>to</strong>ry Questionnaire- National Institutes of Health 2124 Hour Dietary Recall 22Estimation of Fruit and VegetableConsumption by Students Basedon Analysis of <strong>School</strong> FoodService Production Records 20Food Recognition Form 23Nutritionquest Kid’s Questionnaire 24Youth Risk Behavior Survey Fruit andVegetable Consumption Survey 2516 Bearing Fruit: <strong>Farm</strong> <strong>to</strong> <strong>School</strong> Evaluation Resources and Recommendations
districts and states have required that students’ weight and height be measured regularly<strong>to</strong> track BMI as part of student health records. This information may be availablefor <strong>eval</strong>uation purposes from the school district or state.d) Impacts on literacyTh e DIBELS (Dynamic Indica<strong>to</strong>rs of Basic Early Literacy Skills) are a set of standardized,individually administered measures of early literacy development. They are designed <strong>to</strong>be short (one minute) fl u ency measures used <strong>to</strong> regularly moni<strong>to</strong>r the development ofpre-reading and early reading skills. DIBELS can be used for students in Grades K-6,and have been used by one farm <strong>to</strong> school program <strong>report</strong>ed in this publication, TheKindergarten Initiative. 26,27 This test may already be conducted in some school districts,and data may be readily available. See http://dibels.uoregon.edu/index.php for moreinformation on this system.e) Impacts on academic performanceGrade point averages from schools with farm <strong>to</strong> school programs and control schoolscan be compared <strong>to</strong> determine impacts on this indica<strong>to</strong>r. Many fac<strong>to</strong>rs influence GPAs,so care should be taken <strong>to</strong> infer meaning from GPA data. Only one program cited in this<strong>report</strong>, The Edible <strong>School</strong>yard, 28 has examined this outcome.f) Psychosocial adjustmentA standardized student <strong>report</strong> questionnaire has been developed by The Edible <strong>School</strong>yard28 <strong>to</strong> assess this outcome for students in a farm <strong>to</strong> school program, as compared <strong>to</strong>students in a control school.g) <strong>School</strong> attendance records<strong>School</strong> attendance records are usually readily available from district offices. If trackedover a period of time and taking in<strong>to</strong> account other variables, these can be used <strong>to</strong> drawinferences regarding student health.Teacher ImpactsExamples of <strong>to</strong>ols used inassessing teacher impacts(see appendices p 163-165):›Teacher Focus Group Questionsand Guide – Burling<strong>to</strong>n14, 46<strong>School</strong> Food Projecta) Changes in teacher andadministra<strong>to</strong>r knowledge andattitudesSurveys can be used <strong>to</strong> assess teacher orschool administra<strong>to</strong>r knowledge about localfoods, nutrition and health, gardening,etc.; however these will need <strong>to</strong> be specifi-Resources and Tools for Measuring <strong>Farm</strong> <strong>to</strong> <strong>School</strong> Impactwww.farm<strong>to</strong>school.org 17
Resources and Tools for Measuring <strong>Farm</strong> <strong>to</strong> <strong>School</strong> Impactcally tailored <strong>to</strong> outcomes of interest. None of the programs studied for this <strong>report</strong> haveused surveys <strong>to</strong> assess this indica<strong>to</strong>r; though some have used informal discussions andinterviews with the teachers and school administration. For example, the Burling<strong>to</strong>n<strong>Farm</strong> <strong>to</strong> <strong>School</strong> project has conducted focus group discussions with teachers participatingin the farm <strong>to</strong> school program.Policy ImpactsImpacts on policies are important measures of whether a farm <strong>to</strong> school program hasfacilitated systemic changes in the school food environment and school food policies.a) <strong>School</strong> food policiesMoni<strong>to</strong>ring of school food policies at thedistrict level doesn’t necessarily requirespecific survey <strong>to</strong>ols. A copy of the food/wellness policy is usually posted on thedistrict’s website and may also be availablethrough the district office.b) City, county, state and federal level policiesPublic policies that are supportive of farm <strong>to</strong> school and other community-based foodsystems work.Food Service Impacts<strong>School</strong> food service plays a crucial role in implementing change at the cafeteria levelin most farm <strong>to</strong> school programs. Th e program has more chances of being sustainedwithout external support if it has successfully impacted food service operations, working<strong>to</strong>wards making the farm <strong>to</strong> school purchasing approach fi n ancially viable for thedistrict. An assessment of the processes and fac<strong>to</strong>rs influencing changes <strong>to</strong> food servicepractices is a significant gap in farm <strong>to</strong> school literature.a) Financial viability of food service programs►►Examples of <strong>to</strong>ols used inassessing policy impacts (seeappendices p 166-172):Cost per farm <strong>to</strong> school meal: To calculate the real cost of serving a farm <strong>to</strong>school meal, data on cost of food, labor, equipment, and other costs from theschool food service will be needed. Often, this data is presented in comparisonwith cost per non-farm <strong>to</strong> school meal option.An in-depth analysis of income generation and expenditures for the farm <strong>to</strong>school portion of food service or nutrition education programs can be carriedout. Financial data may not be readily available with the school district in a››Sample <strong>School</strong> Wellness Policy –Berkeley Unifi e d <strong>School</strong> District 29Sample State Policy–Oklahoma HB2655 3018 Bearing Fruit: <strong>Farm</strong> <strong>to</strong> <strong>School</strong> Evaluation Resources and Recommendations
Resources and Tools for Measuring <strong>Farm</strong> <strong>to</strong> <strong>School</strong> Impactd) Cafeteria offeringsOne way <strong>to</strong> measure changes in the quality and nutritional value of cafeteria meal optionsis <strong>to</strong> examine food procurement records. Th ese records may be requested fromthe food services division of the school district. Possible changes may be calculated forspecific food groups, such as number of servings of fresh fruit and vegetable, or wholewheat and grains offered, or the amount of local products featured for a farm <strong>to</strong> schoolmeal, as compared <strong>to</strong> the non-farm <strong>to</strong> school meal option.e) Waste management and recycling practicesAudits can be conducted <strong>to</strong> assess changes in waste streams at farm <strong>to</strong> school sitesimplementing a waste management program. Several online resources are available forestablishing and assessing waste management and recycling programs in schools. 31-34f) Food service staff knowledge and attitudesProgram-specifi c surveys, informal interviews, or focus group discussions can be conducted<strong>to</strong> assess any changes in the knowledge and attitudes of food service staff as aresult of the farm <strong>to</strong> school program.<strong>Farm</strong>er ImpactsA major goal of the farm <strong>to</strong> school approach is <strong>to</strong> increase farm viability and enhanceopportunities for local agriculture. Though limited, some information on <strong>to</strong>ols used <strong>to</strong>assess these impacts is given below:a) <strong>Farm</strong>er profitabilityAnalysis of farmers’ sales records can provide information on how much farm <strong>to</strong> schoolsales contribute <strong>to</strong> overall farm income. However, this data is not easily available, andif it is, can be very time consuming for a farmer or researcher <strong>to</strong> calculate. Often thefarmer can provide an educated guess on this question during an interview.b) Number of farms participating in area farm <strong>to</strong> schoolprogramsTh is data reveals the breadth of the impact of afarm <strong>to</strong> school program on local agriculture.Examples of <strong>to</strong>ols used inassessing farmer impacts(see appendices p 185-188):››<strong>Farm</strong>er InterviewPro<strong>to</strong>col - UC SAREP<strong>Farm</strong>er Survey – National<strong>Farm</strong> <strong>to</strong> <strong>School</strong> <strong>Network</strong> 3520 Bearing Fruit: <strong>Farm</strong> <strong>to</strong> <strong>School</strong> Evaluation Resources and Recommendations
c) <strong>Farm</strong>ing and marketing operationsInterviews with farmers can provide information on any changes in their farm operationsthat have occurred as a result of the farm <strong>to</strong> school program. Some of these mayinclude diversification of products, changes in planting patterns and marketing channels,establishment of processing facilities, as well as participation in collaborative orcooperative marketing structures.Parent Impactsa) Parental knowledge, attitudes and behaviorsExamples of <strong>to</strong>ols used inassessing parent impacts (seeappendices p 189-190):›Community ImpactsExamples of <strong>to</strong>ols used inassessing community impacts(see appendices p 191-196):››››Healthy City ParentSurvey - Burling<strong>to</strong>n<strong>School</strong> Food Project 14Vermonter Poll - a statewidepoll conducted <strong>to</strong> assessparental knowledge andattitudes about school lunch andchildren’s eating behaviors 14Questions for food councilmembers - Burling<strong>to</strong>n<strong>School</strong> Food Project 14Project Partners InterviewGuide - Burling<strong>to</strong>n<strong>School</strong> Food Project 14Volunteer Interview Guide -Burling<strong>to</strong>n <strong>School</strong> Food Project 14Th ese attributes regarding food and nutritionand local agriculture can be assessedbefore and after the program through surveysor focus group discussions. An increasein parental involvement in the school canalso be an indica<strong>to</strong>r of parent impacts of thefarm <strong>to</strong> school program. Only a few farm<strong>to</strong> school programs have developed <strong>to</strong>ols <strong>to</strong>assess program impacts on parents.Unlike other school-based educational orcafeteria programs, farm <strong>to</strong> school has thepotential <strong>to</strong> impact families and the communityat large due <strong>to</strong> its broad-based collaborativeapproach that aims <strong>to</strong> involveparents, gardeners, farmers, and communitymembers. Informal discussions andinterviews with key community membersand stakeholders such as project partners,volunteers, food council, or committeemembers can reveal useful informationabout the impacts of farm <strong>to</strong> school programsin the community. Some impactsworth moni<strong>to</strong>ring include the growth offarmers’ markets in the area, campaigns ororganizing efforts around other food relatedissues facing the community, and fooddollars spent within the local economy.Resources and Tools for Measuring <strong>Farm</strong> <strong>to</strong> <strong>School</strong> Impactwww.farm<strong>to</strong>school.org 21
III. Review of <strong>Farm</strong><strong>to</strong> <strong>School</strong> EvaluationLiteratureIn this section:Feasibility Analysis for <strong>Farm</strong><strong>to</strong> <strong>School</strong> Projects- Student Impacts- Food Service Impacts- <strong>Farm</strong>er Impacts- Parent Impacts- Community Impacts
ADD IMAGE HERE...ADD CAPTIONS FORBOTH IMAGES.Previous Page: Rodney Taylor, Food Service Direc<strong>to</strong>r,and students pose with bounty from the EmersonElementary Garden, Riverside, CA.Pho<strong>to</strong> by Riverside USD.Above: Asheville City <strong>School</strong>s Child Nutrition Direc<strong>to</strong>r,Beth Palien, prepares an assortment of local fruits andveggies for students at Hall Fletcher Elementary.Pho<strong>to</strong> by Molly Nicholie.
III. Review of <strong>Farm</strong> <strong>to</strong> <strong>School</strong>Evaluation LiteratureOf the more than two thousand farm <strong>to</strong> school programs operational in 2008, only afew have been <strong>eval</strong>uated thus far. We reviewed and collated information from 38 resourcesincluding <strong>eval</strong>uation or program <strong>report</strong>s and articles representing a <strong>to</strong>tal of 23programs. Information was also collated from other farm <strong>to</strong> school related publicationsand resources, with the objective of finding commonalities and trends that could becited as impacts of the farm <strong>to</strong> school model. Th e 38 <strong>report</strong>s and <strong>eval</strong>uation findingsincluded in this review met our definition of farm <strong>to</strong> school: conducting local purchasingin addition <strong>to</strong> one other component of farm <strong>to</strong> school, and which had <strong>eval</strong>uationdata available through <strong>report</strong>s released before July 2007. Table 2 provides a list of theprograms included and the categories under which data has been cited from these programs.We acknowledge that there may be programs meeting the above criteria that we wereeither unaware of or were unable <strong>to</strong> track and include in this <strong>report</strong>. However, the 38program <strong>report</strong>s and <strong>eval</strong>uations selected and cited in this publication represent a varietyof <strong>eval</strong>uation methodologies employed by farm <strong>to</strong> school programs across the country.The fi n dings have been described based on the <strong>eval</strong>uation categories establishedin the previous section. A brief program profile highlighting information relevant forunderstanding the <strong>eval</strong>uation findings is presented for each program cited (see ProgramProfiles).Review of <strong>Farm</strong> <strong>to</strong> <strong>School</strong> Evaluation Literaturewww.farm<strong>to</strong>school.org 23
Table 2: Program profiles and <strong>eval</strong>uation outcomes highlighted in this <strong>report</strong>Page # inAppendicesStudent Impacts(Knowledge)Student Impacts(Attitudes)Student Impacts(Behaviors)Teacher ImpactsPolicy ImpactsFood ServiceImpacts<strong>Farm</strong>er ImpactsParent ImpactsCommunityImpactsAbbreviation: <strong>Farm</strong> <strong>to</strong> <strong>School</strong> Program or ReportAES-OR: Abernethy Elementary <strong>School</strong> <strong>Farm</strong> <strong>to</strong> <strong>School</strong> Program, Oregon 61 X X XASA-NC: Appalachian Sustainable Agriculture Project’s <strong>Farm</strong> <strong>to</strong> <strong>School</strong> Program, North Carolina 62 XBLP-OR: Bend La-Pine <strong>Farm</strong> <strong>to</strong> <strong>School</strong> Program, Oregon 63 XBTV-VT: The Burling<strong>to</strong>n <strong>School</strong> Food Project, Burling<strong>to</strong>n, Vermont 64 X X X X X X XCLP-CA: “Crunch Lunch” Program, Davis Joint Unified <strong>School</strong> District, California 65 X X XCOM-CA: Comp<strong>to</strong>n Unified <strong>School</strong> District <strong>Farm</strong> Fresh Salad Bar Program, California 66 X XCON-NH: ConVal <strong>Farm</strong> <strong>to</strong> <strong>School</strong> Program, <strong>New</strong> Hampshire 67 XCSA-CA: CSA in the Classroom Program, Los Angeles Unified <strong>School</strong> District, California 68 X X XDWM-CA: Davis Joint Unified Waste Management Study, California 69 XESY-CA: The Edible <strong>School</strong>yard, Berkeley, California 70 X X XFFF-IL: Fresh from the <strong>Farm</strong> Program, Seven Generations Ahead, Chicago, Illinois 71 X X X XFTK-PA: <strong>Farm</strong> <strong>to</strong> Kindergarten Initiative, The Food Trust, Philadelphia, Pennsylvania 72 X X XFTS-MA: Massachusetts <strong>Farm</strong> <strong>to</strong> <strong>School</strong> Program, Massachusetts 73 XLSB-CA: Los Angeles Unified Pilot Salad Bar Program, California 74 XMIG-MI: Mixed Greens, Michigan 75 X XMSL-MT: Missoula County <strong>Farm</strong> <strong>to</strong> <strong>School</strong> Program, Montana 76 XOSB-WA: Olympia Unified <strong>School</strong> District Salad Bar Program, Washing<strong>to</strong>n 77 X XRHM-CA: Riverside Harvest of the Month Program, California 78 XRSD-CA: Riverside <strong>Farm</strong> <strong>to</strong> <strong>School</strong> Program, California 79 X X XSFP-NY: <strong>School</strong>FoodPlus, <strong>New</strong> York 80 X XSMM-CA: Santa Monica Unified “<strong>Farm</strong>ers’ Market Salad Bar,” California 81 X XVEN-CA: Ventura Unified <strong>Farm</strong> <strong>to</strong> <strong>School</strong> Program, California 82 X XWSD-CA: Winters Joint Unified <strong>School</strong> District <strong>Farm</strong> <strong>to</strong> <strong>School</strong> Program, California 83 X XBearing Fruit: <strong>Farm</strong> <strong>to</strong> <strong>School</strong> Evaluation Resources and Recommendationswww.farm<strong>to</strong>school.org
Feasibility Analysis for<strong>Farm</strong> <strong>to</strong> <strong>School</strong> ProjectsBefore starting program implementation, many organizations conduct a feasibilityanalysis <strong>to</strong> assess program viability and interest among potential partners andstakeholders. Th is data may be collected through surveys or interviews with thestakeholder groups, or through informal discussions and meetings. We analyzed ninefeasibility studies that are included below.Four farm <strong>to</strong> school feasibility studies focused on identifyingschool food service interest in purchasing from local farmers.►►►Th e Michigan <strong>Farm</strong> <strong>to</strong> <strong>School</strong> Program conducted a statewide survey of schoolfood service direc<strong>to</strong>rs in 2004 <strong>to</strong> investigate their interest in and <strong>to</strong> identify opportunitiesand barriers for implementing a farm <strong>to</strong> school program. 4 Respondents(N = 383) <strong>report</strong>ed a high degree of interest in sourcing food from localproducers. Seventy-three percent <strong>report</strong>ed being very interested or interested.Interest increased <strong>to</strong> 83% when respondents were asked <strong>to</strong> assume that thesefoods were available through current vendors. Interest was independent of free/reduced lunch participation rate or school district location (rural, suburban,urban location). Food service direc<strong>to</strong>rs expressed diverse motivations for theirinterest in farm <strong>to</strong> school programs, including supporting the local economyand community; accessing fresh, higher-quality food; and potentially increasingstudents’ fruit and vegetable consumption. Th e most frequently <strong>report</strong>edbarriers and concerns included cost, federal and state procurement regulations,reliable supply, seasonality of fruits and vegetables, and food safety.A similar survey was conducted by the Oklahoma <strong>Farm</strong> <strong>to</strong> <strong>School</strong> Program in2002. 3 It included surveys of food service personnel from other institutionssuch as colleges and universities, technology centers, prisons, hospitals and stateresorts. Over two–thirds (68%) of the institutions agreed or strongly agreed thatthey would purchase local products, if price and quality were competitive. However,two-thirds (67%) of institutions were not willing <strong>to</strong> pay a higher price forlocal foods. The most common motiva<strong>to</strong>rs for buying local foods were supportfor the local economy and community (42%), access <strong>to</strong> fresher foods (42%), andhelping Oklahoma farms and businesses (41%). Common barriers or concernscited were food safety (49%), supply reliability (46%), and lack of producers fromwhom <strong>to</strong> purchase (44%). The program website www.kerrcenter.com/ofpc/index.htmprovides free downloads of the institutional survey and of “Th e OklahomaFood Connection 2003” – a direc<strong>to</strong>ry of agricultural producers, crops andinstitutional buyers.Under the guidance of the <strong>New</strong> York State <strong>Farm</strong> <strong>to</strong> <strong>School</strong> Coordinating Committee,the Cornell <strong>Farm</strong> <strong>to</strong> <strong>School</strong> Program 2 <strong>to</strong>ok the lead in conducting asurvey of food service direc<strong>to</strong>rs from K-12 public, charter, and private schoolsin <strong>New</strong> York State during the 2003-04 school year. Th e survey was intended <strong>to</strong>explore ways <strong>to</strong> strengthen connections among farmers and school cafeteriasin <strong>New</strong> York State (NYS). It examined current farm <strong>to</strong> school programs andexplored the potential for developing new farm <strong>to</strong> school links. Data from theReview of <strong>Farm</strong> <strong>to</strong> <strong>School</strong> Evaluation Literaturewww.farm<strong>to</strong>school.org 25
Review of <strong>Farm</strong> <strong>to</strong> <strong>School</strong> Evaluation Literature►373 respondents reveal substantial involvement and an even greater potentialfor the use of NYS agricultural products in schools. Nearly one-quarter of thefood service direc<strong>to</strong>rs <strong>report</strong>ed purchasing fresh fruits and vegetables directlyfrom a farmer, and 72% <strong>report</strong>ed purchasing NYS foods either directly froma farmer or food wholesaler. Apples, pota<strong>to</strong>es, and lettuces, all grown within<strong>New</strong> York, were cited by survey respondents as among the most frequently purchasedwhole fruit or vegetable products. The majority of food service direc<strong>to</strong>rspurchased several fresh and seasonal fruits and vegetables from NY farms, andover 95% of those who had not yet purchased local food were interested in doingso in the future. Nearly 88% of food service direc<strong>to</strong>rs felt that schools supportthe local economy and community by purchasing local foods. Over half felt thatlocal purchases would benefit students by increasing their access <strong>to</strong> fresh fruitsand vegetables and improving their diets. Over half also indicated that if morepartially processed local products were available they would be more likely <strong>to</strong>purchase them. The most frequently cited concerns were reliability of supply,delivery, and cost. The survey found that the following <strong>to</strong>ols would help foodservice direc<strong>to</strong>rs <strong>to</strong> purchase local foods: lists of locally grown food productand seasonal availability, lists of farmers willing <strong>to</strong> sell <strong>to</strong> schools, health andsafety information, regula<strong>to</strong>ry guidelines for schools, school-tested recipes andmenus, promotional materials, and an indication of food source on vendor orderforms.Researchers from the University of California at Davis surveyed food servicedirec<strong>to</strong>rs (n=38) and farmers (n=8) implementing farm <strong>to</strong> school programs. 36Th e study published in 2006 identifies common characteristics among districts/communities supportive of buying local food. In addition, the study examineshow food service direc<strong>to</strong>rs perceive the benefits and barriers of buying locallyand points <strong>to</strong> solutions <strong>to</strong> commonly encountered issues <strong>to</strong> buying local food inCalifornia. About half of the food service direc<strong>to</strong>rs were motivated <strong>to</strong> buy locally<strong>to</strong> access fresher food (47%) and support the local economy (47%). Barrierscited were cost (52%), vendor and delivery considerations (47%), inconvenienceof multiple invoicing (39%) and produce seasonality (34%).An additional five studies have assessed the feasibility ofmultiple aspects of the program– cost of establishing aprogram, financial viability for food service, the supplypotential for local foods, distribution options, and processingneeds.►In 2003, the San Francisco Food Systems Program conducted a feasibility analysisof implementing a farm <strong>to</strong> school program in the San Francisco Unified <strong>School</strong>District. 37 The research examined the district’s assets and constraints in such areasas food service facilities, labor and training, nutrition policy, school gardens,and nutrition education, as well as mechanisms for identifying local farmers,ordering, and delivery. A <strong>School</strong> Food Environment Survey was conducted <strong>to</strong>26 Bearing Fruit: <strong>Farm</strong> <strong>to</strong> <strong>School</strong> Evaluation Resources and Recommendations
►►►explore the school-specifi c fac<strong>to</strong>rs that might support and/or inhibit a lastingfarm <strong>to</strong> school project. Some of the difficulties identified included bureaucraticchallenges, the scarcity of resources within the district, competitive food sales,lack of integration between district departments, lack of communication andconnection with farming communities, and the lack of poverty level adjustmentsfor the city and county that take in<strong>to</strong> consideration the higher cost of living inSan Francisco.A 2003 <strong>report</strong> by the Monterey County <strong>Farm</strong> <strong>to</strong> <strong>School</strong> Project provides a detailedanalysis (by school district) of the needs and opportunities for procuringand distributing local produce <strong>to</strong> schools, integrating educational programs andschool gardens in Monterey County, CA, and a recommended strategic plan ofaction for farm <strong>to</strong> school programs in the county. 38Th e objectives for a feasibility study of the farm <strong>to</strong> school project in Montana in2006 were <strong>to</strong> fill the need for information on 1) the quantities and types of localfood purchased by public institutions and 2) the opportunities institutions maypresent as a market for food produced in Montana. The study also proposed <strong>to</strong>assess the state’s current and potential capacity for food production, processing,and distribution needed <strong>to</strong> serve its public institutional food service markets.Results showed that although public institutions purchased a very small percentage(less than 2%) of the food consumed in Montana, successful programsat the University of Montana and Montana State University illustrated that localsuppliers could provide food <strong>to</strong> public institutions. 39A 2006 <strong>report</strong> from Minnesota explored the opportunities and barriers <strong>to</strong>greater use of locally-grown produce in public schools in the state. 40 Many ofthe food service direc<strong>to</strong>rs interviewed had some experience purchasing directlyfrom farmers, but typically their experience was limited <strong>to</strong> one or two products(most often local apples). However, numerous barriers <strong>to</strong> expanding use of localproduce were identified. For instance, many districts are able <strong>to</strong> spend $0.15 orless for each serving of fruit and vegetables. Four key needs emerged as fac<strong>to</strong>rsthat would enable food service direc<strong>to</strong>rs <strong>to</strong> use more locally-grown produce:1) access <strong>to</strong> locally-grown produce through distribu<strong>to</strong>rs; 2) risk managementstrategies <strong>to</strong> assure the quantity and quality of local produce, reliable delivery,Review of <strong>Farm</strong> <strong>to</strong> <strong>School</strong> Evaluation LiteratureComparative Research: Nutrition Education and Consumption of Produce<strong>School</strong>-based nutrition programs produced a moderate increase in fruit and vegetableconsumption: Meta and pooling analyses from seven studies. Hower<strong>to</strong>n M.W, Bell S, Dodd K.W,Berrigan D, S<strong>to</strong>lzenberg-Solomon R, Nebeling L. J Nutr Educ Behav. 2007; 39:186-196Data from seven school-based nutrition intervention studies was pooled and analyzed for changesin fruit and vegetable consumption in children. Studies included the Integrated Nutrition Project,Colorado 5 A Day Program, California’s 5 A Day Power Play! Gimme 5, CATCH, 5 A Day PowerPlus and the Alabama High 5 program. Results showed that at the individual level, the net diff e rencewas 0.45 (95% CI 0.33-0.59) servings; the net relative change was 19% (95%CI 0.15-0.23) servings.www.farm<strong>to</strong>school.org 27
Review of <strong>Farm</strong> <strong>to</strong> <strong>School</strong> Evaluation Literature►and liability protection; 3) costs for local produce compatible with districts’fi n ancial realities; and 4) access <strong>to</strong> local fruits and vegetables that have beenfurther processed.A regional study was conducted in four Midwestern states - Iowa, Kansas, Nebraskaand Minnesota in the years 1999-2000 <strong>to</strong> determine existing purchasingpractices of school food service and <strong>to</strong> identify benefits and obstacles <strong>to</strong>purchasing from local growers or producers. 41 The study found that one-third ofrespondents indicated that they had purchased from local growers and producerswith the most common purchase being fresh produce items. Good publicrelations and aiding the local economy were perceived as strong benefits ofpurchasing locally, whereas lack of year-round availability of local product, andinability <strong>to</strong> obtain an adequate supply were cited as obstacles.28 Bearing Fruit: <strong>Farm</strong> <strong>to</strong> <strong>School</strong> Evaluation Resources and Recommendations
Student Impacts<strong>Farm</strong> <strong>to</strong> school programs may influence students at various levels including knowledgeand awareness about food sources, nutrition, eating behaviors and lifestyles, bodyweight, body mass index, and other physiological indica<strong>to</strong>rs of good health. The impactsof farm <strong>to</strong> school programs on students are of particular interest <strong>to</strong> school nutritionand food service staff, the public health community, as well as parents and communityadvocates.Changes in student knowledge<strong>Farm</strong> <strong>to</strong> school educational programs occur both inside and outside of the classroomon <strong>to</strong>pics including nutrition and health, local foods and agriculture, and environmentand ecosystems. Th ese educational opportunities may also extend <strong>to</strong> teachers, schooladministration, parents, and the larger community.Four programs have <strong>report</strong>ed a change in student knowledge about the following <strong>to</strong>pics.Gardening and Agriculture►►Students participating in The Edible <strong>School</strong>yard project in Berkeley, CA (ESY-CA) demonstrated greater gains in understanding of garden cycles than didstudents in a control group without a farm <strong>to</strong> school program. Students alsodemonstrated an increase in knowledge about definitions of ecosystems andsustainable agriculture. 28Mixed Greens (MIG–MI) <strong>report</strong>ed that participating students increased knowledgeabout basic gardening skills and showed a greater ability <strong>to</strong> identify plantsand vegetables growing in their gardens. 10,42Healthy Eating►►Using a pre-post survey methodology for fifth and sixth grade students receivingan eight-week food-focused curriculum, Fresh from the <strong>Farm</strong> (FFF-IL) <strong>report</strong>edan 8.7% increase in students’ awareness about the recommendation <strong>to</strong> eat morethan five servings of fruits and vegetables a day. In the same program, after curriculumimplementation, as many as 81% of students were able <strong>to</strong> select “carrotswith veggie dip” as a healthy snack out of several options provided, in comparison<strong>to</strong> 69.5% before the curriculum was implemented. Post-curriculum, morestudents were aware that 100% fruit juice is the healthiest juice <strong>to</strong> drink. 43,44Th e <strong>Farm</strong> <strong>to</strong> Kindergarten Project in Philadelphia (FTK-PA) asked kindergartenstudents <strong>to</strong> point out the position of various food groups on the Food Pyramid.After the nutrition education sessions, the proportion of students who couldcorrectly identify the location of fruits increased from 27% <strong>to</strong> 47%; the propor-Review of <strong>Farm</strong> <strong>to</strong> <strong>School</strong> Evaluation Literaturewww.farm<strong>to</strong>school.org 29
Comparative Research:Nutrition Education and Fruit & Vegetable ConsumptionGetting children <strong>to</strong> eat more fruit and vegetables: A systematic review. Knai C,Pomerleau J, Lock K, and McKee M. Preventive Medicine 42(2006): 85-95.Review of <strong>Farm</strong> <strong>to</strong> <strong>School</strong> Evaluation LiteratureTh is systematic review of fifteen studies assessed the impacts of nutrition educationinterventions <strong>to</strong> increase fruit and vegetable consumption in children. Th e authors<strong>report</strong>ed an increase in the range of 0.3 servings <strong>to</strong> 0.99 servings/day. Th e studies includedin this review focused on youth between the ages of 5-18 that had a control group andused fruit and vegetable consumption as the primary measurement outcome.tion who could locate grains increased from 16% <strong>to</strong> 34%. Four out of five studentsreceiving the farm <strong>to</strong> kindergarten program were aware of the recommendednumber of fruit and vegetables servings they should be eating every day; whileonly one of two students in the control group knew the answer. In the schoolsreceiving farm <strong>to</strong> school programming, there was a twofold increase in thepercentage of children who could identify foods they should only eat occasionally,compared <strong>to</strong> a 10% increase in correct responses from students in controlschools. Ninety percent of students who had received nutrition education couldidentify a healthier option <strong>to</strong> buy in a supermarket as compared <strong>to</strong> only 62% inthe pre-test. This program also showed an increase in knowledge about readingfood labels for both foods and beverages. 26,27Source of Food►►Prior <strong>to</strong> curriculum implementation, about 50% of students participating in theFFF-IL program were aware that all fruits and vegetables do not grow year round.Th is percentage increased <strong>to</strong> 57.9% following curriculum implementation. 43,44Th e FTK-PA <strong>eval</strong>uation reveals a statistically significant difference in knowledgeabout the journey of food from farm <strong>to</strong> fork among students who received nutritioneducation as part of the farm <strong>to</strong> school program as compared <strong>to</strong> those thatdid not. Correct responses for where food comes from more than doubled from30 Bearing Fruit: <strong>Farm</strong> <strong>to</strong> <strong>School</strong> Evaluation Resources and Recommendations
33% <strong>to</strong> 88% after children went on a farm <strong>to</strong>ur as part of the farm <strong>to</strong> schoolprogram. In addition, the number of students recognizing farms as the source offood increased from 45% in the pre-test <strong>to</strong> 89% during the post-test. 26,27Foods Grown in the Region►►After the FFF-IL curriculum implementation, there was an increase of 10-20% inthe number of students who were able <strong>to</strong> identify products grown in the region,such as corn, soybeans, carrots, peppers, apples and salad greens. 43,44FTK-PA <strong>report</strong>ed that when asked <strong>to</strong> point <strong>to</strong> a picture of a fruit that might begrown in the state of Pennsylvania, more than three times as many students gavethe correct response after receiving the local food education. 26,27Changes in student attitudesExposing children <strong>to</strong> different types of foods can lead <strong>to</strong> changes in attitudes about thesefoods. Several studies have explored changes in children’s attitudes about foods or theirwillingness <strong>to</strong> try new foods. Three studies <strong>report</strong>ed that students showed a preferencefor new, healthy foods as a result of farm <strong>to</strong> school programming:►►►►►A farm <strong>to</strong> school project at Abernethy Elementary <strong>School</strong> (AES-OR) <strong>report</strong>edthat 44% of students interviewed preferred the farm <strong>to</strong> school pilot projectlunches over lunches served during the previous year. 45MIG-MI <strong>report</strong>ed an increased student excitement <strong>to</strong> try new vegetables throughtheir summer programming at Wyoming Public <strong>School</strong>s in Grand Rapids, MI. 10Th e program conducted a “veggie vote” and <strong>report</strong>ed that 53% of students hadtried a new vegetable over the summer when the program was operational.Students also <strong>report</strong>ed an increased preference for 3 out of 5 vegetables offered(beets, peppers and salad greens).Almost half of the students (42%) surveyed in the BTV-VT program indicateda preference for more fruit <strong>to</strong> be served in the breakfast program, as a result ofthe farm <strong>to</strong> school activities in school. 14,46As many as 74% of students who participated in taste tests conducted throughthe BTV-VT program said that the food was new <strong>to</strong> them; 43% were more willing<strong>to</strong> try new foods because of their experience with the taste tests. 14,46Students from Edmunds Elementary and Middle <strong>School</strong> in the BTV-VT programdemonstrated a change in perception about fast food establishments. Inthe pre-assessment, 59% of boys and 65% of girls were of the opinion that theycould eat healthy food at a fast food restaurant, only 32% of boys and 57% of girlsagreed <strong>to</strong> the statement in the post-test. 14,46Review of <strong>Farm</strong> <strong>to</strong> <strong>School</strong> Evaluation Literaturewww.farm<strong>to</strong>school.org 31
Comparative Research: Nutrition Education and Student Dietary BehaviorsSmall school-based effectiveness trials increase vegetable and fruit consumption amongyouth. Stables GJ, Young EM, Hower<strong>to</strong>n MW, Yaroch AL, Kuester S, Solera MK, Cobb K,Nebeling L. Journal of the American Dietetic Association. 2005; 105(2): 252-256.Review of <strong>Farm</strong> <strong>to</strong> <strong>School</strong> Evaluation LiteratureTh is review article <strong>cover</strong>ed <strong>eval</strong>uations of 5 A Day program interventions aimed at studentswith a control group and examined the outcome of fruit and vegetable intake. Th e sevenprojects included used a variety of nutrition education approaches including classroomlessons, farmers’ market <strong>to</strong>urs, media campaigns, parent activities, and lunch lessons.Different intervention and <strong>eval</strong>uation components were employed by the various projects.Four of the seven projects showed a signifi c ant change in fruit and vegetable consumption,ranging from +0.2 <strong>to</strong> +0.7 serving net change compared <strong>to</strong> the control groups. Of those fourprojects with signifi c ant changes, three of them are partially due <strong>to</strong> decreased consumptionin the control group, along with increase or no change in the treatment groups.Changes in student behavior<strong>Farm</strong> <strong>to</strong> school programs are based on the premise that students will choose <strong>to</strong> eat moreof healthy foods including fruits and vegetables, if the products are fresh, locally grown,picked at the peak of their flavor, and supplemented by educational activities.Seven studies demonstrated that students participating in farm <strong>to</strong> school programs areoffered more fruits and vegetables. Students subsequently choose the fresh fruits andvegetables, irrespective of whether an alternative meal option is available on that day.Students take more fruits and vegetables from the cafeteria offerings►In 2003-04, digital pho<strong>to</strong>graphs of students’ meal trays at the Crunch LunchProgram in Davis, CA (CLP-CA) were used <strong>to</strong> gather data about what childrenwere consuming from the salad bar meals. 18 Data revealed that farm <strong>to</strong> schoolsalad bars increased fruit and vegetable consumption with students taking morethan the USDA minimum requirement. i In 2004-05, plate waste studies wereundertaken <strong>to</strong> determine how much of the fruits and vegetables taken on thetrays were actually consumed by the students. 19Th ese studies were limited <strong>to</strong> data collection at three schools in the district that operatea comprehensive waste management and recycling program. The plate waste study resultsshowed that, on average, 49% of fruits and vegetables served at the salad bar wereconsumed, compared <strong>to</strong> 66% of fruits and vegetables served through the hot lunch.However, it is important <strong>to</strong> note that on two out of three hot lunch days, apple juice accountedfor approximately 50% of the <strong>to</strong>tal count of fruits and vegetables consumed. Inaddition, on salad bar days, about 85% of students <strong>to</strong>ok servings of fruits and vegetables,whereas at the hot lunches, only about 35% of children served themselves fruits andvegetables. The fruits and vegetables taken by students from the salad bar were 80-90%raw or unprocessed, whereas the fruits and vegetables taken from the hot lunch were80-90% processed.iUSDA <strong>School</strong> Meals Initiative for Healthy Children is based on Food Based Menus. With Food BasedMenus, foods from specific food groups and in specifi c quantities must be offered. The minimum USDArequirement in the meal component of Vegetables/Fruits for grades K-6 is two or more servings ofvegetables and/or fruits, which is equivalent <strong>to</strong> 3/4 cup per child per day plus 1/2 cup extra over a week.32 Bearing Fruit: <strong>Farm</strong> <strong>to</strong> <strong>School</strong> Evaluation Resources and Recommendations
►►►Pho<strong>to</strong>graphic comparisons of lunch trays and analysis of menu productionrecords from the Comp<strong>to</strong>n Unifi e d <strong>School</strong> District (COM-CA) in Californiain 2004-05 showed that students eating farm <strong>to</strong> school salad bar lunches <strong>to</strong>okbetween 90% and 144% of recommended daily servings of fruit and vegetableswhile students eating hot lunches <strong>to</strong>ok between 40% and 60% of recommendedservings. Both groups of students <strong>to</strong>ok close <strong>to</strong> the recommended amounts ofproteins and grains. 20Results from the AES-OR program show that the average servings of fruits andvegetables taken by students rose from 1.26 (pre-salad bar) <strong>to</strong> 2.26, an increase of1 serving a day per child as a result of the farm <strong>to</strong> school salad bar program. 45During 2004-06, students from Jeff e rson Elementary <strong>School</strong> in the Riverside<strong>Farm</strong> <strong>to</strong> <strong>School</strong> Program (RSD-CA) who chose the hot lunch meal <strong>to</strong>ok 1.49servings of fruits and vegetables per meal, whereas students who chose a saladReview of <strong>Farm</strong> <strong>to</strong> <strong>School</strong> Evaluation LiteratureDigital pho<strong>to</strong>graphs of salad bar lunch trays from Davis Joint Unified <strong>School</strong> District, CA►bar lunch <strong>to</strong>ok an average of 2.43 servings of fruits and vegetables per meal.Th u s, students who ate the salad bar received, on average, 63% more servingsof fruits and vegetables than students who ate the hot lunch meal. Salad barlunches met an average of 125% of USDA recommended daily allowances forfruits and vegetables for children. 47Olympia Unifi e d <strong>School</strong> District schools with Organic Salad Bar programs(OSB-WA) <strong>report</strong>ed a 29% increase in fruits and vegetables taken by studentsat Lincoln Elementary and a 25% increase at Pioneer Elementary compared <strong>to</strong>schools where no salad bar was offered (2003-04 data). 48www.farm<strong>to</strong>school.org 33
Comparative Research: Salad Bars and Produce ConsumptionSalad bars and fruit and vegetable consumption in elementary schools: A plate waste study. Adams MA,Pelletier RL, Zive MM, Sallis JF. Journal of the American Dietetic Association. 2005; 105:1789-1792.Review of <strong>Farm</strong> <strong>to</strong> <strong>School</strong> Evaluation LiteratureTh is small study examined diff e rences in fruit and vegetable consumption between self-servesalad bars and proportioned meals. The study was conducted in two San Diego County schooldistricts with diff e rent food offerings. Using food plate waste data from 288 students at fourschools, the researchers found no significant diff e rence in fruit and vegetable consumptionbetween students that served themselves and those that were served proportioned items.Th e variety of items available did impact consumption as the lunch program with thegreatest number of fruit and vegetable offerings also had the highest consumption.Students choose farm <strong>to</strong> school meals over hot meal options►►►In the Ventura Unified Healthy <strong>School</strong>s Program (VEN-CA), students chosefarm <strong>to</strong> school salad bar meals at a ratio of approximately two <strong>to</strong> one over hotmeal entrees. Th e salad bar was more popular than all twelve hot entrees offeredon salad bar days (2002-03 data). 49In March 2005 when the RSD-CA farm <strong>to</strong> school salad bar program was initiated,a record 65% of students chose the salad bar lunch over hot lunch. Afterthe initial excitement wore off, participation numbers leveled off <strong>to</strong> 26%, wherethey have remained since then. An unexpected result of the program has been anearly 9% increase in overall school meal participation, including growth in thenumber of teacher meals served. Prior <strong>to</strong> the salad bar, the school served approximatelysix teacher meals per month, post-salad bar they served an averageof 11 teachers per day nearly all of whom eat salad bar lunches. This growth inparticipation has resulted in a substantial increase in revenues that help makethe program financially sustainable.In the COM-CA program, two farm <strong>to</strong> school sites had an average of 54.6% and21.9% of students choosing salad bar meals over hot meals. 20Students self-<strong>report</strong> healthier diets by an increase in consumption of fruits andvegetables and healthy foods or a decrease in consumption of unhealthy foods►Students participatingin the Los Angeles Unifie d Salad Bar Project(LSB-CA) from 2000-01 <strong>report</strong>ed that theyate an average of 4.09daily servings of fruitsand vegetables after afarmers’ market saladbar was introducedat their school compared<strong>to</strong> 2.97 servingsper day before the34 Bearing Fruit: <strong>Farm</strong> <strong>to</strong> <strong>School</strong> Evaluation Resources and Recommendations
►►►salad bar started. 50 The <strong>to</strong>tal grams of fruit and vegetable servings consumed bystudents also increased signifi c antly from 344.1 gm <strong>to</strong> 415.8 gm daily (p = 0.07).Th e researchers attributed the 84% increase in fruit and vegetable consumptionalmost entirely <strong>to</strong> the farm <strong>to</strong> school salad bar program. Children eating lunchat the farmers’ market salad bar also <strong>report</strong>ed eating reduced amounts of <strong>to</strong>talcalories, cholesterol, and <strong>to</strong>tal fat in their daily diets.ESY-CA students who made gains in their overall understanding of ecologicalprinciples showed a significant improvement in the numbers of servings of fruitsand vegetables they <strong>report</strong>ed eating. 28In the FFF-IL schools, 42% of students self-<strong>report</strong>ed eating 3 <strong>to</strong> 4 servings offruits and vegetables per day before the farm <strong>to</strong> school curriculum was implemented.43,44 This percentage increased <strong>to</strong> 53.6% during the post-test. Studentsalso self-<strong>report</strong>ed healthier eating behaviors as a result of the curriculum. (Seepage 36).Over half of the students (60%) surveyed in the BTV-VT schools <strong>report</strong>ed eatingfruit more often as compared <strong>to</strong> a previous year when the farm <strong>to</strong> schoolprogram was not in place. 14,46 Further, 59% <strong>report</strong>ed eating new foods and 57%<strong>report</strong>ed eating healthy snacks more often; many students also said that they ateless healthy foods less often, such as fast food (56% less) and desserts and sweets(31% less).Parents <strong>report</strong> healthier eating patterns in children►Th e FTK-PA study administered a dietary survey <strong>to</strong> parents in both interventionand control schools. Results showed that children who received the farm <strong>to</strong>school intervention were opting for more healthy foods. 26,27,51 Specifically therewas an increase in their mean weekly consumption of healthy foods such aswhole grain bread and a decrease in consumption of foods high in fat and salt.Comparative Research: Environmental Interventions in <strong>School</strong>sEnvironmental interventions for eating and physical activity: A randomized controlled trial inmiddle schools. Sallis JF, McKenzie TL, Conway TL, Elder JP, Prochaska JJ, Brown M, Zive MM,Marshall SJ, Alcaraz JE. American Journal of Preventive Medicine 2003, 24(3): 209-217.Review of <strong>Farm</strong> <strong>to</strong> <strong>School</strong> Evaluation LiteratureResearchers conducted a randomized controlled trial with aims <strong>to</strong> increase physical activity and reducefat intake among students in San Diego middle schools. The interventions consisted of physical activitycomponents (including increased physical activity in daily PE classes, increased physical activityoutside PE class, purchase of equipment, promotions in newsletters and bulletin boards) and nutritioncomponents (increased offerings of low-fat choices in the cafeteria, food service stafftrainings onhealthy food preparation, and promotional materials). Environmental and physical components ofthe project increased school-based physical activity among boys, but the low-fat intervention had nosignificant effect on fat consumption. The researchers identified fi n ancial and structural barriers <strong>to</strong>implementing the interventions, including food services’ requirement <strong>to</strong> be self-supporting and smallmarketing efforts for low-fat foods compared <strong>to</strong> the barrage of marketing for popular snack foods.www.farm<strong>to</strong>school.org 35
Students Report Changes in Eating Behaviors,Examples from FFF-IL Program: 43,44Review of <strong>Farm</strong> <strong>to</strong> <strong>School</strong> Evaluation Literature36 Bearing Fruit: <strong>Farm</strong> <strong>to</strong> <strong>School</strong> Evaluation Resources and Recommendations
Comparative Research: Benefits of <strong>School</strong> GardensUse of school gardens in academic instruction. Graham H, Beall DL, Lussier M, McLaughlinP, Zidenberg-Cherr S. Journal of Nutrition Education and Behavior. 2005; 37:147-151.A survey of California school principals identifi e d reasons and perceived benefits of schoolgardens. Fifty-seven percent of respondents <strong>report</strong>ed a garden at their school, and thegardens were “predominantly used by most schools <strong>to</strong> enhance academic instruction.”Positive behavioral changes are associated with farm <strong>to</strong> schoolTh e mean weekly consumptionof fruits for the experimentalgroup was seven times a week,while for the control groupit was only six times a week.Th ere was no statistical differencein the average weeklyconsumption of vegetables.Self-<strong>report</strong>s of healthier eatingby students in the FFF-ILschools were corroborated byparents <strong>report</strong>ing that theirchildren were eating moregreen salad at home. 43,44<strong>School</strong>-based programs that offer more nutritious foods have been associated withhaving positive psychosocial impacts such as improvement in academic performance,discipline and attentiveness, as well as in health indica<strong>to</strong>rs such as BMI and weight, andother lifestyle changes. <strong>Farm</strong> <strong>to</strong> school programs have demonstrated limited impactson these indica<strong>to</strong>rs, though it has not been a focus of program <strong>eval</strong>uation thus far. Twoprograms have studied these impacts <strong>to</strong> some extent.►►Th o ugh the FTK-PA program did not show a difference in students’ BMI overa one year period, students did <strong>report</strong> a decrease in the amount of time theyspent in front of the television and other screen media. The same study <strong>report</strong>edpositive changes on the DIBELS sound fluency scale (measure of phonologicalawareness that assesses a child’s ability <strong>to</strong> recognize and produce the initialsound in an orally presented word) and the nonsense word fl u ency scale (a tes<strong>to</strong>f the alphabetic principle - including letter-sound correspondence and of theability <strong>to</strong> blend letters in<strong>to</strong> words in which letters represent their most commonsounds). 26,27,51Parents of students participating in the Healthy City project, a component ofBTV-VT <strong>report</strong>ed positive changes in their children, such as healthier eatinghabits, eating more fruits and vegetables, being more responsible, improvedsocial skills and self-esteem, saving money, and improved work-ethic. Skillsand knowledge gained included gardening, leadership, self-esteem, social skills,knowledge of the environment and healthy eating. 14,46Review of <strong>Farm</strong> <strong>to</strong> <strong>School</strong> Evaluation Literaturewww.farm<strong>to</strong>school.org 37
Teacher ImpactsReview of <strong>Farm</strong> <strong>to</strong> <strong>School</strong> Evaluation LiteratureIn addition <strong>to</strong> changes observed in students participating in a farm <strong>to</strong> school program,several positive changes have been demonstrated amongst school teachers and administrativepersonnel who may be participating in the program only indirectly.►►►►►ESY-CA teachers gave a significantly higher rating <strong>to</strong> the learning environment intheir school than did teachers in the control school. 28Th e majority of teachers (78%) involved in the FFF-IL curriculum found that itwas “easy” or “very easy” <strong>to</strong> integrate nutrition education concepts in their regularcurriculum and none found it “<strong>to</strong>o hard.” 43,44Ninety-two percent of teachers responding <strong>to</strong> a survey conducted for the CSAin the Classroom (CSA-CA) program in Los Angeles said that they were “veryhappy” with the usefulness of the produce in delivering nutrition education messagesand 74% were “very happy” with the usefulness of the produce in delivering5-A-Day messages. As many as 94% of the participating teachers indicated awillingness <strong>to</strong> participate in the program again. 52All teachers (100%) who responded <strong>to</strong> a survey about the Riverside Harvest of theMonth program (RHM-CA) <strong>report</strong>ed that the educational and promotional materials,including the Harvest of the Month calendar, teacher meetings, monthlynewsletters, farmers’ market <strong>to</strong>ur, farmer in the classroom sessions, and monthlytaste tests were “very useful” or “fairly useful.” 53 When asked if they plan <strong>to</strong> repeatany of the Harvest of the Month activities in the future, 50% of the teachersanswered yes, and 25% said no because of fac<strong>to</strong>rs not associated with the curriculum,such as their unavailability for teaching in the coming year.Based on a survey and focus group discussion, all teachers from Edmunds Elementaryand Middle <strong>School</strong> participating in the BTV-VT program <strong>report</strong>edan increase in awareness about food, farm and nutrition issues, as well as beliefthat lessons on food, farms and nutrition would affect children’s long-term foodchoices; 71% <strong>report</strong>ed an improvement in their own diets as a result of the program.14,46Comparative Research: Fac<strong>to</strong>rs Affecting Nutrition and Physical Activity in <strong>School</strong>sSwimming upstream: Faculty and staff members from urban middle schools in low-incomecommunities describe their experience implementing nutrition and physical activityinitiatives. Bauer KW, Patel A, Propkop LA, Austin SB. Preventing Chronic Disease [serialonline] 2006 Apr. Available from www.cdc.gov/pcd/issues/2006/apr/05_0113.htm.Th is qualitative study was conducted in five urban schools <strong>to</strong> learn more about fac<strong>to</strong>rs that enableor impede nutrition and physical activity improvements among students in low-income schools.Focus groups with approximately seven participants were held at schools where a classroom-basedcurriculum had been implemented. Several key themes emerged related <strong>to</strong> nutrition, physical activityopportunities, and weight-related teasing. Teachers were concerned about the contradictions betweenthe classroom messages and the cafeteria offerings. Th ey also expressed concern for low-income studentsthat did not qualify for free or reduced-lunch yet weren’t able <strong>to</strong> bring nutritious meals from home.38 Bearing Fruit: <strong>Farm</strong> <strong>to</strong> <strong>School</strong> Evaluation Resources and Recommendations
Policy Impacts<strong>Farm</strong> <strong>to</strong> school supporters are interested in perceiving impacts of the farm <strong>to</strong>school program not just at the student level but also at the institutional level.<strong>Farm</strong> <strong>to</strong> school programs transform the school food environment by providing aforum for discussions around food and health.Th e introduction of a farm <strong>to</strong> school program or organizing efforts around farm <strong>to</strong>school can lead <strong>to</strong> changes throughout the school environment such as increasedteacher interest and motivation <strong>to</strong>ward <strong>to</strong>pics such as food, addition of gardening andenvironmental curricula, improvements in cafeteria environment, increased recesstimes and policy changes incorporating more stringent food and nutrition standards,local purchasing pro<strong>to</strong>col, and healthy lifestyles for children.►For example, the BTV-VT program demonstrated a shift in school culturearound healthy food and nutrition as a result of the farm <strong>to</strong> school program. Inaddition <strong>to</strong> an increase in student and teacher awareness about healthy foods,farming, and nutrition issues, there was an increase in the community participationat school dinners, teachers started documenting the programs’ lesson plansso that they can be used in the future, and the school board accepted the <strong>School</strong>Food Action Plan. The program was also supported by policies such as the Wellnessand Nutrition Policy (Act 161) and the <strong>Farm</strong> <strong>to</strong> <strong>School</strong> Policy (Act 145) 54enacted by the Vermont Legislature.Of the studies reviewed for this <strong>report</strong>, none specifi c ally focused on assessing policyoutcomes, though several policies at the school district and state level have been facilitateddue <strong>to</strong> successful models in operation. In this section, we present a few examples ofdistrict, county and state level policies passed that may support farm <strong>to</strong> school efforts.Changes in school district nutrition policy►<strong>Farm</strong> <strong>to</strong> school programs have facilitated the development of comprehensivefood and nutrition policies in school districts, even before the federal mandatefor schools <strong>to</strong> develop local wellness policies came in<strong>to</strong> effect. These policiessupport farm <strong>to</strong> school efforts by including language that:■Mandates the preferential purchasing of localfoods when possible, examples include:Review of <strong>Farm</strong> <strong>to</strong> <strong>School</strong> Evaluation LiteratureAlisal Unified <strong>School</strong> District Nutrition Policy. 55Missoula County Public <strong>School</strong>s Resolution passed May 2006. 5■■Supports nutrition education or school gardens, examples include:Santa Monica-Malibu Unifi e d <strong>School</strong> District Nutrition andPhysical Activity Policy. 57Establishes stringent standards for foodsoffered in schools, examples include:Comprehensive <strong>School</strong> Nutrition Policy for Philadelphia schools. 58Seattle Public <strong>School</strong>s Nutrition Policy. 59www.farm<strong>to</strong>school.org 39
Comparative Research: Verbal Prompts for Fruit and JuiceTh e influence of a verbal prompt on school lunch fruit consumption: apilot study. Schwartz MB. International Journal of Behavioral Nutritionand Physical Activity. 2007; 4:6 doi: 10.1186/1479-5868-4-6.Review of <strong>Farm</strong> <strong>to</strong> <strong>School</strong> Evaluation LiteratureResearchers conducted a small pilot test <strong>to</strong> determine if students purchasing school lunch wouldbe more likely <strong>to</strong> take and eat fruit or juice if a cafeteria worker gave them a verbal prompt. Th eyfound that students were more likely <strong>to</strong> take fruit and juice if they were specifically asked “Wouldyou like fruit or juice with your lunch?” Students were more likely <strong>to</strong> actually eat the fruit theyhad chosen with the prompt, but they were not more likely <strong>to</strong> drink the juice that was taken afterthe prompt. Th is study suggests that verbal cues as part of the school food environment couldincrease fruit consumption among elementary school students, but more studies are needed.With the local wellness policies, school districts have a unique opportunity <strong>to</strong> embraceefforts such as farm <strong>to</strong> school and use the opportunity <strong>to</strong> develop lasting policies thatwill ensure health and nutrition for school children in years <strong>to</strong> come. Policy changesthat promote farm <strong>to</strong> school purchasing and educational programming ensure that theprogram is not dependent on the presence of a supportive individual <strong>to</strong> carry it through.Policy support is one way of institutionalizing the farm <strong>to</strong> school approach in schooldistricts across the country. All five school districts listed on the previous page <strong>report</strong>that changes in the districts’ nutritional policy contributed <strong>to</strong> the continued success ofthe farm <strong>to</strong> school programs.Changes in city, county, state and federal policyInformation available from the National <strong>Farm</strong> <strong>to</strong> <strong>School</strong> <strong>Network</strong> on county and statepolicy initiatives and organizing efforts around farm <strong>to</strong> school are listed here for reference.►Missoula County, MT encourages the purchase of local agricultural productsthrough legislation enacted in 2005. The Missoula Greenhouse Gas and EnergyEfficiency Plan and Joint Resolution 6889, state that both the city and countygovernments will “actively support efforts <strong>to</strong> increase the security of the localfood system so that it is based on sustainable agriculture.” 60At the state level, approximately 19 states have already passed legislation relating <strong>to</strong>the purchase of local fresh fruits and vegetables, and many more are in the works. 61Th e various types of state policies that have been proposed or passed are highlightedbelow:►►►►Allocate additional funds for fruits and vegetables, using local product whenavailable, e.g. in CA, 62 NY, 63 WA. 64When price, quality and other fac<strong>to</strong>rs are equal, local product shall be preferentiallypurchased, e.g. in CO, 65 KY, 66 WA. 67State sets up a fresh fruit and vegetable pilot program, requiring local freshproduct when possible, e.g. in CO. 68A portion of funding from an established program is designated <strong>to</strong>wards purchasinglocal fruits and vegetables, e.g. in CO. 6840 Bearing Fruit: <strong>Farm</strong> <strong>to</strong> <strong>School</strong> Evaluation Resources and Recommendations
►►►►►►►►<strong>Farm</strong> <strong>to</strong> school promotional and educational events are established, e.g. in NY, 69CT. 70A <strong>Farm</strong> <strong>to</strong> <strong>School</strong> Program is established within a state agriculture or educationdepartment, e.g. in KY, 66 OK, 30 CT, 70 IA, 71 OR. 72Resolution requesting that Congress pass farm <strong>to</strong> school related legislation, e.g.in NM, 73 PA, 74 DE. 75A price buffer, or preference, is allowed for local product, e.g. in MA 76 , MD. 77Th e minimum amount required for an open bid process is increased for localproducts, e.g. in MA. 76A resolution requires that the specifi c state departments work <strong>to</strong>gether <strong>to</strong> implementfarm <strong>to</strong> school programs, e.g. in NM, 73 NY. 63A mini-grant program is established for farmers and schools and/or school districts,eg. in VT 78 , PA. 79On the federal level, Section 122 of the 2004 Child Nutrition Act authorized afarm <strong>to</strong> cafeteria program, however, funds were never appropriated. Every fouror five years, there is an opportunity for all of those concerned with the health ofour nation’s children <strong>to</strong> <strong>eval</strong>uate, defend, and improve the federal Child NutritionPrograms. Visit www.farm<strong>to</strong>school.org <strong>to</strong> learn more about state, regional,and national policy priorities and efforts.Review of <strong>Farm</strong> <strong>to</strong> <strong>School</strong> Evaluation Literaturewww.farm<strong>to</strong>school.org 41
Review of <strong>Farm</strong> <strong>to</strong> <strong>School</strong> Evaluation LiteratureFood Service ImpactsMany farm <strong>to</strong> school programs start from and are rooted in changes <strong>to</strong> thecafeteria offerings, which may require modifications <strong>to</strong> the food service program.In order <strong>to</strong> use local product, school food service may need <strong>to</strong> employadditional workers <strong>to</strong> wash, cut, and prepare freshly harvested produce, or processother local products before they can be offered on the cafeteria line. The support ofthe food service direc<strong>to</strong>r and cafeteria staff is crucial <strong>to</strong> the success of a farm <strong>to</strong> schoolprogram.Nine of the programs studied assessed the impacts of farm <strong>to</strong> school programs on foodservice operations. With an improvement in cafeteria food quality and taste, these studies<strong>report</strong> an increase in overall school meal participation rates in the range of 3 -16%.More specific impacts on the food service operations are listed below:<strong>Farm</strong> <strong>to</strong> school programs offer greater variety and quantities of fruits and vegetables<strong>to</strong> students►►►Trend data available from 2002-06 for the CLP-CA program shows that the farm<strong>to</strong> school salad bar offered a wider variety of fruits and vegetables than the hotlunch option. 80 In 2004-05, the salad bar offerings contributed, on average, 87%of the USDA recommended daily requirements of fruits and vegetables for children.18 During the 2004-05 school year, students eating farm <strong>to</strong> school salad barwere offered an average of 105% of the recommended daily serving of fruits andvegetables during lunch – almost twice as much as students eating hot luncheswho were served an average of 58% of the recommended servings. 19Students in the Winters Unified <strong>School</strong> District Program (WSD-CA) eatingthe farm <strong>to</strong> school salad bar meal during the 2003-2004 and 2004-2005 schoolyears were served between 107% and 177% of the recommended daily servingsof fruits and vegetables. 18Th e <strong>School</strong>FoodPlus program in <strong>New</strong> York (SFP-NY) <strong>report</strong>ed that by the endof school year 2004-05, thirty-two <strong>School</strong>FoodPlus plant-based recipes hadbeen created, tested, and served as part of the school menu cycle with varyingfrequency on a citywide basis. From December 2004 <strong>to</strong> June 2005, these recipes81, 82appeared on the citywide menu cycles 97 times.<strong>School</strong> meal participation rates increase when schools implement farm <strong>to</strong> schoolprograms►Th e CLP-CA program recorded an increase of 7% <strong>to</strong> 11% in student participationin the lunch program at schools introducing farm <strong>to</strong> school salad bars.Overall participation in the salad bar lunches ranged from a low of 23% <strong>to</strong> a highof 41%, with an overall average of 32.4% of enrollment; in comparison <strong>to</strong> 26%participation before the salad bars were introduced. 8042 Bearing Fruit: <strong>Farm</strong> <strong>to</strong> <strong>School</strong> Evaluation Resources and Recommendations
►►►►►Student lunchparticipation at anelementary schoolin the VEN-CAprogram rose from50% <strong>to</strong> 56% over thefi r st two years that afarm <strong>to</strong> school programwas in place. 49On days when staffand teachers had achoice between afarm <strong>to</strong> school saladbar lunch and a hotlunch, they chosethe salad bar mealby a fourteen <strong>to</strong> oneratio.Notes: CLP-CA, COM-CA represent salad bar and hot lunch meal participation;others represent pre and post salad bar meal participation.Timeline for collection of data – VEN-CA: 2 years; RSD-CA: 5months; CLP-CA: avg. over 5 years; AES-OR: 1 year; OSB-WA: 1year; CLP-CA: over 5 years; COM-CA: 1 year.At Jefferson Elementary <strong>School</strong> in RSD-CA, participation rates in the first fivemonths of a farm <strong>to</strong> school program rose 4% for students receiving free lunches,5.3% for students receiving reduced price meals, and 8.5% for paid students. Participationby adults (teachers and staff) shot up from 1.9% (just six lunches permonth) <strong>to</strong> 28.8% (133 lunches per month). RSD-CA also <strong>report</strong>ed a 9% increasein overall meal participation, including adult meals. From 1999-2005 (beforeimplementation of the farm <strong>to</strong> school program) the number of meals served bythe district grew at an average of about 2% per year. Th e school district <strong>report</strong>eda more than 25% leap in the number of meals served during the 2005-06 schoolyear as compared <strong>to</strong> 2004-05, during which time farm <strong>to</strong> school salad bars at fiveelementary schools were initiated. 47AES-OR <strong>report</strong>ed a 3% increase in participation rates (both in full-priced andreduced-priced meals) over the previous year when the program was not operational.The control school <strong>report</strong>ed no change in meal participation rates. 45Th e OSB-WA program <strong>report</strong>ed a 16% increase in school meal participation atLincoln Elementary and a 13% increase at Pioneer Elementary (as compared <strong>to</strong>previous years); they were the first two schools that implemented the organicsalad bar in 2003-04. 48Overall lunch participation at Caldwell Elementary in the COM-CA programshowed that salad bar participation was comparable <strong>to</strong> the hot lunch participation(averaging 51.6% and 50.3%, respectively). As a Provision II district whereall students can eat breakfast and lunch free of charge, Comp<strong>to</strong>n had higherlunch participation than many other non-Provision II districts. 20Review of <strong>Farm</strong> <strong>to</strong> <strong>School</strong> Evaluation Literaturewww.farm<strong>to</strong>school.org 43
Review of <strong>Farm</strong> <strong>to</strong> <strong>School</strong> Evaluation Literature►In the Santa Monica-Malibu <strong>Farm</strong>ers’ Market Salad Bar program (SMM-CA),the number of students choosing a salad bar lunch jumped by over 500% whenfruits and vegetables from the farmers’ market replaced produce from the existingsupplier. 83Financial viability of food service operations<strong>Farm</strong> <strong>to</strong> school programs generally serve fresh produce and other products that requireadditional cleaning and food preparation, potentially leading <strong>to</strong> higher labor costs. Foodfrom local farms may also be more expensive than similar items procured from largedistribu<strong>to</strong>rs. In order <strong>to</strong> expand farm <strong>to</strong> school programs <strong>to</strong> more schools and <strong>to</strong> institutionalizefarm <strong>to</strong> school meals as permanent fixtures in school cafeterias, it is critical <strong>to</strong>understand the costs associated with farm <strong>to</strong> school and <strong>to</strong> develop strategies <strong>to</strong> makethese programs financially self-supporting. <strong>Farm</strong> <strong>to</strong> school programs often require amodest initial investment of money for equipment at each school site.►VEN-CA <strong>report</strong>ed initial start-up costs in the range of $3,400 <strong>to</strong> $7,000 perschool site <strong>to</strong> buy equipment such as child-sized salad bars or extra refrigera<strong>to</strong>rspace. 49Cost of farm <strong>to</strong> school mealsResults from five studies show that farm <strong>to</strong> school meals typically cost more <strong>to</strong> preparethan non-farm <strong>to</strong> school meals.►►►►During the 2004-05 school year, the overall cost per meal for farm <strong>to</strong> schoolsalad bar meals in the CLP-CA was $2.71/meal vs. $2.27/meal for the non-saladbar meals. With income per meal at $2.14, each salad bar meal represented aloss of $0.58/meal and each non-salad bar meal represented a loss of $0.13/meal.Th e overall food costs in 2004-05 were about 21% higher for the salad bar mealsat $1.52/meal vs. $1.26/meal for non-salad bar meals (a $0.26 /meal difference).Labor costs were $0.80 per meal for a salad bar meal compared <strong>to</strong> $0.61 per mealfor non salad bar meal, a difference of 30% or $0.19 /meal. 19In COM-CA, food ingredients for farm <strong>to</strong> school salad bar meals cost an averageof $0.13 more per meal than hot meals. Labor costs at two farm <strong>to</strong> schoolsites were $0.64 and $0.48 higher per meal than two comparative non-salad barschools. 20Per-meal preparation costs of salad bar meals in a VEN-CA elementary schoolwere $1.19 (excluding protein-rich items) compared <strong>to</strong> $1.20 for a hot meal. 49AES-OR <strong>report</strong>ed that the cost of goods for the cooked-from-scratch meals attheir school was lower than at other schools in the school system ($0.94 versus$0.99). However, labor costs were much higher at the pilot school, increasingthe <strong>to</strong>tal cost per meal <strong>to</strong> $3.52 versus $1.67 for the control school. It should benoted that volunteer labor and food donations were estimated at a market valueand were included in all calculations. When district level administrative costswere included, both pilot and non-pilot schools posted a deficit. 4544 Bearing Fruit: <strong>Farm</strong> <strong>to</strong> <strong>School</strong> Evaluation Resources and Recommendations
►Th e Missoula County Public <strong>School</strong> District (MLS-MT) found, through a detailedcost analyses of 2006-07 purchases, that buying some local foods in season(apples, cantaloupe, carrot coins, carrot shredded, pota<strong>to</strong>es and salad mix)was either less expensive or no more expensive than what it would have cost <strong>to</strong>purchase comparable foods through mainstream suppliers. However, becauseother local foods were more expensive, the cost of purchasing local productsthroughout the school year amounted <strong>to</strong> an additional $1,270.96 or 11% of allproduce purchases. 60Income generation through farm <strong>to</strong> school mealsFinancial viability of the locally farmed food procurement component of the farm <strong>to</strong>school program is extremely relevant <strong>to</strong> schools, since school food service operationsare typically required <strong>to</strong> generate their own funds from sales and are not supportedby school district general funds. <strong>Farm</strong> <strong>to</strong> school programs typically increase participationrates in school meal programs, hence a promising strategy is <strong>to</strong> use revenue fromincreased lunch participation <strong>to</strong> <strong>cover</strong> some or all of the labor, equipment or productcosts associated with operating a farm <strong>to</strong> school project. The following four programs<strong>report</strong> an increase in school meal participation rates, with a subsequent increase inrevenue for the food service operations.►►►►In the VEN-CA program, revenue increased 23% per student per lunch day duringthe first two years of the farm <strong>to</strong> school salad bar program. This equaled$11,000 in increased revenue for the school lunch program for every fi v e hundredenrolled students over 200 lunch days. 49Estimates from the RSD-CA program demonstrated that an increase in studentparticipation of approximately 8% can <strong>cover</strong> the additional labor costs of theirfarm <strong>to</strong> school salad bar program. 47Teachers and staff often pay more per meal than students (for example, $3.25versus $1.90 for a full price student lunch in the VEN-CA program), so an increasein staff participation represents a significant revenue source. 49Th e ConVal <strong>Farm</strong> <strong>to</strong> <strong>School</strong> Program in <strong>New</strong> Hampshire (CON-NH) <strong>report</strong>edan increase in food service revenue from $600,000 <strong>to</strong> $1 million in three years,attributed <strong>to</strong> increased meal participation due <strong>to</strong> the farm <strong>to</strong> school programand fees generated from their new catering operation which served local foodsat sporting and other community events. Th e new catering endeavor was seen asa critical part of sustaining the effort <strong>to</strong> serve healthy, local foods in the cafeteriaand in other venues. 84Review of <strong>Farm</strong> <strong>to</strong> <strong>School</strong> Evaluation LiteratureChanges in food procurement patternsAs a result of farm <strong>to</strong> school programs, schools change their purchasing patterns forlocal products and services. Th e following thirteen programs tracked the changes <strong>to</strong>institutional food procurement brought about due <strong>to</strong> a farm <strong>to</strong> school approach.www.farm<strong>to</strong>school.org 45
Review of <strong>Farm</strong> <strong>to</strong> <strong>School</strong> Evaluation Literature►►►At the RSD-CA program, in the peak growing seasons nearly all of the fruitsand vegetables served were from local sources. In off-peak months the salad barofferings were still about 50% local, owing <strong>to</strong> the year-round growing season inSouthern California. 47Th e VEN-CA program purchased 43% of its <strong>to</strong>tal produce needs from localfarmers in 2003-04, up from 15% in 2002-03. 49CLP-CA’s spent more than $75,000 on locally grown, farm fresh produce from2000-06. This represented more than 50% of salad bar or elementary schoollunch produce on average and more than one-third of all produce procured bythe district. Distribu<strong>to</strong>r-bought produce (from non-local sources) for the elementaryschools, by comparison, amounted <strong>to</strong> about $72,000 over the same sixyear period (about 49% of elementary produce purchases on average). Overallexpenditures for fresh, organic produce (almost $30,000 over 6 years) represented20% of elementary produce and 14% of all district produce. 80 Overall producepurchasing trends for the school district are represented in chart below.►►►Th e CSA-CA program paid $33,513 <strong>to</strong> Tierra Miguel, the local organic farm thatgrew produce for the Los Angeles Unified <strong>School</strong> District’s CSA in the classroomprogram. 52Th e SMM-CA program purchased produce worth $25,978 from local farmersin 1999-2000. 83In 2004-05, one high school in WSD-CA purchased from three local farmers, alocal farm stand, and sourced directly from an organic school garden. 1946 Bearing Fruit: <strong>Farm</strong> <strong>to</strong> <strong>School</strong> Evaluation Resources and Recommendations
►►►►►►►►COM-CA purchased about 6% of produce for its meal programs from localgrowers and about 94% from non-local food distribu<strong>to</strong>rs in 2004-05. However,the local farm purchases all occurred in the last four months of the school year,thus purchases throughout the year would possibly result in a higher percentage.20CON-NH <strong>report</strong>ed that the overall district purchases for local products accountedfor 16% of its budget, which included fresh produce, bakery items,cheese and water. 84Th e Appalachian Sustainable Agriculture Project’s <strong>Farm</strong> <strong>to</strong> <strong>School</strong> program inselect North Carolina schools (ASA-NC) <strong>report</strong>ed that local products accountfor 3-5% of all produce purchased by school districts participating in the farm <strong>to</strong>school program from four counties. 85Bend La-Pine <strong>School</strong> District in Oregon (BLP-OR) <strong>report</strong>ed that its averagespending on local products was $1,500 per week from four farmers, of whichabout $1,200 is spent on fruits and the rest on vegetables. 86For the summer and fall meals served in <strong>New</strong> York City schools in 2005-06,SFP-NY facilitated the local purchases of 87,900 lbs of peaches, 40,700 lbs ofnectarines and 6,600 lbs of pears through the Office of <strong>School</strong> Food distribu<strong>to</strong>rs.81SFP-NY worked with a local manufacturer, Upstate <strong>Farm</strong>s Cooperative, <strong>to</strong> developa 4-oz non-fat yogurt with no artificial colors or flavors. Th e <strong>New</strong> York CityOffice of <strong>School</strong> Food now orders approximately 7,000 cases of locally producedyogurt at a value of $74,000 per month. 81BTV-VT local purchases direct from farmers increased from $0 in 2003 <strong>to</strong>$4,636 in 2006; local purchases through distribu<strong>to</strong>rs increased from $547 in2003 <strong>to</strong> $2,176 in 2006, a 298% increase. 14In the 2006-07 school year, MLS-MT purchased approximately 16,000 lbs ofMontana grown foods, which corresponds <strong>to</strong> 24.4% of all food purchases and$11,990 in income <strong>to</strong> the local economy (up from $4,563 from previous year).Local foods purchased included oats, whole wheat fl o ur, peaches, apples, cantaloupes,carrots, cucumbers, pota<strong>to</strong>es, zucchini, cheese, pasta, honey and saladgreens, with nearly all these products being organically grown. 60Review of <strong>Farm</strong> <strong>to</strong> <strong>School</strong> Evaluation LiteratureChanges in waste management practices►Th e Davis Unified <strong>School</strong> District’s Waste Management Study (DWM-CA) assessedwaste reduction in 2001 linked <strong>to</strong> a farm <strong>to</strong> school program. With datacollected over a one year period, the study estimated gross savings of $6,320in disposal fees from programs at two elementary schools. This estimate didnot include reductions in cus<strong>to</strong>dial staff time and materials, nor did it includeprogram costs, or account for the value of the educational opportunities that theprogram provided <strong>to</strong> students. Th e waste stream at Cesar Chavez Elementarywww.farm<strong>to</strong>school.org 47
Review of <strong>Farm</strong> <strong>to</strong> <strong>School</strong> Evaluation Literaturewas reduced by 47%, with an estimated savings of $2,800 for the school year. AtPioneer Elementary, waste reduction was estimated at 50% for the school year,with savings of $3,430. 87Impacts on food service staffFood service staff is a specifi c segment of the school population that is integral <strong>to</strong> thesuccess of the farm <strong>to</strong> school effort. In general, farm <strong>to</strong> school programs are ultimatelydirected <strong>to</strong>wards impacting school food service purchasing and serving behaviors andthereby what is served in school cafeterias, though this aspect is often not written inas an objective of the program. However, not only does a successful farm <strong>to</strong> schoolprogram facilitate changes <strong>to</strong> overall school food service operations, it often improvesthe knowledge, awareness and interest of school food service staff <strong>to</strong>wards local foods,agriculture and healthy recipes. Anecdotal evidence is available of improved moraleand job satisfaction of food service and kitchen workers participating in a farm <strong>to</strong> schoolprogram.►►Feedback from participants at food service professional development workshopsconducted through BTV-VT revealed that 35% of food service professionals feltthat they had increased their knowledge about local foods for school meals; 35%agreed that they had increased their knowledge of diff e rent recipes <strong>to</strong> makenutritious meals in schools; 29% <strong>report</strong>ed that they would plan <strong>to</strong> interact morewith teachers at their school sites; and 52% stated that using local foods in schoolmeals was very important. 14,46As a result of taste tests conducted in the BTV-VT program, food service staffhave slowly started integrating new local foods in the school cafeteria menus:raw vegetables are offered in sandwiches and salad bars, prepared items servedon the monthly menu include minestrone soup, cinnamon apple sauce, yogurtparfaits with granola, chicken Caesar salad and pes<strong>to</strong> pasta. Samosas and calzonesare prepared off site by a local business and served on occasion duringlunch.48 Bearing Fruit: <strong>Farm</strong> <strong>to</strong> <strong>School</strong> Evaluation Resources and Recommendations
<strong>Farm</strong>er Impacts<strong>Farm</strong> <strong>to</strong> school programs can open up the expansive school food market <strong>to</strong> localfarmers. His<strong>to</strong>rically, small family farmers have found it difficult <strong>to</strong> access thecumbersome procurement systems of brokers and “middle men” who serviceschools and other large institutions. Data from farm <strong>to</strong> school programs suggests thatschools can dedicate a significant percentage of their food budget <strong>to</strong> local foods. If thenumber of participating schools and larger school districts could continue <strong>to</strong> increase,farm <strong>to</strong> school procurement could come <strong>to</strong> represent a sizable and stable market forsmall, local farmers. Data on this aspect of farm <strong>to</strong> school impacts has been limited,though participating farmers typically <strong>report</strong> that farm <strong>to</strong> school programs contributeapproximately 5-10% of their income. Of the studies compiled for this <strong>report</strong>, nine describedthe impacts on farmers.►►►►►As of May 2006, the two farmers participating in the RSD-CA program averagedmore than $1,700 per month in produce sales <strong>to</strong> the district. Furthermore,both farmers have become very involved with the district: hosting fi e ld trips forstudents <strong>to</strong> visit their farms, speaking at ‘farmer in the classroom’ presentations,and participating in a Riverside <strong>Farm</strong> <strong>to</strong> <strong>School</strong> Workshop. This farm <strong>to</strong> schoolprogram has thus extended the farmers’ relationships in<strong>to</strong> the classroom. 47CLP-CA purchases from local farmers ranged from $16,201 in 2003-04 (46%of <strong>to</strong>tal salad bar purchases), <strong>to</strong> $22,805 in 2004-05 (65% of <strong>to</strong>tal salad bar purchases),and dropping down <strong>to</strong> $8,000 in 2005-06, when the district started servingpre-packaged salads instead of a salad bar. 80 Over the years the district haspurchased from up <strong>to</strong> nine individual local growers and a Northern Californiadistribu<strong>to</strong>r who buys from a group of 18 local producers. Th e percentage offarmer income from the school district account probably decreased over the sixyears. For most growers, the school account represented less than 5% of <strong>to</strong>talincome. In 2005-06, this may have been even lower than 2%, with the exceptionof a kiwi farmer who <strong>report</strong>ed district sales representing about 40% of his directsales income in 2004-05.All farmers in the BTV-VT program stated that they enjoyed having the opportunity<strong>to</strong> educate students about their farms, and that the school field tripsprovided them with some direct marketing opportunities. 14Between June 2005 and May 2006, produce farmers selling <strong>to</strong> schools in theMassachusetts <strong>Farm</strong> <strong>to</strong> <strong>School</strong> Program (FTS-MA) grossed more than $55,000in K-12 sales. 88A 2002 study of six farmers supplying <strong>to</strong> farm <strong>to</strong> school projects in diff e rentregions of California <strong>report</strong>ed that overall, farmers were dedicated <strong>to</strong> the ideaof the farm <strong>to</strong> school approach and were passionate about the philosophicalunderpinnings of the program. However, profits and quantities were <strong>to</strong>o small<strong>to</strong> contribute <strong>to</strong> an overall profit margin. Nevertheless, farmers held the pro-Review of <strong>Farm</strong> <strong>to</strong> <strong>School</strong> Evaluation Literaturewww.farm<strong>to</strong>school.org 49
Review of <strong>Farm</strong> <strong>to</strong> <strong>School</strong> Evaluation Literature►►►►gram in high esteem and wanted <strong>to</strong> nurture it for its potential benefits. Becausethe program’s values were in line with their own values, these farmers werecommitted <strong>to</strong> making the program work. And even though the farm <strong>to</strong> schoolmarketing was not yet contributing much <strong>to</strong> their business profits, it appears <strong>to</strong>be contributing indirectly through the synergy it creates among farmers, schoolpersonnel, parents, children and other community members. 89Th e CSA-CA program generated $33,513 in revenues for the participating farmduring the 2002-03 pilot year. Th is amount was modest, though not insignificantfor the farm, and helped established connections for future programmingat schools. 52As a result of SFP-NY efforts, Champlain Valley secured a $4.2 million, threeyearcontract <strong>to</strong> provide <strong>New</strong> York-grown, processed and packed apple slices <strong>to</strong><strong>New</strong> York City schools. 81In an effort <strong>to</strong> replace Department of Defense-supplied baby carrots in schoolswith locally grown and processed products, SFP-NY supported local farmers intesting the <strong>New</strong> York State grown Sugar Snack variety and are working <strong>to</strong>wardsgrowing, processing and packing these in the state of <strong>New</strong> York. 81Th e number of farms from which BTV-VT purchased product increased fromthree in 2005 <strong>to</strong> five in 2006. The successful integration of foods from local farmsin the school cafeterias is attributed <strong>to</strong> relationship development between farmersand the Burling<strong>to</strong>n school district, ability <strong>to</strong> use high school cafeterias <strong>to</strong>lightly process raw foods, and availability and willingness of the school administration<strong>to</strong> incorporate local foods. The Burling<strong>to</strong>n school district contractedwith and paid farmers up front for produce and the farmers planted vegetablesspecifically designated for the schools. 1450 Bearing Fruit: <strong>Farm</strong> <strong>to</strong> <strong>School</strong> Evaluation Resources and Recommendations
Parent Impacts<strong>Farm</strong> <strong>to</strong> school programs offer parents whose children participate in the programsome educational activities such as healthy eating seminars, farm <strong>to</strong>urs and trips <strong>to</strong>the farmers’ market. If parents receive the same information children do throughthe farm <strong>to</strong> school program, changes in the family lifestyle and eating habits are morelikely <strong>to</strong> happen. Parents who are strong supporters of farm <strong>to</strong> school programs alsovolunteer their time in planning and implementing the program.Only three programs had a parent education component included in the program and<strong>report</strong>ed on its impacts.►►►FTK-PA indicated that 78% of parents <strong>report</strong>ed an increased awareness forhaving their children eat more fruits and vegetables. 26,27,51 A majority of parents(90%) felt that they had changed the way they shopped for groceries, preparedmeals and talked <strong>to</strong> their children about food. After one year of participation inthe FTK-PA, 97% of parents believed that buying locally grown food is “important”or “somewhat important.”FFF-IL parents indicated a slight increase in their ease and interest in encouragingtheir children <strong>to</strong> eat healthy snacks and meals. 43 FFF-IL parents listed avariety of changes they hoped <strong>to</strong> make in their families’ diets as a result of aParent Nutrition Education Event organized by the farm <strong>to</strong> school program. Theproposed changes included attempts <strong>to</strong> cook healthier foods at home, servingmore fruits and vegetables at home, reducing the use of sugar, reading ingredientlabels more carefully before purchasing food products, and becoming goodrole models for the children. 43,44Parents of school children in the BTV-VT program helped with taste tests andspecial event dinners, worked in classrooms and gardens, attended Food PolicyCouncil meetings and advocated for the project at the Parent Teacher Associationmeetings. All the program staff remarked about the importance of parentand community volunteers in the success of the project. Parent feedback onfamily changes as a result of the BTV-VT program revealed that 32% believedthat their family diet had improved since their child’s participation in the program;32% <strong>report</strong>ed buying more local foods; 45% were willing <strong>to</strong> pay more forthe school’s hot lunch if it contained food from local farms; and 90% believedthat lessons on food, farms and nutrition would affect children’s long-term foodchoices. 14,46Review of <strong>Farm</strong> <strong>to</strong> <strong>School</strong> Evaluation Literaturewww.farm<strong>to</strong>school.org 51
Review of <strong>Farm</strong> <strong>to</strong> <strong>School</strong> Evaluation LiteratureCommunity ImpactsOne program studied for this <strong>report</strong> (BTV-VT) addressed the broader impactsof a farm <strong>to</strong> school program on the food environment in neighborhoods, surroundingschool sites, or local food systems and distribution channels.►►BTV-VT conducted the 2006 Vermonter Poll, a statewide public opinion surveyof Vermonters. 14 Results showed that the impacts of the Food, <strong>Farm</strong> and NutritionEducation (FFN) such as the local farm <strong>to</strong> school program are reachingVermont at large. As many as 71% of parents with school age children <strong>report</strong>edthat their children had participated in the FFN program, 40% indicated thatchildren had shared FFN information with their family, 38% <strong>report</strong>ed that childrenwere willing <strong>to</strong> try new foods, and 26% <strong>report</strong>ed that their children eatmore fruits and vegetables. Parents were willing <strong>to</strong> pay an average of $1.63 morefor school lunches if the cafeteria served fresh, local food. Overall, 38% werewilling <strong>to</strong> pay between 10 cents and a dollar more for fresh local foods in theschool cafeterias.Results from the <strong>eval</strong>uation of the Burling<strong>to</strong>n Legacy Project’s Annual TownHall Meeting showed that 86% of the community was aware that there was anincrease in distribution of more fresh and local foods in Burling<strong>to</strong>n schools. Inaddition, 70% were aware that food taste testing was being conducted in someschools, and 97% of community members expressed interest in the school districtpurchasing more food from local farms.52 Bearing Fruit: <strong>Farm</strong> <strong>to</strong> <strong>School</strong> Evaluation Resources and Recommendations
IV. Conclusions andRecommendationsIn this section:ConclusionEndnotes
Previous page: Students pick lettuce at theEmerson Elementary Garden in Riverside, CA.Pho<strong>to</strong> by Riverside USD.Below: A girl holds a baby chicken inthe “Garden of Wonders” at AbernethyElementary <strong>School</strong> in Portland, OR.Pho<strong>to</strong> by Rachel Torchia.
IV. Conclusion and Recommendations<strong>Farm</strong> <strong>to</strong> school programs are based on the premise that students will choose <strong>to</strong>eat more healthy foods, such as fruits and vegetables, if the foods are fresh, locallygrown, picked at the peak of their flavor, and supplemented by educationalactivities that link them with the food cycle from seed <strong>to</strong> table. Since its launch a decadeago, the farm <strong>to</strong> school model has emerged as a strategy for schools <strong>to</strong> improve theircafeteria meals and incorporate educational opportunities for students. <strong>Farm</strong>ers havealso seen farm <strong>to</strong> school as an opportunity <strong>to</strong> explore new markets for their products.Th e term “farm <strong>to</strong> school” is better unders<strong>to</strong>od now than it was a decade ago, and thereis a growing body of <strong>eval</strong>uation results that document the process and outcomes offarm <strong>to</strong> school programs. However, well-constructed <strong>eval</strong>uation studies are still needed<strong>to</strong> <strong>cover</strong> information gaps and answer remaining key questions about farm <strong>to</strong> schoolimpacts.Due <strong>to</strong> the localized flavor of the program, the farm <strong>to</strong> school model is uniquely interpretedin every single program in the country. Th ere is a deepening understanding ofhow the model translates in different community conditions and in different growingregions. Th e program <strong>report</strong>s and <strong>eval</strong>uation studies referenced in this publication areevidence of the efforts underway <strong>to</strong> comprehend the multi-faceted implementationprocesses and effects of the farm <strong>to</strong> school approach.Th ere is a growing community of farm <strong>to</strong> school practitioners and <strong>eval</strong>ua<strong>to</strong>rs who arediligently working <strong>to</strong>wards validating the impacts of the farm <strong>to</strong> school model throughconcrete data and research. A <strong>to</strong>tal of 38 resources, program <strong>report</strong>s, <strong>eval</strong>uations andarticles were studied for this <strong>report</strong>. In presenting this review of <strong>eval</strong>uation findings and<strong>to</strong>ols from existing farm <strong>to</strong> school programs, we have tried <strong>to</strong> showcase the strength ofcurrent farm <strong>to</strong> school <strong>eval</strong>uation practice, as well as highlight the limitations and needfor future efforts. Furthermore, presenting findings from farm <strong>to</strong> school studies next <strong>to</strong>select findings from similar (but non-farm <strong>to</strong> school) school-based nutrition, health,and education interventions helps <strong>to</strong> place these farm <strong>to</strong> school findings in the largercontext of efforts <strong>to</strong> improve student health and education.In this concluding section, for each of the indica<strong>to</strong>rs highlighted in this <strong>report</strong>, wediscuss the gains made in understanding impacts of the farm <strong>to</strong> school model andfocus on future research needs.►►With regards <strong>to</strong> assessing interest in the farm <strong>to</strong> school approach, adequatebaseline data and feasibility analyses are available from across the country indicatingthat there is interest from school food service and farmers <strong>to</strong> participatein a farm <strong>to</strong> school program, as well as an understanding of strategies needed <strong>to</strong>make farm <strong>to</strong> school work under different conditions.Impacts on students represent one side of the farm <strong>to</strong> school equation. A majorityof farm <strong>to</strong> school <strong>eval</strong>uations are focused on changes at the student level,including outcomes related <strong>to</strong> knowledge and attitudes regarding local foodsand healthy eating and dietary behaviors. More comprehensive longitudinalstudies are needed <strong>to</strong> understand whether knowledge and awareness translates<strong>to</strong> specific changes in dietary behaviors and any subsequent health benefits asConclusions and Recommendationswww.farm<strong>to</strong>school.org 53
Conclusions and Recommendations►►►►a result of farm <strong>to</strong> school. A large-scale experimental design study with appropriatecontrol groups and validated measures of dietary intake would provideuseful information, but would also be expensive <strong>to</strong> conduct.Increase in fruit and vegetable consumption <strong>report</strong>ed by farm <strong>to</strong> school studiescited in this <strong>report</strong> is in the range of 0.99 <strong>to</strong> 1.3 servings per student per day. Incomparison, several other non-farm <strong>to</strong> school studies focused on school-basednutrition education interventions <strong>report</strong> a range of 0.2 <strong>to</strong> 0.99 more servings offruits and vegetables per student per day. Student dietary behavior in schools(reflected through school meal participation rates) are subject <strong>to</strong> fac<strong>to</strong>rs otherthan the quality of the food itself, such as meal cost, cafeteria environment, andlunch break time constraints <strong>to</strong> name a few. The interplay of these issues alongwith farm <strong>to</strong> school supportive activities such as school gardens, nutrition education,farm visits etc. ultimately result in the food choices children make inschool cafeterias. The contributions of all these fac<strong>to</strong>rs – individually and as awhole on student behaviors – is critical <strong>to</strong> making the lasting changes that wehope <strong>to</strong> accomplish through farm <strong>to</strong> school. More clarity and data on dietarychanges that can be facilitated and sustained in home settings is required, aswell as the exploration of a causal relationship, if any of these, with the farm <strong>to</strong>school program.Current data on farm <strong>to</strong> school impacts on school teachers is limited <strong>to</strong> knowledgeand attitudinal changes regarding farm <strong>to</strong> school implementation in theclassroom. Whether teacher involvement in one aspect of the farm <strong>to</strong> schoolprogram implementation translates in<strong>to</strong> positive lifestyle and dietary behaviorchanges has not been studied adequately.Long lasting impacts of the farm <strong>to</strong> school approach can only be sustained ifsupportive policies exist. Clearly, a lot of effort has gone in<strong>to</strong> community organizingat the school district, state, and federal levels <strong>to</strong> support farm <strong>to</strong> schoolefforts through policy advocacy, and documentation of these efforts is available.For organizers interested in learning from policy gains made at other locations,it maybe useful <strong>to</strong> develop resources and trainings based on real-life experiencesin advocating for farm <strong>to</strong> school policies.<strong>School</strong> food service is a key fac<strong>to</strong>r in determining the success or failure of afarm <strong>to</strong> school program, and hence there are several studies that have attempted<strong>to</strong> document implications from the food service perspective. Since school foodservice operations are separated from the overall district budget, it is almostimpossible <strong>to</strong> undertake a true cost benefit analysis of a holistic program such asfarm <strong>to</strong> school, which also imparts educational and community benefits <strong>to</strong> theschool. Anecdotal evidence of increase in staff morale and motivation, knowledgeabout local and seasonal foods and healthy eating is an indirect benefit thathas not been studied adequately. For example, a non-farm <strong>to</strong> school study <strong>report</strong>sthat verbal cues from school food service staff affected an increase in fruit54 Bearing Fruit: <strong>Farm</strong> <strong>to</strong> <strong>School</strong> Evaluation Resources and Recommendations
►►►and vegetables amongst students. <strong>Farm</strong> <strong>to</strong> school’s positive impacts on schoolfood service staff could potentially be a selling point for sustaining long-lastingand systemic changes in the school food environment.Despite being another side of the farm <strong>to</strong> school equation, concrete data on monetaryand other benefits <strong>to</strong> farmers is scarce. Some data from specifi c programsis available on this outcome, though generalizations are inappropriate due <strong>to</strong>wide variations in types of products, quantities, and scale of local products soldthrough each program. More resources need <strong>to</strong> be invested <strong>to</strong> delve deeper in<strong>to</strong>the impacts of direct marketing programs such as farm <strong>to</strong> school for small andmid size farmers. Data on the economic development benefits of farm <strong>to</strong> schoolfor a city, county or state is currently not available and could provide the muchneeded impetus for local governments <strong>to</strong> invest in a farm <strong>to</strong> school approach.Few studies cited in this <strong>report</strong> document farm <strong>to</strong> school impacts from the parentperspective, though there is enough anecdotal evidence that supports thisintended outcome. Increasingly, parent education is becoming a key componen<strong>to</strong>f farm <strong>to</strong> school, and its impacts need <strong>to</strong> be studied further <strong>to</strong> understand thepositive ripple effects of farm <strong>to</strong> school on families and communities.Th o ugh farm <strong>to</strong> school has the potential <strong>to</strong> affect communities at large, muchmore concrete data and information is needed <strong>to</strong> understand the role of farm<strong>to</strong> school in community dynamics and connections. It is hypothesized that farm<strong>to</strong> school programs have a role in creating and maintaining strong, vibrant communitiesthat support a local/regional food system, but little if any <strong>eval</strong>uationwork has focused on this aspect.Emerging farm <strong>to</strong> school programs should consider conducting a thorough <strong>eval</strong>uationof the various aspects of program implementation, as feasible. The <strong>to</strong>ols and resourcesneeded for conducting an <strong>eval</strong>uation may be already available through previously conducted<strong>eval</strong>uations or may be adapted <strong>to</strong> meet the specifi c needs of a program. Program<strong>eval</strong>ua<strong>to</strong>rs who have conducted the studies cited in this <strong>report</strong>, as well as other nutritionand health researchers, are eager and available <strong>to</strong> assist new farm <strong>to</strong> school program<strong>eval</strong>uations.Conclusions and Recommendationswww.farm<strong>to</strong>school.org 55
EndnotesEndnotes1.2.3.4.5.6.7.8.9.10.11.12.Community Food Project Evaluation Handbook Updated andExpanded Third Edition, March 2006, www.foodsecurity.org.Cornell <strong>Farm</strong> <strong>to</strong> <strong>School</strong> Program, <strong>Farm</strong> <strong>to</strong> <strong>School</strong> in <strong>New</strong> York State: A Survey ofK-12 Food Service Direc<strong>to</strong>rs, available at: http://farm<strong>to</strong>school.cce.cornell.eduTh e Oklahoma <strong>Farm</strong> <strong>to</strong> <strong>School</strong> Report. Including the OklahomaInstitutional Food Service Survey. Oklahoma Food Policy Council, 2003,available at: http://kerrcenter.com/ofpc/farm<strong>to</strong>school.htmIzumi BT, Rostant OS, Moss MJ, Hamm MW. Results from the 2004 Michigan<strong>Farm</strong>-<strong>to</strong>-<strong>School</strong> Survey, J Sch Health 2006 May; 76(5) 169-74.Wilkins J, Mouillesseaux-Kunzman H, Graham M, Bacelli B, Goodsell M, <strong>Farm</strong> <strong>to</strong><strong>School</strong> in the Northeast: Making the Connection for Healthy Kids and Healthy <strong>Farm</strong>s,A Toolkit of Extension Educa<strong>to</strong>rs and Community Leaders. Cornell <strong>Farm</strong> <strong>to</strong> <strong>School</strong>Program, NY <strong>Farm</strong>s! and <strong>New</strong> York <strong>School</strong> Nutrition Association, May 2006.<strong>New</strong> Mexico <strong>Farm</strong> <strong>to</strong> <strong>School</strong> Direc<strong>to</strong>ry 2007, <strong>Farm</strong> <strong>to</strong> Table and <strong>New</strong> Mexico Departmen<strong>to</strong>f Agriculture, available at: http://www.farm<strong>to</strong>tablenm.org/nm_fts_direc<strong>to</strong>ry_oct07.pdfAdapted from “Hawthorne Unified <strong>School</strong> District Student Knowledge Survey” availableat: http://socialmarketing-nutrition.ucdavis.edu/Tools/Downloads/Hawthorne_Unifi e d_<strong>School</strong>_District.pdf Giarratano Russell, S. 2004. Validity and Reliabilityof a Knowledge survey for Hawthorne Unified <strong>School</strong> District. Unpublished.Adapted from “Outcome Expectations for Eating Fruits and Vegetables,” Five a Day PowerPlay! Survey available athttp://socialmarketing-nutrition.ucdavis.edu/Tools/SomarkToolsList.php?key_m=16Baranowski T, Davis M, Resnicow K, Baranowski J, Doyle C, Smith M, Lin L, Wang DT.Gimme 5 fruit and vegetables for fun and health: Outcome Evaluation. Health Education &Behavior 2000; 27(1):96-111.California Nutrition <strong>Network</strong>. (2005) Five a Day Power Play! Pre-Post Impact Survey.Unpublished.Saunders, R. P., Pate, R., Fel<strong>to</strong>n, G., Dowda, M., Weinrich, M., Ward, D., Parsons,M., & Baranowski, T. Development of questionnaires <strong>to</strong> measure psychosocialinfluences on children’s physical activity. Preventive Med 1997; 26, 241-247.Adapted from “General Knowledge,” available at:http://socialmarketing-nutrition.ucdavis.edu/Tools/Downloads/General_Knowledge.pdfHoelscher D, Day RS, Lee ES, Frankowski RF, Kelder SH, Ward JL, Scheurer ME. Measuringthe pr<strong>eval</strong>ence of overweight in Texas school children. American Journal of Public Health2004; 94: 1002-1008.Reynolds K, Yaroch A, et al. Testing mediating variables in a school-basednutrition intervention program. Health Psychol 2002; 21(1): 51-60.Triant Sally Laughter, Ryan Ashley, Mixed Greens: City of WyomingParks and Recreation Summer 2005 Programming Evaluation.Center for Ecoliteracy, Rethinking <strong>School</strong> Lunch Guide, availableat: http://ecoliteracy.org/programs/rsl-guide.htmlAdapted from “Harvest of the Month Survey,” available at:http://www.cdph.ca.gov/programs/CPNS/Documents/<strong>Network</strong>-Compendium.pdfCullen K, Baranowski T, et al. Availability, accessibility, and preferences for fruit, 100% fruitjuice, and vegetables influence children’s dietary behavior. Health Educ Behav 2003; 30(5):615-26.Baranowski T, Davis M, Resnicow K, Baranowski J, Doyle C, Smith M, LinL, Wang DT. Gimme 5 fruit and vegetables for fun and health: OutcomeEvaluation. Health Education & Behavior 2000; 27(1):96-111.56 Bearing Fruit: <strong>Farm</strong> <strong>to</strong> <strong>School</strong> Evaluation Resources and Recommendations
13.14.15.16.17.18.19.20.21.22.23.24.25.26.27.28.29.30.Adapted from “Food Preference Survey,” available in English and Spanish at:http://socialmarketing-nutrition.ucdavis.edu/Tools/Downloads/preferences_only_9_14.pdfCullen K, Baranowski T, et al. Availability, accessibility, and preferences for fruit, 100% fruitjuice, and vegetables influence children’s dietary behavior. Health Educ Behav 2003; 30(5):615-26.Domel, S. B., T. Baranowski, et al. (1993). “Measuring fruit and vegetable preferences among4th- and 5th-grade students.” Prev Med 22(6): 866-79.Baxter, S. D. and W. O. Thompson (2002). “Fourth-grade children’sconsumption of fruit and vegetable items available as part of school lunchesis closely related <strong>to</strong> preferences.” J Nutr Educ Behav 34(3): 166-71.Schmidt M.C., Kolodinsky J, The Burling<strong>to</strong>n <strong>School</strong> Food Project, FinalEvaluation Report, December 2006, Center for Rural Studies.Williamson DA, Allen HR, Martin PD, Alfonso A, Gerald B, HuntA. Digital pho<strong>to</strong>graphy: A new method for estimating food intakein cafeteria settings. Eating Weight Disord. 9: 24-28, 2004.Williamson DA Allen HR, Martin PD, Alfonso AJ, Gerald B, Hunt A. Comparisonof digital pho<strong>to</strong>graphy <strong>to</strong> weighed and visual estimation of portion sizes. Journalof the American Dietetic Association; Sep 2003; 103( 9): 1139-1145.Williamson DZ, Martin PD, Allen R, Most MM, Alfonso AJ, Thomas V,Ryan DH. Changes in food intake and body weight associated with basiccombat training. Military Medicine. 2002. 167(3): 248-253.Feenstra Gail and Ohmart Jeri, UC Sustainable Agriculture Research &Education Program, Yolo County <strong>Farm</strong> <strong>to</strong> <strong>School</strong> Evaluation Report 2005.Feenstra Gail and Ohmart Jeri. Yolo County <strong>Farm</strong> <strong>to</strong> <strong>School</strong>Evaluation Report for the California <strong>Farm</strong> <strong>to</strong> <strong>School</strong> Program, Centerfor Food & Justice, Occidental College. Oc<strong>to</strong>ber 2004.Feenstra Gail and Ohmart Jeri, UC Sustainable Agriculture Research& Education Program, Final Evaluation Report, Comp<strong>to</strong>n <strong>Farm</strong> <strong>to</strong><strong>School</strong> Demonstration Project, July 1, 2004- June 30, 2005.Available at: http://riskfac<strong>to</strong>r.cancer.gov/DHQ/forms/files/shared/dhq1.2007.sample.pdfAvailable at: http://www.dch.org/eventseduc/24%20Hour%20Diet%20Recall.docAdapted from “Food Recognition Form,” available at:http://www.cdph.ca.gov/programs/CPNS/Documents/<strong>Network</strong>-Compendium.pdfCullen K, Bartholomew L. Validity of a 1-day food recognition form <strong>to</strong> measure fruitand vegetable consumption in 9-12 year old girls. Poster Presentation: AmericanDietetic Association Food and Nutrition Conference and Expo. 2003.www.nutritionquest.comAdapted from “Fruit and Vegetable Consumption Youth Risk Behaviour Survey(YRBS),” Centers for Disease Control available at: http://socialmarketing-nutrition.ucdavis.edu/Tools/Downloads/Fruit_and_Vegetable_Consumption_Survey.pdfKindergarten Initiative Evaluation Report, The Food Trust, February 2007,available at: http://s1038.sharedsite.net/files/publications_114.pdfKindergarten Initiative, 2004-05 Evaluation results, The Food Trust.Education for Sustainability. Findings from the Evaluation Study of the Edible <strong>School</strong>yard,April 2003, available at:http://www.ecoliteracy.org/publications/pdf/ESYFindings-DrMurphy.pdfAvailable at: http://www.schoollunchinitiative.org/downloads/BUSD-Wellness-Policy.pdfOklahoma HB 2655 available at:http://www.okhouse.gov/Legislation/BillFiles/hb2655cs_lrp.PDFEndnoteswww.farm<strong>to</strong>school.org 57
Endnotes31.32.33.34.35.36.37.38.39.40.41.42.43.44.45.46.47.48.49.50.51.California Waste Management Board website available at:http://www.ciwmb.ca.gov/<strong>School</strong>s/WasteReduce/Maine State Planning Office website available at:http://www.maine.gov/spo/recycle/education/teacher.phpCornell Waste Management Institute - Trash goes <strong>to</strong> <strong>School</strong>, 1991 available atavailable at: http://cwmi.css.cornell.edu/TrashGoesTo<strong>School</strong>/TrashIntro.htmlAvailable at: http://www.recycleworks.orgCommunity Food Security Coalition available at:http://foodsecurity.org/sample_farmer_survey.pdfVogt RA, Kaiser LL, Perceived Barriers and Proposed Solutions <strong>to</strong> <strong>Farm</strong>-<strong>to</strong>-<strong>School</strong> Programsin California. Journal of Nutrition Education and Behavior, Volume 38, Issue 4, Pages S50-S50.Rimkus Leah, Jones Paula and Ono Fernando, The San Francisco <strong>Farm</strong> <strong>to</strong> <strong>School</strong>Report: Results from the 2003 Feasibility Study, San Francisco Food Systems,2004, available at: http://www.sffoodsystems.org/pdf/f2ssections1-4.pdfHester Parker, Ph.D. Luis Miguel Sierra, Keith Vandevere. Smart Food: An assessment of<strong>Farm</strong>-<strong>to</strong>-<strong>School</strong> opportunities for schools and the school children of Monterey County, 2003.Unlocking the Food Buying of Montana’s Public Institutions. Towards a Montana-based FoodEconomy, Grow Montana, 2006, available at: http://www.growmontana.org/unlocking.php.Berkenkamp JoAnne, Making the <strong>Farm</strong> / <strong>School</strong> Connection: Opportunitiesand Barriers <strong>to</strong> Greater Use of Locally-Grown Produce in Public <strong>School</strong>s,Department of Applied Economics, University of Minnesota, January 2006,available at: http//www.farm<strong>to</strong>school.org/files/publications_120.pdf.Gregoire MB, Strohbehn C, Benefits and Obstacles <strong>to</strong> Purchasing Food from LocalGrowers and Producers, The Journal of Child Nutrition and Management 26(1),available at: http://docs.schoolnutrition.org/newsroom/jcnm/02spring/gregoire.Summary of Mixed Greens Veggie Vote Analyses, Academic Year 2005-06.Joshi A and Azuma AM, Year One Evaluation Report: Fresh from the <strong>Farm</strong> ProgramImplementation at Lozano Bilingual and International Center <strong>School</strong>, Chicago, Oc<strong>to</strong>ber 2006.Joshi A, Kalb M, Beery M, Going Local: Paths <strong>to</strong> success for farm <strong>to</strong> school programs.Case study “Illinois: Fresh from the <strong>Farm</strong> -and in<strong>to</strong> the Classroom”, December 2006,available at: http://departments.oxy.edu/uepi/cfj/publications/goinglocal.pdf.<strong>New</strong> on the Menu, District wide changes <strong>to</strong> school food start in the kitchen atPortland’s Abernethy Elementary. A <strong>report</strong> by Abernethy Elementary, Portland Public<strong>School</strong>s Nutrition Services, Injury Free Coalition for Kids and Ecotrust, Oc<strong>to</strong>ber2006, available at: http://www.ecotrust.org/farm<strong>to</strong>school/Abernethy_<strong>report</strong>.pdf.Croom E, Nasrana R and Kolodinsky J. Growing <strong>Farm</strong>s, Growing Minds: Th e Burling<strong>to</strong>n<strong>School</strong> Food Project, Year One Evaluation 2003-04, Center for Rural Studies.Riverside <strong>Farm</strong> <strong>to</strong> <strong>School</strong> Demonstration Project, Final Grant ReportDecember 1, 2004 <strong>to</strong> November 30, 2006, submitted by Center for Food &Justice, UEPI, Occidental College <strong>to</strong> The California Endowment.Flock Paul et al. A Salad Bar Featuring Organic Choices: Revitalizing the <strong>School</strong> LunchProgram, 2003, available at:http://agr.wa.gov/marketing/smallfarm/saladbarorganicchoices.pdf.Christensen Heidi. Juanamaria Healthy <strong>School</strong>s Project Final EvaluationReport. Ventura County Superintendent’s Office. 2003.Slusser WM, Cumberland WG, Browdy BL, Lange L, Neumann C. A school saladbar increases frequency of fruit and vegetable consumption among children living inlow-income households. Public Health Nutrition. Published online 5 July 2007.Th e Food Trust, <strong>School</strong> Market Program End of the Year Evaluation Report 2003-04.58 Bearing Fruit: <strong>Farm</strong> <strong>to</strong> <strong>School</strong> Evaluation Resources and Recommendations
52.53.54.55.56.57.58.59.60.61.62.63.64.65.66.67.68.69.70.71.72.73.74.75.76.77.78.Haase M et al, Center for Food & Justice, Fresh from the <strong>Farm</strong> and In<strong>to</strong> the Classroom, 2004,available at: http://departments.oxy.edu/uepi/cfj/publications/fresh_from_the_farm.pdf.California Nutrition <strong>Network</strong> for Healthy, Active Families, Annual Reportfor “Riverside Harvest of the Month”, project number 05-46018, 2006.Vermont <strong>Farm</strong> <strong>to</strong> <strong>School</strong> Act No. 145; H. 256; available at:http://www.vtfeed.org/<strong>to</strong>ols-resources/pdfs-<strong>to</strong>ol/<strong>Farm</strong>%20<strong>to</strong>%20<strong>School</strong>%20ACT145.docAlisal Unified <strong>School</strong> District Food PolicyMissoula County Public <strong>School</strong>s ResolutionSanta Monica Malibu Unified <strong>School</strong> District Nutrition and Physical Activity PolicyPhiladelphia <strong>School</strong> Nutrition Policy www.thefoodtrust.org/pdf/snpolicy.pdfSeattle Public <strong>School</strong>s Nutrition Policy www.seattleschools.org/area/board/committee<strong>report</strong>s/nutrition<strong>report</strong>071304.pdfDillon C, Counties and Local Food Systems, Ensuring Healthy Foods, NurturingHealthy Children. National Association of Counties p 11-13, July 2007.<strong>Farm</strong> <strong>to</strong> <strong>School</strong> Procurement Information Package, Community Food SecurityCoalition website available at: http://foodsecurity.org/procurement.htmlCalifornia Senate Bill 281 available at: http://info.sen.ca.gov/pub/07-08/bill/sen/sb_0251-0300/sb_281_bill_20070620_amended_asm_v97.pdf<strong>New</strong> York General Municipal Law Section 103, 2004 availableat: http://public.leginfo.state.ny.us/menugetf.cgiWashing<strong>to</strong>n House Bill 1984, 2001 available at: http://dlr.leg.wa.gov/tld/ViewFileList.aspxColorado House Bill 05-1307available at: http://www.leg.state.co.us/clics2005a/csl.nsf/billcontainers/7D29AAABBE3A21EA87256FA3007CC90B/$FILE/1307_enr.pdfKentucky HB 669 available at: http://www.lrc.ky.gov/Statrev/ACTS2006/0244.pdfWashing<strong>to</strong>n HB 2657 available at: http://tinyurl.com/5gwjcmColorado Senate Bill 06-127 available at: http://www.leg.state.co.us/Clics2006A/csl.nsf/fsbillcont3/A9414CDE0E0000FC872570E4007BEAA9?Open&file=127_enr.pdf<strong>New</strong> York Agriculture and Markets Law Section 16 availableat: http://public.leginfo.state.ny.us/menugetf.cgiConnecticut Public Act 06-135 available at:http://www.cga.ct.gov/2006/ACT/PA/2006PA-00135-R00HB-05847-PA.htmIowa Senate File 601 available at: http://www3.legis.state.ia.us/noba/data/82_SF601_Final.pdf;jsessionid%3DB39E0AAF057E1ED42DECAD4120A85CA9Oregon HB 3476 available at:http://www.leg.state.or.us/07reg/measpdf/hb3400.dir/hb3476.a.pdf<strong>New</strong> Mexico House Joint Memorial 34 available at:http://legis.state.nm.us/Sessions/01%20Regular/memorials/house/HJM034.htmlPennsylvania House Resolution 821; 2004 available at: http://www.legis.state.pa.us/CFDOCS/Legis/PN/Public/btCheck.cfm?txtType=HTM&sessYr=2003&sessInd=0&billBody=H&billTyp=R&billNbr=0821&pn=4252Delaware House Resolution 74; available at: http://www.legis.delaware.gov/LIS/LIS142.NSF/93487d394bc01014882569a4007a4cb7/52da7dff e 98bf63585256e8a006a1ec5?OpenDocumentMassachussetts Economic Stimulus Package 2006 available at:http://www.mass.gov/legis/laws/seslaw06/sl060123.htmMaryland HB 883 available at: http://mlis.state.md.us/2006rs/billfile/hb0883.htmVermont H 145 available at:http://www.leg.state.vt.us/docs/legdoc.cfm?URL=/docs/2006/acts/ACT145.HTMEndnoteswww.farm<strong>to</strong>school.org 59
Endnotes79.80.81.82.83.84.85.86.87.88.89.90.91.92.Pennsylvania Senate Bill 1209, Healthy <strong>Farm</strong>s Healthy <strong>School</strong>s available at:http://www.legis.state.pa.us/CFDOCS/Legis/PN/Public/btCheck.cfm?txtType=HTM&sessYr=2005&sessInd=0&billBody=S&billTyp=B&billNbr=1209&pn=2047Feenstra Gail and Ohmart Jeri, UC Sustainable Agriculture Research & Education Program,Yolo County <strong>Farm</strong> <strong>to</strong> <strong>School</strong> Evaluation Report Year 4 Annual Report Fall/Winter 2005-06.<strong>School</strong> Food Plus Interim Evaluation Phase 3 Report, April 2007.<strong>School</strong> Food Plus Evaluation, Interim Evaluation, Phase 2 Report, Oc<strong>to</strong>ber 2005.Gottlieb R, Mascarenhas M: Evaluation of the Santa Monica <strong>Farm</strong>ers’ Market SaladBar Program. Center for Food & Justice, Occidental College, Los Angeles. 2001.Joshi A, Kalb M, Beery M, Going Local: Paths <strong>to</strong> success for farm <strong>to</strong> school programs.Case study “<strong>New</strong> Hampshire: Get Smart, Eat Local: Step A is Apples”, December 2006.Joshi A, Kalb M, Beery M, Going Local: Paths <strong>to</strong> success for farm<strong>to</strong> school programs. Case study “North Carolina: How the Price ofLettuce Started a <strong>Farm</strong> <strong>to</strong> <strong>School</strong> Program”, December 2006.Joshi A, Kalb M, Beery M, Going Local: Paths <strong>to</strong> success for farm <strong>to</strong> school programs.Case study “Oregon: Getting <strong>Farm</strong> <strong>to</strong> <strong>School</strong> Programs Started”, December 2006.Havstad Cynthia and Wheeler Lynn, Davis Joint Unified <strong>School</strong> District Food Waste DiversionProject Final Report, 2001, available at:http://www.ciwmb.ca.gov/foodwaste/casestudies/contracts/2000/davis.docJoshi A, Kalb M, Beery M, Going Local: Paths <strong>to</strong> success for farm <strong>to</strong> school programs.Case study “Massachussetts: Sowing Seeds in <strong>Farm</strong>s and <strong>School</strong>s”, December 2006.Ohmart Jeri, Direct Marketing <strong>to</strong> <strong>School</strong>s - A <strong>New</strong> Opportunity for Family<strong>Farm</strong>ers, UC Sustainable Agriculture Research and Education Program, July 2002,available at: http://www.sarep.ucdavis.edu/cdpp/directmarketing<strong>to</strong>school.htmJoshi A and Azuma AM, “Seven Generations Ahead - Fresh From the <strong>Farm</strong> StudentSurvey,” Year One Evaluation Report: Fresh from the <strong>Farm</strong> Program Implementationat Lozano Bilingual and International Center <strong>School</strong>, Chicago, Oc<strong>to</strong>ber 2006.“Self-Efficacy Survey: Eating Fruits and Vegetables” available at:http://socialmarketing-nutrition.ucdavis.edu/Tools/Downloads/self_effic_fruitveg.pdfBaranowski T, Davis M, Resnicow K, Baranowski J, Doyle C, Smith M, LinL, Wang DT. Gimme 5 fruit and vegetables for fun and health: OutcomeEvaluation. Health Education & Behavior 2000; 27(1):96-111.“Self-Efficacy Survey: Eating, Asking, Preparing Fruits and Vegetables” available athttp://socialmarketing-nutrition.ucdavis.edu/Tools/Downloads/Self_efficacy_survey_Reynolds.pdfReynolds K, Yaroch A, et al. Testing mediating variables in a school-basednutrition intervention program. Health Psychol 2002; 21(1): 51-60.60 Bearing Fruit: <strong>Farm</strong> <strong>to</strong> <strong>School</strong> Evaluation Resources and Recommendations
V. AppendicesIn this section:Program Profiles*Notes: These profiles are basedon program information and<strong>eval</strong>uation results available throughreferences and online resources.Program profiles are included for farm<strong>to</strong> school programs, not for feasibilitystudies or <strong>report</strong>s or citations usedfor sample <strong>to</strong>ols and policies.<strong>School</strong> district statistics on free/reduced meal eligibility, number ofschools, enrollment and demographicsare only provided <strong>to</strong> understandthe context of the program site, andwere obtained from secondary onlinesources such as http://nces.ed.govSample Tools and Resources
Previous page: A student from the KindergartenInitiative , PA holds up a freshly picked strawberry.Pho<strong>to</strong> by Tegan Hagy.This page: Students from Vance Elementaryin Asheville, NC participate in the AppalachianSustainable Agriculture Project’s Chef Fest.Pho<strong>to</strong> by Molly Nicholie.
Program ProfilesAES-OR: ABERNETHY ELEMENTARY SCHOOLFARM TO SCHOOL PROGRAM, OREGONAbernethy Elementary<strong>School</strong>, ORFree / reduced mealeligibility: 25.7%Enrollment: 357Demographics:84.6% White, 8.4%Asian, 3.4% HispanicLocal product used in:Scratch cooking at oneschool site, salad bars.Other program components:The Garden of Wonders, in-classeducational opportunitiesThe <strong>eval</strong>uation of the first year of the AES-ORproject was conducted by Ecotrust. Th e objectiveof the <strong>eval</strong>uation was <strong>to</strong> coordinate a comprehensivequantitative and qualitative analysis so thatthe project at Abernethy <strong>School</strong> accelerated discussionand decisions at the district level. In addition <strong>to</strong> Ecotruststaff, the research team included the Injury FreeCoalition for Kids at OHSU / Doernbecher Children’sHospital.Th e <strong>eval</strong>ua<strong>to</strong>rs of the Abernethy program recognizedthe challenges of isolating and understanding the effectsof change within a complex system. The multi-componentnature of the program made it difficult <strong>to</strong> pinpointimpacts related specifi c ally <strong>to</strong> one change. Seeking <strong>to</strong>provide feedback on the program that would be mostvaluable <strong>to</strong> the school district, the <strong>eval</strong>uation focused onthe kitchen and cooking “from scratch;” it did not specificallyextend the analysis <strong>to</strong> the garden or classroom.Much of the analysis relied on data already generated by the school district, including participationrates, income and expenses, and nutritional information. Other data was gatheredvia interviews, focus groups and surveys. In some cases, Abernethy data was compared <strong>to</strong>an anonymous control school within the school district that served the standard schoollunch fare.With the findings from the 2005-06 school year forming the baseline, the PortlandPublic <strong>School</strong>s Nutrition Services has changed the program, making adjustmentswhere necessary <strong>to</strong> help institutionalize the program. The cafeteria program plans <strong>to</strong>include product from the garden, initiate a Harvest of the Month program, and exploreopportunities <strong>to</strong> expand the Abernethy model <strong>to</strong> other schools in the district.Local purchasing, while an aspect of the program, was not a part of the 2005-06 analysis butwill be a goal for the coming years.<strong>New</strong> on the Menu, District wide changes <strong>to</strong> school food start in the kitchen at Portland’s Abernethy Elementary.Abernethy Elementary, Portland Public <strong>School</strong>s Nutrition Services, Injury Free Coalition for Kids, and Ecotrust,Oc<strong>to</strong>ber 2006.Conclusions <strong>Farm</strong> <strong>to</strong> <strong>School</strong> and Program RecommendationsProfilesJoshi A, Kalb M, Beery M, Going Local: Paths <strong>to</strong> success for farm <strong>to</strong> school programs. Case study “Oregon: Getting<strong>Farm</strong> <strong>to</strong> <strong>School</strong> Programs Started,” December 2006.www.farm<strong>to</strong>school.org 61
ASA-NC: APPALACHIAN SUSTAINABLE AGRICULTUREPROJECT’S FARM TO SCHOOL PROGRAM, NORTH CAROLINAConclusions <strong>Farm</strong> <strong>to</strong> <strong>School</strong> and RecommendationsProgram ProfilesAppalachian Sustainable Agriculture Project (ASAP)has been leading farm <strong>to</strong> school efforts in westernNorth Carolina – in the Asheville City schools andin the counties of Mitchell, Yancey and Madison. Its “GrowingMinds” program arranges fi e ld trips <strong>to</strong> farms, encouragesparental involvement and education, and facilitates local purchasingby the school system. An extensive <strong>eval</strong>uation of theprogram has not been carried out, though information on theprogram is available from the school districts and ASAP.In 2006, 12,000 children in four school systems - Mitchell,Yancey and Madison counties and Asheville city schools– ate produce from local farms. There was a small, informalnetwork of seven <strong>to</strong> ten farmers providing lettuce, apples, pota<strong>to</strong>es,squash, cucumbers, greens, okra, <strong>to</strong>ma<strong>to</strong>es, decorativepumpkins, turnips, red cabbage, watercress, and zucchini.Most of these farms were less than 10 acres and many were<strong>to</strong>bacco farmers transitioning <strong>to</strong> new crops. A couple of thefarmers were expanding their greenhouses so that they couldgrow vegetables year-round. Th e farmers delivered directly<strong>to</strong> the schools, traveling an average of 30 miles. In Madisonand Mitchell counties, farmers delivered their product <strong>to</strong> onedesignated farmer who then delivered for the group. Localproducts made up 3 – 5% of all produce purchased by theschools.Th e schools in these four counties were equipped with fullkitchens, and food service workers were accus<strong>to</strong>med <strong>to</strong> preparingfresh fruits and vegetables. The only additional facilitiesneeded by a few schools were cold s<strong>to</strong>rage units.One of the biggest benefits of the farm <strong>to</strong> school program inwestern North Carolina was that it provided a connection <strong>to</strong>students’ rural heritage. Many of these children were just onegeneration removed from agriculture, and the exposure <strong>to</strong>farmers and farming helped them <strong>to</strong> understand the his<strong>to</strong>ryof the area as well as how their predecessors lived and worked.<strong>Farm</strong> <strong>to</strong> school found strong supporters among school foodservice staff as well as the school administration, the healthdepartment and staff from a processing facility. ASAP staffhas been enthusiastic about working <strong>to</strong> expand the GrowingMinds program <strong>to</strong> a Head Start group, offering workshopsand field trips <strong>to</strong> different audiences, including farmers andteachers, and focusing on nutrition education by collaboratingwith chefs who are eager <strong>to</strong> offer students the opportunity<strong>to</strong> cook with them.Joshi A, Kalb M, Beery M, Going Local: Paths <strong>to</strong> success for farm <strong>to</strong> schoolprograms. Case study “North Carolina: How the Price of Lettuce Started a<strong>Farm</strong> <strong>to</strong> <strong>School</strong> Program,” December 2006.Mitchell County<strong>School</strong>s, NCFree / reduced mealeligibility: 3.2%Total schools: 8Enrollment: 2200Demographics:94% White, 5% Hispanic,1% African AmericanYancey County<strong>School</strong>s, NCFree / reduced mealeligibility: 51%Total schools: 9Enrollment: 2500Demographics:91% White, 6% Hispanic,2% African AmericanMadison County<strong>School</strong>s, NCFree / reduced mealeligibility: 53.2%Total schools: 6Enrollment: 2600Demographics:97% White, 2% Hispanic,1 % African AmericanAsheville City<strong>School</strong>s, NCFree / reduced mealeligibility: 51.7%Total schools: 10Enrollment: 4400Demographics:49% White, 44% AfricanAmerican, 5% HispanicLocal product used in:Cafeteria mealsOther programcomponents:<strong>Farm</strong> visits by students,school gardens andnutrition education62 Bearing Fruit: <strong>Farm</strong> <strong>to</strong> <strong>School</strong> Evaluation Resources and Recommendations
BLP-OR: BEND LA-PINE FARM TO SCHOOL PROGRAM, OREGONBend La-Pine <strong>School</strong> District, ORFree / reduced meal eligibility: 32.5%Total schools:32 + 3 Head start programsEnrollment: 14,685Demographics:76.3% White, 12.2% Hispanic(based on data available for thestate of Oregon public schools)Local product used in:Once a week product is served inthe cafeteria before lunch, alsoserved with breakfast, and in thesummer feeding program.Other program components:<strong>School</strong> gardens, greenhouse, cookingdemonstrations, and contests with foodLocal farmers made deliveries of fresh, localproduce once a week <strong>to</strong> all the schools inthe district 14 elementary, eight middle,seven high and alternative schools, three privateschools and three Head Start programs in 2005-06. The farmers harvested the product on Tuesdaysand brought it <strong>to</strong> the school nutrition serviceswarehouse on Wednesdays before headingoff <strong>to</strong> sell another portion of the harvest at thefarmers’ market. The food was then divided in<strong>to</strong>equal portions for each of the schools and transported<strong>to</strong> each school where the kitchen staffcleaned, prepared, and served it <strong>to</strong> students. Inthe spring, a variety of products such as strawberries,blueberries, green beans, cucumber,cauliflower, broccoli, melons, watermelons, cantaloupe,cassava, <strong>to</strong>ma<strong>to</strong>es, peppers, celery, andcarrots were available in a school produce box.Fruit from the farmers’ market was also used inthe “breakfast in the classroom” program in seven schools. There wasn’t much wasted fromthe produce, but if there were lef<strong>to</strong>vers, they were used in the after-school snack programthat fed 300 children/day or the supper program that fed 150 children/day. Any lef<strong>to</strong>versfrom the farmers’ market were also served in the cafeteria the next day.Th e school district found that the cost of fresh, local produce was not prohibitive. Theproduce purchase data available from the program was compiled by the food servicesdepartment.An extensive <strong>eval</strong>uation of the program was not carried out. Anecdotal informationwas very supportive of the program, in fact program organizers said that they couldincorporate more local produce if it was available from farmers in the vicinity.Joshi A, Kalb M, Beery M, Going Local: Paths <strong>to</strong> success for farm <strong>to</strong> school programs. Case study “Oregon: Getting<strong>Farm</strong> <strong>to</strong> <strong>School</strong> Programs Started”, December 2006.Conclusions <strong>Farm</strong> <strong>to</strong> <strong>School</strong> and Program RecommendationsProfileswww.farm<strong>to</strong>school.org 63
BTV-VT: BURLINGTON SCHOOL DISTRICT, VERMONTConclusions <strong>Farm</strong> <strong>to</strong> <strong>School</strong> and RecommendationsProgram ProfilesThe Burling<strong>to</strong>n <strong>School</strong> Food Project, acitywide collaborative, has addressed theintegration of local foods in school mealsand food insecurity among school-aged childrenin Burling<strong>to</strong>n, Vermont.Th e goals of the project included:►►►Increased awareness and engagementin the local food system and increasedawareness about and consumption ofhealthy foods in school.Implementation of a citywide food actionplan that increased access <strong>to</strong> anduse of healthy foods and foods from localproducers.Building capacity of Burling<strong>to</strong>n food,health and education-oriented organizations<strong>to</strong> better meet the food needsof the low-income Burling<strong>to</strong>n schooldistrict population.Burling<strong>to</strong>n <strong>School</strong> District, VTFree / reduced meal eligibility: 42%Total schools: 11Enrollment: 3577Demographics:83% White, 2% Hispanic, 7% AfricanAmerican, 6% Asian Pacific IslanderLocal product used in:<strong>School</strong> breakfast and lunch, taste testsOther program components:Food, <strong>Farm</strong> and Nutrition Educationcurriculum, farm <strong>to</strong>urs, recipedevelopment using local products,local food council, <strong>School</strong> Food ActionPlan, <strong>School</strong> Food committees, foodservice workshops, parent trainingsTh e Center for Rural Studies (CRS) served as the <strong>eval</strong>ua<strong>to</strong>r for the three-year project fundedby the USDA Community Food Projects Grants. CRS used both qualitative and quantitative<strong>to</strong>ols <strong>to</strong> gather information about project impacts from stakeholders, including students,teachers, parents, local farmers, food service professionals, community members and partners.Evaluation <strong>to</strong>ols included written surveys, in-depth interviews, focus groups, observationsof events, and analysis of project related data and records. The <strong>eval</strong>uation providedfeedback <strong>to</strong> the project partners including suggestions for improvement of future activities.Evaluation <strong>report</strong>s from this project are available from Vermont FEED.Croom E, Nasrana R and Kolodinsky J. Growing <strong>Farm</strong>s, Growing Minds: Th e Burling<strong>to</strong>n <strong>School</strong> Food Project,Year One Evaluation 2003-04, Center for Rural Studies.Schmidt M.C. and Kolodinsky J, The Burling<strong>to</strong>n <strong>School</strong> Food Project, Final Evaluation Report, December 2006,Center for Rural Studies.64 Bearing Fruit: <strong>Farm</strong> <strong>to</strong> <strong>School</strong> Evaluation Resources and Recommendations
CLP-CA: DAVIS JOINT UNIFIED SCHOOL DISTRICT,CALIFORNIA – THE “CRUNCH LUNCH” PROGRAMDavis Joint Unified<strong>School</strong> District, CAFree / reduced mealeligibility: 15.9%Total schools: 16Enrollment: 8537Demographics:64.7% White, 14.2%Asian, 13.6% HispanicLocal product used in:Salad bars / prepackaged saladsOther program components:In-class nutrition education,school gardens, wastemanagement and recyclingprogram, farm <strong>to</strong>urs,farmer in the classroomof the farm <strong>to</strong>school salad bar program. However, with expansionof sites came increases in labor and equipmentcosts that were prohibitive. To cut down overalllabor costs for the food service operations, a stateof the art central kitchen was established, which hasthe capacity <strong>to</strong> package more salads per day. Th e inaugurationof the central kitchen meant the end ofthe self-service salad bar. The packaged salads alsoused some local produce.DJUSD’s farm <strong>to</strong> school program, one of the fewin the country that has been studied extensively, isthe only one <strong>eval</strong>uated on a longitudinal basis from2000 <strong>to</strong> 2006. Unfortunately, the cafeteria model forserving local product in DJUSD schools changedsubstantially over the six years for which data wasavailable, making it difficult <strong>to</strong> make comparisons,without taking in<strong>to</strong> account all the related fac<strong>to</strong>rs.Th e data gathered, however does provide a strongbase for understanding six years of a farm <strong>to</strong> schoolprogram, its impacts, and the reasons behind thechanges that occurred at the district.Feenstra Gail and Ohmart Jeri, UC Sustainable AgricultureResearch & Education Program, Yolo County <strong>Farm</strong> <strong>to</strong> <strong>School</strong>Evaluation Report 2005.Feenstra Gail and Ohmart Jeri, UC Sustainable AgricultureResearch & Education Program, Yolo County <strong>Farm</strong> <strong>to</strong> <strong>School</strong>Evaluation Report Year 4 Annual Report Fall/Winter 2005-06.Feenstra Gail and Ohmart Jeri. Yolo County <strong>Farm</strong> <strong>to</strong> <strong>School</strong>Evaluation Report for the California <strong>Farm</strong> <strong>to</strong> <strong>School</strong> Program,Center for Food & Justice, Occidental College. Oc<strong>to</strong>ber 2004.Davis Joint Unifi e d <strong>School</strong> District’s farm <strong>to</strong>school program was started in 2000. Throughits years of operation, the program had strongsupport in the community through the Davis <strong>Farm</strong> <strong>to</strong><strong>School</strong> Connection, a project of the Davis EducationalFoundation whose members participated in the planning,implementation and marketing of the project, aswell as supporting the food service as needed. Several ofthe members on this committee were parents who joinedothers in volunteering at the school district <strong>to</strong> supportthe educational activities, gardens and recycling programs.A brief his<strong>to</strong>ry of how the program progressedis outlined below.A key driver for the changes in the salad bar model wasthe attempt <strong>to</strong> attain financial viability. Initially, it wasthought that increasing the number of schools, andtherefore the volume of local product served, would evenout the costs2000-01 One elementary school operatinga salad bar; studentsoffered choice between saladbar and hot entrée everyday2001-02 Th ree elementary schoolsoperating salad bar; studentsoffered choice between saladbar and hot entrée everyday2002-03 Five elementary schools,only salad bar offered as themeal everyday, includingprotein, bread and milk andadhering <strong>to</strong> USDA requirementsfor a fully reimbursablemeal. Growth <strong>to</strong> sevenelementary schools, onlysalad bar offered as the mealeveryday, including protein,bread and milk and adhering<strong>to</strong> USDA requirements for afully reimbursable meal2003-04 All eight elementary schoolsoperational with samemodel as above2004-05 All eight elementary schools,change <strong>to</strong> salad bar offeredon two days a week withchoice of hot entrée2005-06 Pre-packaged salads offereddaily <strong>to</strong> all eight elementaryschools, along with hot entréewww.farm<strong>to</strong>school.org 65Conclusions <strong>Farm</strong> <strong>to</strong> <strong>School</strong> and Program RecommendationsProfiles
COM-CA: COMPTON UNIFIED SCHOOLDISTRICT (CUSD), CALIFORNIAConclusions <strong>Farm</strong> <strong>to</strong> <strong>School</strong> and RecommendationsProgram ProfilesThe COM-CA <strong>eval</strong>uation focused on the efforts <strong>to</strong> increasestudent consumption of fruits and vegetablesthrough farm fresh salad bars. Th e program <strong>eval</strong>uationwas led by the University of California Sustainable AgricultureResearch and Evaluation Program (UC SAREP) withsupport from the Center for Food & Justice at OccidentalCollege.CUSD is a Provision 2 school district where all students areprovided school meals free of charge. Th e reach and impac<strong>to</strong>f a farm <strong>to</strong> school program was thus potentially more significantsince all students ate in the cafeteria. CUSD begantheir farm fresh salad bar program by opening five salad barsin elementary schools in the spring of 2004. In the 2004-05school year, Tracie Thomas, the CUSD Salad Bar Coordina<strong>to</strong>r,opened salad bars in the remaining 19 elementary schools,for a <strong>to</strong>tal of all 24 elementary schools. <strong>School</strong>s offered thesalad bars every day as a USDA fully reimbursable meal andas an alternative <strong>to</strong> the hot lunch. District-wide data wascollected for some aspects of the farm <strong>to</strong> school program. Amore detailed comparison of two salad bar schools, Willard and Caldwell, with two non-saladbar schools, Clin<strong>to</strong>n and McKinley, was conducted <strong>to</strong> gain insights on the impacts of the saladbars on produce purchases, financial viability, meal participation, and consumption patterns.Methodology for data collection:►►►►►Comp<strong>to</strong>n Unified<strong>School</strong> District, CAFree / reduced mealeligibility: 95.2%Total schools: 40Enrollment: 30,233Demographics:72.3% Hispanic, 25.9%African-AmericanLocal product used in:Salad bars as USDAreimbursable mealOther programcomponents: In-classnutrition education, saladbar etiquette trainings, farm<strong>to</strong>urs, farmer in the classroom<strong>School</strong> District Produce Purchases: Monthly data on <strong>to</strong>tal fruit and vegetable purchasesfor the district and for four study schools collected from invoices and year-end budgets.Student Participation: Meal participation rates collected on a monthly basis for salad barand non-salad bar schools.Student Food Choices: (a) Food service daily production records collected <strong>to</strong> analyze thenumber of servings of fruits/vegetables per student in two or three sample months fortwo salad bar/hot lunch schools and one non-salad bar school. (b) Took digital pho<strong>to</strong>s ofschool lunches, comparing hot lunch and salad bars at two salad bar schools.<strong>School</strong> Food Service Fiscal Feasibility: Analysis of school food service budgets for fourstudy schools for the 2004/05 school year <strong>to</strong> determine the costs and feasibility of maintaininga salad bar program.Challenges/Lessons Learned: Interviews with key stakeholders, including the salad barcoordina<strong>to</strong>r, the food service direc<strong>to</strong>r, kitchen personnel, and teachers/principals <strong>to</strong> learnabout their experiences in implementing the program and what solutions were developed.Data from this project was available for one year, which was somewhat useful, but insufficientfor making broader interpretations. Unfortunately, the <strong>Farm</strong> Fresh Salad Bar program at CUSDwas discontinued after a year of implementation, though associated nutrition education activitiesthrough the California <strong>Network</strong> for a Healthy California continue at the school sites.Feenstra Gail and Ohmart Jeri, UC Sustainable Agriculture Research & Education Program, Final Evaluation Report,Comp<strong>to</strong>n <strong>Farm</strong> <strong>to</strong> <strong>School</strong> Demonstration Project, July 1, 2004- June 30, 2005.66 Bearing Fruit: <strong>Farm</strong> <strong>to</strong> <strong>School</strong> Evaluation Resources and Recommendations
CON-NH: CON-VAL SCHOOL DISTRICT FARM TOSCHOOL PROGRAM, NEW HAMPSHIRECon<strong>to</strong>ocook Valley<strong>School</strong> District, NHFree / reduced mealeligibility: 32.5%Total schools: 12Enrollment: 3,186Demographics:White 96.5%, Hispanic0.9%, Asian 0.8%, AfricanAmerican 0.6%, Others 1.2%Local product used in:Salad bars, scratch cooking,Fruit of the Month featuresOther program components:<strong>School</strong> gardens, greenhouse,nutrition education, strongconnections with communityAn extensive <strong>eval</strong>uation of the CON-NH programhas not been conducted, though theprogram has been moni<strong>to</strong>red and data wasavailable from the school district and program coordina<strong>to</strong>rs.Data from farm <strong>to</strong> school programs in <strong>New</strong> Hampshirewas available from the annual <strong>report</strong>s submitted bythe <strong>New</strong> Hampshire <strong>Farm</strong> <strong>to</strong> <strong>School</strong> Program, Officeof Sustainability, at the University of <strong>New</strong> Hampshire<strong>to</strong> SARE (Sustainable Agriculture Research and Education).Th e NH <strong>Farm</strong> <strong>to</strong> <strong>School</strong> Program, a collaboration betweenthe Office of Sustainability, UNH and the NHCoalition for Sustaining Agriculture received initialfunding from Northeast SARE <strong>to</strong> staff the NH <strong>Farm</strong> <strong>to</strong><strong>School</strong> program in 2003. Year 2004-05 data estimatedthat a <strong>to</strong>tal of 44 school districts were participatingin the farm <strong>to</strong> school program. As a result of the program,more than 108,000 students in the state of <strong>New</strong>Hampshire had access <strong>to</strong> fresh NH apples and cider in their cafeterias.As a result of the program, students have started identifying the apple as a NH product,and districts are ordering more apples and cider than they were before, and some are alsobuying other local products such as greens, root vegetables, berries, and honey.Information on the Con-Val school district’s program was gathered from conversationswith Tony Geraci, food service direc<strong>to</strong>r at the district from 2003 – 2006, when the programwas conceived and initiated.A typical meal at the Con Val schools has fi v e choices of fruits and vegetables each at everymeal, with two <strong>to</strong> three choices from a hot bar, salad bar and sandwiches, and plenty of vegetarianoptions, as well as whole grain bread from local artisan bakeries. A hot breakfast isavailable <strong>to</strong> all school children. All the eleven schools in the district have school gardens anda farm <strong>to</strong> school program in place. Th e district has three production kitchens that supplymeals cooked from scratch <strong>to</strong> all the 11 schools. Meals are transported through vans ownedand operated by the district. Th e district serves close <strong>to</strong> 3,000 students daily and has 16% ofthose enrolled for free and reduced meals.Joshi A, Kalb M, Beery M, Going Local: Paths <strong>to</strong> success for farm <strong>to</strong> school programs. Case study “<strong>New</strong> Hampshire:Get Smart, Eat Local: Step A is Apples,” December 2006.Conclusions <strong>Farm</strong> <strong>to</strong> <strong>School</strong> and Program RecommendationsProfilesNortheast SARE grant <strong>report</strong>s 2003-2005 for project LNE03-183 - Towards a community-based school foodsystem, Office of Sustainability, University of <strong>New</strong> Hampshire, http://www.sare.org/projects/.<strong>New</strong> Hampshire <strong>Farm</strong> <strong>to</strong> <strong>School</strong> Program, a project of the University of <strong>New</strong> Hampshire’s University Office ofSustainability Food & Society Initiative, www.nhfarm<strong>to</strong>school.org.www.farm<strong>to</strong>school.org 67
CSA-CA: CSA IN THE CLASSROOM PROGRAM –LOS ANGELES UNIFIED SCHOOL DISTRICT, CALIFORNIAConclusions <strong>Farm</strong> <strong>to</strong> <strong>School</strong> and RecommendationsProgram ProfilesDuring the 2002-03 school year, students inmore than 990 classrooms in 41 different LosAngeles Unified <strong>School</strong> District schools hadthe opportunity <strong>to</strong> taste and learn about farm freshproduce grown in Southern California. These activitieswere part of CSA-CA: an educational programseeking <strong>to</strong> integrate health and nutrition, agricultureand the environment. Project partners included theCenter for Food & Justice (CFJ), Occidental College,Tierra Miguel Foundation CSA <strong>Farm</strong>, and theLos Angeles Unified <strong>School</strong> District <strong>Network</strong> for aHealthy California – previously LAUSD Nutrition<strong>Network</strong> (LAUSD NN).CFJ acted as a liaison between the farm and theLAUSD NN’s nutrition education program. CFJcoordinated product delivery schedules and communicatedwith participating schools and teachers<strong>to</strong> facilitate the purchasing and payment process.Los Angeles Unified<strong>School</strong> District, CAFree / reduced mealeligibility: 77.2%Total schools: 768Enrollment: 722,319Demographics:73.2% Hispanic, 11.4% AfricanAmerican, 8.8% WhiteLocal product used in:In-class nutrition educationand taste testsOther program components:<strong>Farm</strong> trips, <strong>Farm</strong>er in theClassroom, <strong>Farm</strong>ers’ marketstands on school sitesCFJ paid the farm in advance for produce deliveries which were ultimately funded by theNutrition <strong>Network</strong>. CFJ also <strong>eval</strong>uated the program.LAUSD NN developed promotional materials <strong>to</strong> market the project <strong>to</strong> teachers. Th e projectwas promoted along with existing farm <strong>to</strong> school programming coordinated by theLAUSD NN which included farmer visits <strong>to</strong> classrooms and farmers’ market stands set upfor schools. A newsletter for teachers was developed and inserted in the produce box. Thenewsletter included information about the farm, nutritional information about the producein the box, and related nutrition education messages.Th e CSA in the Classroom program established a direct connection between the LAUSDclassrooms and Tierra Miguel, a community supported agriculture farm based in the SanDiego area. Tierra Miguel delivered weekly boxes of organic fruits and vegetables <strong>to</strong> classroomsat the participating low-income LAUSD Nutrition <strong>Network</strong> schools. The producewas used for nutrition education and taste testing.Teacher feedback on the program was encouraging. Over 90% of teachers were “VeryHappy” with the quality, variety and overall aspects of the produce and usefulness for nutritioneducation. A wide variety of <strong>to</strong>pics was <strong>cover</strong>ed in classroom discussion ranging fromagriculture, farming, nutrition and the environment and incorporated in<strong>to</strong> subject areassuch as literature, arts, math and geography. Teachers responded overwhelmingly positivelyregarding the educational value of the program.A major challenge <strong>to</strong> the widespread replication of the project was the need for the participatingfarm <strong>to</strong> be paid in advance of planting, which is the business model of a CSA farm.Th is was not feasible through the existing LAUSD NN purchasing system, and hence CFJoffered <strong>to</strong> front the payments <strong>to</strong> the farm for the pilot project. This posed a problem withthe long-term viability of the program. The CSA-CA program was discontinued after twoyears of CFJ involvement.Margaret Haase et al, Center for Food & Justice, Fresh from the <strong>Farm</strong> and In<strong>to</strong> the Classroom, 2004.68 Bearing Fruit: <strong>Farm</strong> <strong>to</strong> <strong>School</strong> Evaluation Resources and Recommendations
DWM-CA: DAVIS JOINT UNIFIED SCHOOL DISTRICTFOOD WASTE DIVERSION PROJECT, CALIFORNIADavis Joint Unified<strong>School</strong> District, CAFree / reduced mealeligibility: 15.9%Total schools: 16Enrollment: 8537Demographics:64.7% White, 14.2% Asian,13.6% HispanicOther program components:Vermi-composting, composting,food rescue, offer versus serveplan in cafeteria, replacement ofpolystyrene lunch trays with moldedfi b er trays, links with curriculum,operational farm <strong>to</strong> school salad barsThe Davis Joint Unifi e d <strong>School</strong> Districtpiloted food waste composting systemsat three elementary schools (Birch Lane,Cesar Chavez and Pioneer) in the 2000-01 schoolyear. At the cafeterias in all the district schools,including these three, students could choose ahealthy farm <strong>to</strong> school lunch option, includingplenty of fruits and vegetables. Providing studentswith a choice of foods can itself reduce food waste.Th e goal of the project was <strong>to</strong> reduce the lunchwaste stream and in particular reduce food waste,while engaging students in the ongoing practiceof composting and recycling. Th e project was createdby the Davis <strong>Farm</strong> <strong>to</strong> <strong>School</strong> Connection.At the three school sites, three diff e rent methodsof composting food waste and reducing other portionsof lunch waste stream were implemented, inorder <strong>to</strong> better understand which would be mostappropriate for the schools’ needs and resources. Lunch waste audits were conducted at allthree sites at the beginning of the project.Establishing a team of teachers, parents and students at each school was the first step ininitiating this program at schools. Successful implementation was also a result of trainingsconducted for staff, teachers, parents and students throughout the project, integrating thecomposting in<strong>to</strong> the curricula, assessment of results and outreach in the community. Theproject received support from the California Integrated Waste Management Board and wassupported by interested teachers, parents and volunteers.Two of the three school sites showed a reduction in the food waste stream. The data fromthis study was only available for the initial year of the project.Havstad Cynthia and Wheeler Lynn, Davis Joint Unified <strong>School</strong> District Food Waste Diversion Project FinalReport, 2001.Conclusions <strong>Farm</strong> <strong>to</strong> <strong>School</strong> and Program RecommendationsProfileswww.farm<strong>to</strong>school.org 69
ESY-CA: THE EDIBLE SCHOOLYARD AT MARTIN LUTHERKING JR. MIDDLE SCHOOL, BERKELEY, CALIFORNIAConclusions <strong>Farm</strong> <strong>to</strong> <strong>School</strong> and RecommendationsProgram ProfilesThe mission of The Edible <strong>School</strong>yard is <strong>to</strong> createand sustain an organic garden and landscape thatis fully integrated in<strong>to</strong> the school’s curriculum andlunch program. It involves the students in all aspects offarming the garden along with preparing, serving and eatingthe food.An <strong>eval</strong>uation of the first two years of the ESY-CA programwas conducted by the Center for Ecoliteracy andpublished in 2003. The study focused on the experiencesand learning patterns of participating students at MartinLuther King Jr. Middle <strong>School</strong>. Participants spent timein ESY’s garden and kitchen classroom, compared withother students from another Berkeley middle school withno garden or kitchen classroom on its school grounds atthe time of this research. This initial study focused on theholistic pattern of education for sustainability, including:ecological knowledge and understanding; environmentalattitudes and behaviors; cooperative school culture (e.g.improvement in self-esteem, interpersonal relationships,Martin Luther KingJr. Middle <strong>School</strong>Berkeley, CAFree / reduced mealeligibility: 38.4%Total schools: 1Enrollment: 886Demographics:33.6% White, 25.2% African-American, 19% HispanicLocal product used in:Garden produce usedin kitchen classroomOther programcomponents:Organic Garden, KitchenClassroom, ecological andenvironmental educationand attitude <strong>to</strong>ward school); and sense of place. In addition, the study included children’shealth by looking at their attitudes, beliefs, and knowledge regarding fruits and vegetables.Information sources included both qualitative and quantitative data. Data were derived fromsurveys and interviews with students, school leaders, teachers, and parents. The researchteam consisted of several researchers who looked at school records <strong>to</strong> assess grades, testscores, and attendance. One hundred five sixth graders, half from the Martin Luther KingJr. Middle <strong>School</strong> and half from the control school, were surveyed for this study. Pre-andpost-assessments <strong>to</strong>ok place at the beginning and end of the school year, respectively.Sixty-four teachers from the two schools fi lled out surveys about educational climate and26 ESY teachers contributed information about the subjects and students they taught. Theassessment <strong>to</strong>ols looked for students <strong>to</strong>: identify fruits, vegetables, and parts of plants; ordereleven garden-cycle scenes; demonstrate their understanding of ecological concepts; reflectupon their sense of place by ascertaining if the students knew the name of the closest bayas well as where the water for this bay originates; and probe each student’s relationship <strong>to</strong>the environment.Education for Sustainability. Findings from the Evaluation Study of the Edible <strong>School</strong>yard, April 2003.70 Bearing Fruit: <strong>Farm</strong> <strong>to</strong> <strong>School</strong> Evaluation Resources and Recommendations
FFF-IL: FRESH FROM THE FARM PROGRAM AT LOZANOBILINGUAL AND INTERNATIONAL CHARTER SCHOOL (LBICS)–A PROJECT OF SEVEN GENERATIONS AHEAD, ILLINOISLozano Bilingual andInternational Charter<strong>School</strong>, Chicago, ILFree / reduced mealeligibility: 95%Total schools: 1Enrollment: 615Demographics:93% Hispanic, 4% African-American, 3% WhiteLocal product used in:Classroom taste tests aspart of curriculumOther program components:<strong>School</strong> garden, farm <strong>to</strong>urs,parent education, local foodsmarket basket program forparents and teachersSeven Generations Ahead and its project partner,Growing Power, implemented a myriad of activitiesrelated <strong>to</strong> local food and nutrition educationat Lozano Bilingual <strong>School</strong> in Chicago, IL.An <strong>eval</strong>uation of 2005-06 year activities was conducted<strong>to</strong> assess the impacts of the Fresh from the <strong>Farm</strong> (FFF)curriculum implementation at LBICS on healthy eatingand lifestyle changes in students and parents. TheFFF program aimed <strong>to</strong> change student knowledge,attitudes, and behavior related <strong>to</strong> food and nutritionthrough implementation of an eight week curriculum ingrades fi v e and six at LBICS. Students in participatingclassrooms completed pre and post curriculum surveys(N=69). A farm fi e ld trip was conducted and <strong>eval</strong>uatedusing a survey (N=75). Parents (40 pre and 32 post)completed surveys designed <strong>to</strong> assess their perceptionof their children’s eating behaviors and their own knowledgeand attitudes about food and nutrition. Anothergoal of the program was <strong>to</strong> increase parental knowledgeand change attitudes about diet and nutrition through aHealth Eating Night event, and 19 parents <strong>eval</strong>uated this event.A more rigorous assessment of what students were actually eating during the day was notfeasible. The impact of FFF on parental knowledge and attitudes was not as clearly defined.Since this was a one-time intervention, it was not possible <strong>to</strong> follow up. For a more lastingand substantial effect, parents need <strong>to</strong> be engaged through regular interactions and involvementin the curriculum activities.Th e results generally showed a positive effect of the program, but it is not known if theresults were lasting or resulted in sustained behavioral changes. Funding was provided bythe USDA Community Food Projects Competitive Grants.Th e <strong>eval</strong>uation of the program was led by researchers from the Center for Food & Justice,UEPI, Occidental College.Joshi A and Azuma AM, Year One Evaluation Report: Fresh from the <strong>Farm</strong> Program Implementation at LozanoBilingual and International Center <strong>School</strong>, Chicago, Oc<strong>to</strong>ber 2006.Conclusions <strong>Farm</strong> <strong>to</strong> <strong>School</strong> and Program RecommendationsProfilesJoshi A, Kalb M, Beery M, Going Local: Paths <strong>to</strong> success for farm <strong>to</strong> school programs. Case study “Illinois: Freshfrom the <strong>Farm</strong> -and in<strong>to</strong> the Classroom,” December 2006.www.farm<strong>to</strong>school.org 71
FTK-PA: FARM TO KINDERGARTEN INITIATIVE,THE FOOD TRUST, PENNSYLVANIAConclusions <strong>Farm</strong> <strong>to</strong> <strong>School</strong> and RecommendationsProgram ProfilesThe Food Trust’s Kindergarten Initiative reachedout <strong>to</strong> kindergarten students in several Philadelphiapublic schools, with the goals <strong>to</strong> increasechildren’s consumption of nutritious foods, increasetheir awareness of where food comes from, and instillin them an appreciation for farms and farmers. Kindergartenstudents were served healthy snacks sourcedand made from local products thrice a week and offerednutrition education in the classroom; parents were alsooffered nutrition education sessions.After a successful year of pilot programs in four schools,FTK-PA expanded <strong>to</strong> six new schools in 2005-06.<strong>School</strong>s that were eligible <strong>to</strong> participate were rankedin order based on a random number assignment andsystematically approached until six gave their consent.Th ereafter, three schools were randomly assigned <strong>to</strong>receive the intervention while the remaining schoolsserved as controls. In return for participation, the controlschools receive the program the following year.Across the six schools, a <strong>to</strong>tal of 201 kindergartners consented <strong>to</strong> participate. A wide rangeof outcomes were measured by this study including changes in student knowledge abouthealthy diets, local foods and farming, ability <strong>to</strong> read food labels, preference for healthyfoods, body mass index, literacy, parent’s dietary intake, parent involvement and knowledge.Teachers were also asked <strong>to</strong> provide feedback on a teacher training conducted as par<strong>to</strong>f the initiative.Funding support was provided by the Claniel Foundation and the USDA Food Stamp NutritionEducation Program.Th e Food Trust, Kindergarten Initiative Evaluation Report February 2007.Philadelphia Public<strong>School</strong>s, PAFree / reduced mealeligibility: 76%Total schools: 291public, 55 charterEnrollment: 196,309Demographics:14.5% Hispanic, 65.5% AfricanAmerican, 14.2% White, 5.3%Asian, 2% Native AmericanLocal product used in:Snacks served <strong>to</strong>kindergarten studentsOther program components:Nutrition educationcurriculum, parent education,teacher trainingTh e Food Trust, Kindergarten Initiative, 2004-05 Evaluation results.Th e Food Trust, <strong>School</strong> Market Program End of the Year Evaluation Report 2003-04.72 Bearing Fruit: <strong>Farm</strong> <strong>to</strong> <strong>School</strong> Evaluation Resources and Recommendations
FTS-MA: MASSACHUSETTS FARM TO SCHOOLPROGRAM, MASSACHUSETTSMassachusettsPublic <strong>School</strong>s(statewide data)Free / reduced mealeligibility: 27.7%Total schools: 1878public; 57 charterEnrollment: 975,574Demographics:11.8% Hispanic, 8.9% AfricanAmerican, 74.2% White,4.8% Asian / Pacific Islander,0.3% Native AmericanLocal product used in:<strong>School</strong> cafeteriasOther programcomponents:<strong>School</strong> gardensThe Massachusetts Department of AgriculturalResources (MDAR) has been matching up schoolsand farmers as they try <strong>to</strong> make that “locally grownconnection.” Primarily funded by MDAR, the FTS-MAhas assisted more than 30 public school districts and collegesfind ways <strong>to</strong> buy and prepare locally grown foods ona regular basis. Sustainable sales routes for local farmershave been developed. The program stated that it has beeninspiring <strong>to</strong> see school systems as large as Worcester andas small as Maynard beginning <strong>to</strong> serve fresh local foodsin their cafeterias. In their opinion, good communicationat the beginning of the process, including between schoolfood service direc<strong>to</strong>rs and their frontline staff was crucial<strong>to</strong> make this work. Between June 2005 and May 2006,Massachusetts farmers selling <strong>to</strong> Massachusetts schoolsgrossed more than $55,000 in K-12 sales and more than$80,000 in college sales. The majority of these sales weremade by Czajkowski <strong>Farm</strong> and Lanni Orchards and therewere about 45 school districts, private secondary schools,and colleges involved in purchasing from Massachusettsfarms.Future efforts for promoting farm <strong>to</strong> school will involve engaging K-12 food managementcompanies, encouraging them <strong>to</strong> buy direct from farmers. While this is a preferred method,as it can mean more dollars going directly <strong>to</strong> farmers, a team of farm <strong>to</strong> school organizersis also working on developing a preferred vendor list that would be available <strong>to</strong> institutions.Th is would include a seal of approval for vendors who purchase direct from local farms.An extensive <strong>eval</strong>uation of the FTS-MA program was not been conducted, though the programwas been moni<strong>to</strong>red and data made available through a MDAR consultant workingon farm <strong>to</strong> school programming.Joshi A, Kalb M, Beery M, Going Local: Paths <strong>to</strong> success for farm <strong>to</strong> school programs. Case study “Massachusetts:Sowing Seeds in <strong>Farm</strong>s and <strong>School</strong>s,” December 2006.Conclusions <strong>Farm</strong> <strong>to</strong> <strong>School</strong> and Program RecommendationsProfileswww.farm<strong>to</strong>school.org 73
LSB-CA: LOS ANGELES UNIFIED SCHOOL DISTRICT(LAUSD), CALIFORNIA – PILOT SALAD BAR PROGRAMConclusions <strong>Farm</strong> <strong>to</strong> <strong>School</strong> and RecommendationsProgram ProfilesIn the fall of 1999, a pilot salad bar program and nutritioneducation were implemented by LAUSD Department ofFood Services and the Center for Food & Justice (thencalled the Community Food Security Project). Collabora<strong>to</strong>rsfrom the UCLA <strong>School</strong> of Public Health conductedan <strong>eval</strong>uation <strong>to</strong> measure possible changes in fruit andvegetable consumption of elementary school children attendingthree schools in the LAUSD after the introductionof the salad bar program. Nutrition education componentsincluded salad bar etiquette training, simple messages abouthealth benefits of fruits and vegetables, and trips <strong>to</strong> farmsand farmers’ markets. Th is was a pre-post study, i.e. baselinedata was collected using the same <strong>to</strong>ols and methodologybefore the implementation of the salad bar program.<strong>School</strong>s participating in the program <strong>eval</strong>uation were: 59thStreet, Castelar, and 42nd Street Elementary <strong>School</strong>s. Thestudent <strong>eval</strong>uation components included:1. Ninety-six and 241 children who lived in low-incomeneighborhoods were interviewed for 24-hour dietary recallin the years 1998 and 2000, respectively. To be included inthe study, the children needed <strong>to</strong> attend one of the three pilot salad bar schools, be in thesecond <strong>to</strong> fifth grades at the onset of the study, and return informed consent forms signedby parents or guardians. Participation in the study was voluntary. Food intake was analyzedusing the Food Intake Analysis System (FIAS) developed by the Human Nutrition ResearchCenter at the University of Texas <strong>School</strong> of Public Health Version 3.98.2. Lunch room observations were conducted in year 2000.Los Angeles Unified<strong>School</strong> Disitrct, CAFree / reduced mealeligibility: 77.2%Total schools: 768Enrollment: 722,319Demographics: 73.2%Hispanic, 11.4% AfricanAmerican, 8.8% WhiteLocal product usedin: Salad bars as a USDAreimbursable meal optionOther programcomponents:Salad bar etiquette training,nutrition and healtheducation, trips <strong>to</strong> farmsand farmers’ markets3. Focus group discussions were conducted in the three schools at the beginning, middleand end of the study period <strong>to</strong> assess the nutritional information delivered and the children’sattitudes <strong>to</strong>wards the salad bar. A <strong>to</strong>tal of 13 focus group discussions were held.Th is study used a 24 hour dietary recall method <strong>to</strong> assess fruit and vegetable consumptionin students. Regardless of the age of the child, the average frequency of fruits and vegetablesconsumed increased after the introduction of the salad bar. Th e increase in frequency offruits and vegetables consumed as <strong>report</strong>ed in this study and the associated reductions inintake of fats is consistent with previous studies conducted.Slusser WM, Cumberland WG, Browdy BL, Lange L, Neumann C. A school salad bar increases frequency of fruitand vegetable consumption among children living in low-income households. Public Health Nutrition. Publishedonline 5 July 2007.74 Bearing Fruit: <strong>Farm</strong> <strong>to</strong> <strong>School</strong> Evaluation Resources and Recommendations
MIG-MI: MIXED GREENS PROGRAM, MICHIGANGrand RapidsPublic <strong>School</strong>s, MIFree / reduced mealeligibility: 78%Total schools: 42(23 receive LOOP program)Enrollment: 2,324Demographics (GrandRapids City):67.3% White, 20.4%African American, 13.1%Hispanic, 1.6% AsianLocal product used in:Local food tastingsOther programcomponents:<strong>School</strong> gardensThe purpose of the Mixed Greens Program was <strong>to</strong> improvethe health and academics of children by re-establishingtheir relationship <strong>to</strong> whole foods throughthe use of vegetable gardens and kitchen classrooms.Mixed Greens offered after-school programming andsummer enrichment programming at three WyomingPublic <strong>School</strong>s, three Grand Rapids Public schools, andone community center (Grandville Avenue Academy forthe Arts), as well as school day programming at one GrandRapids Public <strong>School</strong> through the Snack Facts and BrainBreaks programs, offered in conjunction with the USDAFruit and Vegetable grant the school received. More siteswere expected <strong>to</strong> be added in the future.Th e Grand Rapids after school program called LOOP wasrun by three community partners: Camp Fire USA, City ofGrand Rapids Department of Parks and Recreation, and theYMCA. The Wyoming Public <strong>School</strong>s after school programcalled TEAM 21 was run by the City of Wyoming Parks andRecreation Department and funded through a 21st CenturyCommunity Learning Centers grant.Th e programs included a once a week garden program at the school based on themes suchas trying out new foods, learning about foods grown in Michigan, seasonal plants, harvesting,garden maintenance, and nutrition. Other activities presented in the garden setting includedmath, spelling, geography, literacy, yoga, teamwork, and the environment. Studentswere also taken on farm field trips.Evaluations of the summer programs of 2005 and 2006 were available that included informationcollected through “Veggie Votes” (developed by Mixed Greens in collaborationwith Spectrum Health and the C.S. Mott Group for Sustainable Agriculture, Michigan StateUniversity). Veggie Votes was a <strong>to</strong>ol developed <strong>to</strong> assess students’ preferences and changesin attitudes <strong>to</strong>wards specific vegetables as a result of taste tests conducted.Summary of Mixed Greens Veggie Vote Analyses, Academic Year 2005-2006.Conclusions <strong>Farm</strong> <strong>to</strong> <strong>School</strong> and Program RecommendationsProfilesTriant Sally Laughter, Ryan Ashley, Mixed Greens: City of Wyoming Parks and Recreation Summer 2005 ProgrammingEvaluation.www.farm<strong>to</strong>school.org 75
MLS-MT: MISSOULA COUNTY FARM TO SCHOOL, MONTANAConclusions <strong>Farm</strong> <strong>to</strong> <strong>School</strong> and RecommendationsProgram ProfilesMontana’s fi r st pilot farm <strong>to</strong> school programwas implemented in August 2005 in the MissoulaCounty Public <strong>School</strong> District (MCPS).Two “Montana Made Meal Events” in 2005-06, throughwhich 3,000 students received a meal made from locallygrown ingredients, helped set the stage for a morecomprehensive program at the district. In the 2006-07school year, several Montana grown products such oats,whole wheat fl o ur, peaches, apples, cantaloupes, carrots,cucumbers, pota<strong>to</strong>es, zucchini, cheese, pasta, honey andsalad greens were introduced in the school cafeterias.Educational aspects of the program include classroomlessons about where food comes from, how it is processedand prepared, farm trips, taste tests of Montanagrown products and cooking demonstrations.Th e Missoula <strong>Farm</strong> <strong>to</strong> <strong>School</strong> Program has broad suppor<strong>to</strong>f the community and school board. The CommunityFood Security Coalition (which <strong>Farm</strong> <strong>to</strong> <strong>School</strong> is aproject of ) has focussed efforts on addressing challengesassociated with local food procurement at institutionalMissoula County Public<strong>School</strong> District, MTFree / reduced mealeligibility: 35.5%Total schools: 16Enrollment: 13,375Demographics:1.5% Hispanic, 1.0% AfricanAmerican, 91.5% White, 4.1%American Indian/ AlaskanNative, 1.8% Asian, 0.1% NativeHawaiian/ Pacific IslanderLocal product used in:Cafeteria meals, taste testsOther program components:Classroom-basededucation, farm <strong>to</strong>urslevel, such as need for value-added products, distribution and delivery systems at state andregional levels. Th e coalition has organized many community meetings <strong>to</strong> bring <strong>to</strong>getherfood service staff, producers and distribu<strong>to</strong>rs <strong>to</strong> discuss these issues.Th o ugh an extensive <strong>eval</strong>uation of the program has not been conducted so far, data is availablethrough information available from <strong>report</strong>s cited below.Dillon C, Counties and Local Food Systems, Ensuring Healthy Foods, Nurturing Healthy Children. NationalAssociation of Counties p 11-13, July 2007.Missoula County Public <strong>School</strong>s Resolution www.farm<strong>to</strong>school.org/mt/montanaFTSResolution.pdfUnlocking the Food Buying of Montana’s Public Institutions. Towards a Montana-based Food Economy, GrowMontana, 2006.76 Bearing Fruit: <strong>Farm</strong> <strong>to</strong> <strong>School</strong> Evaluation Resources and Recommendations
OSB-WA: ORGANIC CHOICES SALAD BAR ATOLYMPIA SCHOOL DISTRICT, WASHINGTONOlympia <strong>School</strong> District, WAFree / reduced meal eligibility: 20.4%Total schools: 18Enrollment: 9,231Demographics:78.9 % White, 9% Asian, 5% HispanicLocal product used in:Organic Choices Salad Bar offered dailyOther program components:Nutrition and environmentaleducation, strong parent involvement,taste tests, promotional activitiesfor Organic Choices Salad Bars,organic garden, greenhouse,students involved in harvesting andselling garden product, childrenactivity kitchen, Harvest Festivals,composting and recycling programThe Olympia <strong>School</strong> District in Washing<strong>to</strong>nstate piloted an Organic ChoicesSalad Bar in Oc<strong>to</strong>ber 2002 at Lincoln Elementary.The pilot program was started whena concerned parent from Lincoln Elementaryapproached the Child Nutrition Supervisor atthe district about the quality of school lunches.As a result of several meetings between parents,teachers, community members, the schoolprincipal and the Child Nutrition Supervisor,a new meal program was designed for LincolnElementary.Many other schools expressed interest in thepilot program at Lincoln, and by 2003, fourothers had added organic choices <strong>to</strong> their cafeterias- Pioneer Elementary, Bos<strong>to</strong>n Harbor Elementary,Griffin <strong>School</strong> District, and GarfieldElementary. The “Organic Choices Salad Bar”resembled a restaurant style salad bar featuringorganic fruit and vegetable choices, whole grainbread, vegetarian meat alternatives, eggs, andorganic soy milk. The salad bar could be chosen as a complete meal or in combination withhot lunch options.Th e OSB-WA program was supported by the district’s Child Nutrition Supervisor and receivedstrong support from the parent community.Data from this program was available from <strong>report</strong>s written on the project for school year2003 – 04.Flock Paul et al. A Salad Bar Featuring Organic Choices: Revitalizing the <strong>School</strong> Lunch Program, 2003.Conclusions <strong>Farm</strong> <strong>to</strong> <strong>School</strong> and Program RecommendationsProfileswww.farm<strong>to</strong>school.org 77
RHM-CA: RIVERSIDE HARVEST OF THEMONTH PROGRAM, CALIFORNIAConclusions <strong>Farm</strong> <strong>to</strong> <strong>School</strong> and RecommendationsProgram ProfilesThe RHM-CA program was initiated at JeffersonElementary <strong>School</strong> in Oc<strong>to</strong>ber 2005, <strong>to</strong> supportthe existing <strong>Farm</strong> Fresh Salad Bar offering in thecafeteria. The project was implemented and <strong>eval</strong>uated bythe Center for Food & Justice, Occidental College.Supported by the California <strong>Network</strong> for a Healthy California,project activities included monthly taste tests oflocal produce items; development and promotion of nutritioneducation materials; farmers market <strong>to</strong>urs for students,teachers and parents; farmer visits <strong>to</strong> classrooms;gardening and parent education activities. A <strong>to</strong>tal of 629students, teachers and parents were reached during thisproject.Two farmers who supplied <strong>to</strong> the salad bar program in thecafeteria also participated in the farmer in the classroomactivities. The project was most successful in creating ayear-round program that provided innovative and recurringnutrition education opportunities for third gradestudents.Riverside Unified<strong>School</strong> District, CAFree / reduced mealeligibility: 47.5%Total schools: 47Enrollment: 43,052Demographics:50.6 % Hispanic, 34.5% WhiteLocal product used in:Taste tests, in-classnutrition educationOther programcomponents: <strong>Farm</strong> FreshSalad bars, <strong>to</strong>urs <strong>to</strong> farmsand farmers markets, farmerin the classroom, schoolgarden, parent educationPre and post tests were used <strong>to</strong> <strong>eval</strong>uate the effectiveness of the project for teachers involvedin activities. Evaluation activities for students were planned, though only those involvingteachers were conducted, due <strong>to</strong> changes in the district’s calendar and delays in receivingHuman Subjects Research approvals from the Institutional Review Board.Limited data was available from this project <strong>eval</strong>uation. The project may continue at thisschool, Jefferson Elementary, in the coming years, with potential for collecting more detailedinformation on the impacts of the nutrition education on student knowledge, attitudes andbehaviors about nutrition and healthy foods.California Nutrition <strong>Network</strong> for Healthy, Active Families, Annual Report for “Riverside Harvest of the Month,”project number 05-46018, 2006.78 Bearing Fruit: <strong>Farm</strong> <strong>to</strong> <strong>School</strong> Evaluation Resources and Recommendations
RSD-CA: RIVERSIDE UNIFIED SCHOOLDISTRICT (RUSD), CALIFORNIARiverside Unified<strong>School</strong> District, CAFree / reduced mealeligibility: 47.5%Total schools: 47Enrollment: 43,052Demographics:50.6 % Hispanic, 34.5% WhiteLocal product used in:Salad bars as USDAreimbursable mealOther programcomponents: In-classnutrition education, saladbar etiquette trainings, farm<strong>to</strong>urs, farmer in the classroom,Harvest of the Month program►►The RSD-CA program was started off at JeffersonElementary <strong>School</strong> in March 2005. The<strong>eval</strong>uation of the RSD-CA program focused onthe implementation of the program at one school only(Jeff e rson), though the program has since expanded andas of January 2007 was operational in five schools. The<strong>eval</strong>uation was conducted by the Center for Food & Justice,Occidental College. Indica<strong>to</strong>rs studied were:►►►<strong>School</strong> District Produce Purchases: Monthlydata on <strong>to</strong>tal fruit and vegetable purchases forthe district and for the two local farmers was collectedfrom invoices and year-end budgets.Student Meal Participation: Collected on amonthly basis for salad bar and hot meal optionsat Jefferson Elementary.Student Food Choices: (a) Food service dailyproduction records were collected at Jeff e rsonElementary <strong>to</strong> analyze the number of servingsof fruits and vegetables per student for salad barand hot lunch.Challenges/Lessons Learned: Interviews with key stakeholders, including the saladbar coordina<strong>to</strong>r, the food service direc<strong>to</strong>r, kitchen personnel, school principal andfarmers were conducted.Financial Viability: Some data necessary <strong>to</strong> calculate the cost of the salad bar mealversus the hot meal and the financial viability of the program was collected. However,CFJ realized that there was inadequate data <strong>to</strong> make any inferences on thisindica<strong>to</strong>r.Th e Jeff e rson <strong>Farm</strong> <strong>to</strong> <strong>School</strong> pilot program was supported by a two year grant from TheCalifornia Endowment, which also supported the <strong>eval</strong>uation activities. Th u s, data from thisproject was only available over a two year period and only for one school site. An in-depth<strong>eval</strong>uation of the fiscal viability of the program at the school district level as well as gatheringimpact <strong>eval</strong>uation data from all the school sites may be useful.Unlike some other programs which <strong>report</strong> difficulties in obtaining food service records,data collection for this <strong>eval</strong>uation was made easier due <strong>to</strong> a supportive food service direc<strong>to</strong>rand staff at RUSD.Riverside <strong>Farm</strong> <strong>to</strong> <strong>School</strong> Demonstration Project, Final Grant Report December 1, 2004 <strong>to</strong> November 30, 2006,submitted by Center for Food & Justice, UEPI, Occidental College <strong>to</strong> the California Endowment.Conclusions <strong>Farm</strong> <strong>to</strong> <strong>School</strong> and Program RecommendationsProfileswww.farm<strong>to</strong>school.org 79
SFP-NY: SCHOOL FOOD PLUS PROGRAM,NEW YORK CITY SCHOOLS, NEW YORKConclusions <strong>Farm</strong> <strong>to</strong> <strong>School</strong> and RecommendationsProgram Profiles<strong>School</strong>FoodPlus was a project of Food-Change. Market Ventures, Inc. in partnershipwith Karp Resources and the Centerfor Health & Public Service Research at <strong>New</strong>York University were retained <strong>to</strong> <strong>eval</strong>uate the<strong>School</strong>FoodPlus Initiative.Th e logic model for the <strong>School</strong>FoodPlus <strong>eval</strong>uationreflected the three pronged approach <strong>to</strong>wardachieving the goals of improving children’s healthand academic performance while invigoratingthe state’s agricultural economy. These includedinstitutional change within the <strong>New</strong> York CityOffice of <strong>School</strong>Food (OSF), school-based programming,and coalition building.Most of the school-based programming for<strong>School</strong>FoodPlus <strong>to</strong>ok place at the elementaryschool level in three targeted neighborhoodsaround <strong>New</strong> York City. These were low incomeneighborhoods identified as catchment areas forintense focus – East and Central Harlem, the South Bronx and Central Brooklyn. Key questionsthe <strong>eval</strong>uation was designed <strong>to</strong> answer were:1. How have <strong>School</strong>Food Plus recipes been utilized by OSF and participating schools?2. Has students’ consumption of <strong>School</strong>Food Plus recipes increased in participating schoolsand why?3. Has <strong>School</strong>Food Plus led <strong>to</strong> increases in the number of students eating school meals?4. How have students, teachers, administration, parents, and coalition partners responded<strong>to</strong> <strong>School</strong>Food Plus?5. Does participation in CookShopB Cafeteria or CookShopB Classroom lead <strong>to</strong> change inknowledge, attitude, and behavior about food, farming, cooking, and consumption compared<strong>to</strong> non-participants?6. Have the three different combinations of <strong>School</strong>Food Plus programming (cafeteria only,classroom only, or saturation intensive model) led <strong>to</strong> different outcomes in terms of studentknowledge, attitudes, behavior, and program satisfaction?7. How has procurement of locally grown fruits and vegetables changed as a result of<strong>School</strong>Food Plus and who are the participating farmers?8. How has participating in <strong>School</strong>Food Plus affected local farmers, individually and in aggregate?9. What value have the various coalitions added <strong>to</strong> the <strong>School</strong>Food Plus program?<strong>School</strong> Food Plus Evaluation, Interim Evaluation, Phase 2 Report, Oc<strong>to</strong>ber 2005.<strong>New</strong> York City <strong>School</strong>s(citywide data for 2005-06)Free / reduced mealeligibility: 73.7%Total schools: 1,456Enrollment: 10,71,630Demographics (2004-05 data):14.3 % White, 33.1 % African American,39% Hispanic, 13.5% Asian and othersLocal product used in:<strong>School</strong> mealsOther program components:Recipe development/ testing, reviewof nutrition standards, CookShop /other curricula, Cafeteria as a Classroomprogram, SPARK physical educationprogram, coalition building nutritioninterventions for parents/ community<strong>School</strong> Food Plus Interim Evaluation Phase 3 Report, April 2007.80 Bearing Fruit: <strong>Farm</strong> <strong>to</strong> <strong>School</strong> Evaluation Resources and Recommendations
SMM-CA: SANTA MONICA-MALIBU UNIFIEDSCHOOL DISTRICT (SMMUSD), CALIFORNIASanta Monica-Malibu Unified<strong>School</strong> District, CAFree / reduced mealeligibility: 24.7%Total schools: 17Enrollment: 12,191Demographics:57.1% White, 26.9%HispanicLocal product used in:Daily salad bars as USDAreimbursable mealOther programcomponents:In-class nutrition education,farm <strong>to</strong>urs, farmer in theclassroom, school gardensThe SMMUSD <strong>Farm</strong>ers’ Market Salad Bar was thefi r st of its kind in the Los Angeles area and in the nation.The program began in 1997 at one elementaryschool and within four years had expanded <strong>to</strong> include all 14elementary, middle and high schools in the district. Th e saladbar was prepared fresh daily from ingredients purchased atthe local farmers’ market by a salad bar coordina<strong>to</strong>r at eachsite. Every day students were given a choice of a hot meal orthe salad bar for their lunch.Major funding for this program came from a <strong>Network</strong> fora Healthy California (previously California Nutrition <strong>Network</strong>)grant and donations from the Parent Teacher Association.After ten years in operation, the <strong>Farm</strong>ers’ MarketSalad Bar became institutionalized as a lunch option andwas independent of any outside funding with the exceptionof an annual grant of $10,000 from the City of SantaMonica.An <strong>eval</strong>uation of the first three years of operation of thisprogram was undertaken by the Center for Food & Justice,Occidental College (previously the Community Food Security Project). Major componentsof the <strong>eval</strong>uation were:►►►<strong>School</strong> District Produce Purchases: Data on the district’s purchases from localfarmers was tracked over the 1999-2000 school year including <strong>to</strong>tal direct fruitand vegetable purchases for the district and for four study schools collected frominvoices and year-end budgets.Student Participation: Average daily participation collected for all salad bar schoolsbefore and after the introduction of the salad bar, as well as comparison data fornumber of students choosing salad bar versus hot meal.<strong>School</strong> Food Service Fiscal Feasibility: Analysis of school food service budgets forthe 1998-99 school year was conducted <strong>to</strong> determine the costs and feasibility ofmaintaining a salad bar program.After ten years in operation, the project still receives strong support from parents, teachersand administra<strong>to</strong>rs in the district, as well as from the City of Santa Monica through its<strong>Farm</strong>ers’ Market program.Data from this project was ground breaking since this was one of the pioneering farm <strong>to</strong>school programs. However, it does not provide trend data over the three years studied, noris it able <strong>to</strong> establish pre-post comparisons regarding the impacts of the program.Gottlieb R, Mascarenhas M: Evaluation of the Santa Monica <strong>Farm</strong>ers’ Market Salad Bar Program. Center forFood & Justice, Occidental College, Los Angeles, 2001.Conclusions <strong>Farm</strong> <strong>to</strong> <strong>School</strong> and Program RecommendationsProfileswww.farm<strong>to</strong>school.org 81
VEN-CA: VENTURA UNIFIED SCHOOL DISTRICT FARM TOSCHOOL “HEALTHY SCHOOLS PROJECT,” CALIFORNIAConclusions <strong>Farm</strong> <strong>to</strong> <strong>School</strong> and RecommendationsProgram ProfilesThe Healthy <strong>School</strong>s Project at Ventura Unifie d <strong>School</strong> District was designed <strong>to</strong> promotehealthy nutritional behaviors and <strong>to</strong> teach studentshow <strong>to</strong> make healthy choices now and throughouttheir lives. Th e program consisted of sequentialnutrition education, garden-enhanced nutritioneducation, and a school salad bar lunch program. Th e<strong>eval</strong>uation of the Ventura program was led by HeidiChristensen in the 2001-02 school year and focusedon Juanamaria Elementary <strong>School</strong>, the first <strong>to</strong> implementthe farm <strong>to</strong> school program in the district. Keyobjectives of the <strong>eval</strong>uation plan were <strong>to</strong>:1. Moni<strong>to</strong>r implementation of program components(sequential nutrition education, garden-enhancednutrition education, farm-fresh school salad barlunch program).2. Determine the effectiveness of program components on children’s, parents’, and schoolstaff’s knowledge, attitudes, and behavior, particularly in terms of the following:►►►►Salad bar usage by students and staffChanges in dietary habits of participating childrenChanges in nutritional knowledge of participating childrenVentura Unified<strong>School</strong> District, CAFree / reduced mealeligibility: 37.4%Total schools: 29Enrollment: 17,545Demographics:49% White, 38.6% Hispanic, 2.5%Asian, 1.1% American IndianLocal product used in:Salad barsOther program components:In-class nutrition education,school gardens, farm <strong>to</strong>urs,farmer in the classroomChanges in student awareness of issues regarding the production, consumption,and disposal of food waste.3. Examine the practical and financial viability of the salad bar program, especially as related<strong>to</strong> sustainability and generalizability <strong>to</strong> other schools. Information on financial issuesof the farm-fresh salad bar component was collected.Because components of the project had been implemented prior <strong>to</strong> the <strong>eval</strong>uation, it wasnot possible <strong>to</strong> administer pre-test surveys <strong>to</strong> the Juanamaria students. In order <strong>to</strong> providecomparative data, students at two elementary schools with planned but not yet completedimplementation of the Healthy <strong>School</strong>s components were also surveyed. Th ese studentsserved as a control group for the Juanamaria students. It is important <strong>to</strong> note that there weredemographic differences between the control group students and the Juanamaria students.Qualitative data was collected through a series of interviews and focus groups by the <strong>eval</strong>ua<strong>to</strong>r.Interviews were conducted with the Juanamaria principal, Juanamaria teachers, andfood service staff (district and school-level). Focus groups were held with twenty randomlyselected fourth and fifth grade students. Only upper grade students were chosen for thefocus groups because of their increased capacity for reflection, insight, and verbal expression.Unfortunately, access <strong>to</strong> randomly selected parents for interview or survey purposescould not be attained but is expected <strong>to</strong> be accomplished in the future. Also missing is themeasurement of students’ awareness of waste issues related <strong>to</strong> food.Christensen, Heidi. Juanamaria Healthy <strong>School</strong>s Project Final Evaluation Report. Ventura County Superintendent’sOffice. 2003.82 Bearing Fruit: <strong>Farm</strong> <strong>to</strong> <strong>School</strong> Evaluation Resources and Recommendations
WSD-CA: WINTERS JOINT UNIFIEDSCHOOL DISTRICT, CALIFORNIAWinters Joint Unified<strong>School</strong> District, CAFree / reduced mealeligibility: 48%Total schools: 16Enrollment: 1,940Demographics:63.6 % Hispanic, 43.2% WhiteLocal product used in:Once a week salad bars offeredas USDA reimbursable mealsOther program components:In-class nutrition education,school gardens, farm <strong>to</strong>ursWinters’ <strong>Farm</strong> <strong>to</strong> <strong>School</strong> program was initiatedin 2002 as a pilot demonstration sitesupported through a grant from the W.K.Kellogg Foundation received by the Center for Food& Justice, Occidental College. The program <strong>eval</strong>uationwas conducted by the University of California SustainableAgriculture Research and Education Program(SAREP) from 2002-04. In the first year of the project,one school implemented the farm fresh salad bar(Rominger Elementary). In the second year, WaggonerElementary also started implementation. Evaluationcomponents included:<strong>School</strong> District Produce Purchases: Monthly data on<strong>to</strong>tal fruit and vegetable purchases for the district andfor the two schools was collected from invoices andyear-end budgets.<strong>School</strong> Meal Participation Rates: Average daily participation collected from both schools,2002-04 <strong>to</strong> compare participation on salad bar and non-salad bar days, as well as salad barand hot meal option.Student Food Choices: Collected food service daily production records <strong>to</strong> analyze the numberof servings of fruits/vegetables per student in the two schools – salad bar and hot mealoption.<strong>School</strong> Food Service Fiscal Feasibility: Analysis of school food service budgets for twoschools for the 2002-04 school years <strong>to</strong> determine the costs and feasibility of maintaining asalad bar program.Challenges/Lessons Learned:Interviews with key stakeholders, including the salad bar coordina<strong>to</strong>r, the food service direc<strong>to</strong>r,kitchen personnel, farmers, teachers, and principals were conducted.Th e two year trend data available from WSD-CA was valuable in understanding how theprogram operated in those years. In 2006, Winters Joint Unifi e d <strong>School</strong> District hired anew food service direc<strong>to</strong>r, who continued with the once a week salad bar program, but wasnot buying the salad bar foods from the local farmers. Th e reasons for discontinuing relate<strong>to</strong> the cost of the food and associated labor. Due <strong>to</strong> previous connections made with localfarms, some farmers sometimes offered excess crops <strong>to</strong> the school district <strong>to</strong> be served <strong>to</strong>students.Feenstra Gail and Ohmart Jeri, UC Sustainable Agriculture Research & Education Program. Yolo County <strong>Farm</strong><strong>to</strong> <strong>School</strong> Evaluation Report. 2005Conclusions <strong>Farm</strong> <strong>to</strong> <strong>School</strong> and Program RecommendationsProfilesFeenstra Gail and Ohmart Jeri. Yolo County <strong>Farm</strong> <strong>to</strong> <strong>School</strong> Evaluation Report for the California <strong>Farm</strong> <strong>to</strong> <strong>School</strong>Program, Center for Food & Justice, Occidental College. Oc<strong>to</strong>ber 2004.www.farm<strong>to</strong>school.org 83
Notes
Sample Tools and ResourcesNY Survey of K-12 Food Service Direc<strong>to</strong>rs (Page 1 of 11)About Your Food Service Operation:For questions 1 <strong>to</strong> 14, base your response on the current (2003-2004) school year.1. How many students are enrolled in your school district? ______2. How many K-12 schools are in your school district? ______3. In which county is your school district located? ______4. How is your school food service operation managed?__ Self-managed__ Contracted-managedName of management company: ___________5. What is your annual food service budget?Food: $______Labor (not including benefits): $______Total Operating Costs: $______6. During the school year (September through June), approximately how many reimbursablemeals are served each day?Number of breakfasts: ______Number of lunches: ______Number of dinners: ______6a. How many after school snacks are served each day? ______7. What percent of students are eligible for free/reduced meals? ______%8. What is the price charged for a full-price lunch in your:Elementary school(s): $______Middle school(s): $______High school(s): $______<strong>Farm</strong> Conclusions <strong>to</strong> <strong>School</strong> and Sample RecommendationsTools and Resources9. Did your district provide a summer feeding program in 2003? (Summer feeding programsinclude meals provided <strong>to</strong> children in summer camps and other organizationsas well as meals provided through National <strong>School</strong> Breakfast and Lunch Programs.)__ Yes__ No9a. If yes, what was the <strong>to</strong>tal number of meals (breakfasts and lunches combined)served during the summer season? _______10. Do you plan <strong>to</strong> offer a summer feeding program in 2004?__ Yes__ Nowww.farm<strong>to</strong>school.org 85
NY Survey of K-12 Food Service Direc<strong>to</strong>rs (Page 2 of 11)<strong>Farm</strong> <strong>to</strong> Conclusions <strong>School</strong> Sample and Tools Recommendationsand Resources11. Do you have salad bars in your district?__ Yes__ No12. Do you sell fresh fruits and vegetables a la carte in your school district?__ Yes__ No13. Do you sell fresh fruit and vegetables in vending machines in your district?__ Yes__ No14. The following is a list of equipment helpful in preparing and serving fresh fruitsand vegetables. For each piece of equipment, please select the appropriate responsefor your primary kitchen.EquipmentApple corerCutting boardsFloor or counter<strong>to</strong>pvegetable chopperFruit/vegetablewedgerFryerIndustrial foodprocessorIndustrial mixerDon’t haveDon’t have,but needHave, butneed moreHaveenoughKnivesOvenSalad barSinksSlicerAny additional equipment you findhelpful86 Bearing Fruit: <strong>Farm</strong> <strong>to</strong> <strong>School</strong> Evaluation Resources and Recommendations
NY Survey of K-12 Food Service Direc<strong>to</strong>rs (Page 3 of 11)Current Buying Practices:15. Do you purchase any food items through a cooperative bid process?__ Yes__ No15a. If yes, what categories of food do you purchase this way? (Please selectall that apply)__ Fresh fruits and vegetables__ Dairy products (milk, ice cream, and cheese)__ Meats__ Canned or frozen fruits and vegetables__ Bread__ Other: _____________________________16. Do you have a prime vendor from whom you purchase a majority of food items?__ Yes__ No16a. If yes, name of vendor: _________________17. Do you purchase any fresh fruits and vegetables from this vendor?__ Yes__ No18. Does your district purchase fresh fruits and vegetables from any other sources?__ Yes__ No18a. If yes, from what other sources does your district purchase or receivefresh fruits and vegetables? (Please select all that apply.)__ Produce vendor__ <strong>Farm</strong>er__ Division of Donated Foods__ Department of Defense Fresh Program__ Other: ___________________________<strong>Farm</strong> Conclusions <strong>to</strong> <strong>School</strong> and Sample RecommendationsTools and Resources19. In your district, how many schools do all, part, or none of the meal preparation onsite?All of the meal preparations on site: ______Part of the meal preparations on site: ______None of the meal preparations on site: ______Please complete questions 20 <strong>to</strong> 22 based on food used during the current year. (Ifyour school participated in either the food service program, or in providing food <strong>to</strong>camps or other childcare programs in the summer, please include that data as well.)www.farm<strong>to</strong>school.org 87
NY Survey of K-12 Food Service Direc<strong>to</strong>rs (Page 4 of 11)<strong>Farm</strong> <strong>to</strong> Conclusions <strong>School</strong> Sample and Tools Recommendationsand Resources20. What were the <strong>to</strong>p 5 WHOLE FRESH FRUITS OR VEGETABLES purchased?(e.g., whole pota<strong>to</strong>es, whole apples, whole pears)1) Name of Fruit or Vegetable:Unit of Purchase: ________Average number of units purchased at One Time: ________Frequency of Purchase: ________Average cost per unit: ________2) Name of Fruit or Vegetable:Unit of Purchase: ________Average number of units purchased at One Time: ________Frequency of Purchase: ________Average cost per unit: ________3) Name of Fruit or Vegetable:Unit of Purchase: ________Average number of units purchased at One Time: ________Frequency of Purchase: ________Average cost per unit: ________4) Name of Fruit or Vegetable:Unit of Purchase: ________Average number of units purchased at One Time: ________Frequency of Purchase: ________Average cost per unit: ________5) Name of Fruit or Vegetable:Unit of Purchase: ________Average number of units purchased at One Time: ________Frequency of Purchase: ________Average cost per unit: ________21. What were the <strong>to</strong>p 5 PREPARED OR PROCESSED FRESH FRUITS OR VEG-ETABLES purchased? (I.e., salad mix, baby carrots, broccoli florets, etc.)1) Name of Fruit or Vegetable:Unit of Purchase: ________Average number of units purchased at One Time: ________Frequency of Purchase: ________Average cost per unit: ________2) Name of Fruit or Vegetable:Unit of Purchase: ________Average number of units purchased at One Time: ________Frequency of Purchase: ________Average cost per unit: ________3) Name of Fruit or Vegetable:Unit of Purchase: ________88 Bearing Fruit: <strong>Farm</strong> <strong>to</strong> <strong>School</strong> Evaluation Resources and Recommendations
NY Survey of K-12 Food Service Direc<strong>to</strong>rs (Page 5 of 11)Average number of units purchased at One Time: ________Frequency of Purchase: ________Average cost per unit: ________4) Name of Fruit or Vegetable:Unit of Purchase: ________Average number of units purchased at One Time: ________Frequency of Purchase: ________Average cost per unit: ________5) Name of Fruit or Vegetable:Unit of Purchase: ________Average number of units purchased at One Time: ________Frequency of Purchase: ________Average cost per unit: ________22. In the table below, the DARK SHADED areas represent the months when the listedfruits and vegetables are available FRESH in <strong>New</strong> York state. For each fruit and vegetable,please indicate if you purchased it fresh REGARDLESS OF WHERE IT WASGROWN during the NY availability period.Example: If you purchased fresh pears from California or any other state anytime fromAugust through November, you will choose “Yes.”ProductItemPurchasedDuringAvailabilityPeriod?Fruits Yes NoApplesBlueberriesCherriesGrapesMelonsPeachesPearsPlumsRaspberriesStrawberriesWatermelonJanuaryFebruaryMarchAprilMayJuneJulyAugustSeptemberOc<strong>to</strong>berNovemberDecember<strong>Farm</strong> Conclusions <strong>to</strong> <strong>School</strong> and Sample RecommendationsTools and Resourceswww.farm<strong>to</strong>school.org 89
NY Survey of K-12 Food Service Direc<strong>to</strong>rs (Page 6 of 11)<strong>Farm</strong> <strong>to</strong> Conclusions <strong>School</strong> Sample and Tools Recommendationsand ResourcesProductItemPurchasedDuringAvailabilityPeriod?Vegetables Yes NoBeansBeetsBroccoliCabbage,greenCabbage,redCarrotsCauliflowerCeleryCornCucumbersEggplantLettuceOnionsParsnipsPeasPeppersPota<strong>to</strong>es,bakingPota<strong>to</strong>es,small/”salt”PumpkinsRadishesRhubarbRutabagasSpinachSquash,summerSquash,winterToma<strong>to</strong>esTurnipsJanuaryFebruaryMarchAprilMayJuneJulyAugustSeptemberOc<strong>to</strong>berNovemberDecember90 Bearing Fruit: <strong>Farm</strong> <strong>to</strong> <strong>School</strong> Evaluation Resources and Recommendations
NY Survey of K-12 Food Service Direc<strong>to</strong>rs (Page 7 of 11)Making the Connection with Local FoodsFor the purpose of this study, local foods are considered those foods grown in <strong>New</strong>York.23. Many school food service direc<strong>to</strong>rs purchase local foods either directly from afarmer or from their usual vendor. Have you ever purchased local foods?__ Yes __ Not that I know of (SKIP TO QUESTION 26)23a. If yes, please indicate which of the following local foods you have purchasedeither directly from a farmer or through a vendor. Please also indicateany local foods you have not yet knowingly purchased, but are interest inpurchasing.Local Vegetables <strong>Farm</strong>er VendorBeans, greenBeans, dryBeetsBroccoliCabbage, greenCabbage, redCarrotsCauliflowerCornCucumbersLettuceOnionsPeppersPota<strong>to</strong>es, bakingPota<strong>to</strong>es, small or“salt”Squash, summerSquash, winterToma<strong>to</strong>esOther:Not yet,but interested<strong>Farm</strong> Conclusions <strong>to</strong> <strong>School</strong> and Sample RecommendationsTools and ResourcesLocal Fruits <strong>Farm</strong>er VendorApplesBlueberriesNot yet,but interestedwww.farm<strong>to</strong>school.org 91
NY Survey of K-12 Food Service Direc<strong>to</strong>rs (Page 8 of 11)<strong>Farm</strong> <strong>to</strong> Conclusions <strong>School</strong> Sample and Tools Recommendationsand ResourcesCherriesGrapesMelonsPeachesPearsPlumsStrawberriesWatermelonOther:Local Meat <strong>Farm</strong>er VendorBeefChickenPorkTurkeyOther:Local Dairy <strong>Farm</strong>er VendorMilkCheeseYogurtOther:24. How likely are you <strong>to</strong> continue purchasing local foods?Not yet,but interestedNot yet,but interestedLocal vegetablesLocal fruitsLocal meatLocal dairyNot likely Somewhat likely Very likelyComments:92 Bearing Fruit: <strong>Farm</strong> <strong>to</strong> <strong>School</strong> Evaluation Resources and Recommendations
NY Survey of K-12 Food Service Direc<strong>to</strong>rs (Page 9 of 11)24a. If you are NOT LIKELY <strong>to</strong> purchase local foods again, please indicatewhy: (Please select all that apply)__ Inconsistent quality__ Unreliable source__ Too much effort__ Too expensive__ Other, please specify: _________________________________25. From your observations, when you served local fruits and vegetables, didstudent intake increase, decrease, or stay about the same?Stayed about theDecreasedsameLocal vegetablesLocal fruits__ I have not observed how local foods changed intakePLEASE SKIP TO QUESTION 27.Increased26. Do you have any interest in purchasing local foods?__ Yes __ No__ Not sure, or “it depends,” please explain: ___________________________26a. If yes, please select the foods you are interested in purchasing:Local Fruits __ Broccoli __ Toma<strong>to</strong>es__ Apples __ Cabbage, green __ Other: ___________ Blueberries__ Cabbage, red__ Cherries __ Carrots Local Meat__ Grapes __ Cauliflower __ Beef__ Melons __ Corn __ Pork__ Peaches __ Cucumbers __ Chicken__ Pears __ Lettuce __ Turkey__ Plums __ Onions __ Other: ___________ Strawberries__ Peas__ Watermelon __ Pota<strong>to</strong>es, baking Local Dairy__ Other: ______ __ Pota<strong>to</strong>es, small or “salt” __ Milk__ Pumpkins__ CheeseLocal Vegetables __ Spinach __ Yogurt__ Beans, green __ Squash, summer __ Other: ___________ Beans, dry__ Squash, winter<strong>Farm</strong> Conclusions <strong>to</strong> <strong>School</strong> and Sample RecommendationsTools and Resources27. In your opinion, what are the potential benefits <strong>to</strong> serving local food in yourdistrict? (Please select all that apply.)__ Students gain greater access <strong>to</strong> fresh fruits and vegetables__ <strong>School</strong>s support the local economy and the local community__ Students have healthier diets__ <strong>School</strong>s know the sources of productswww.farm<strong>to</strong>school.org 93
NY Survey of K-12 Food Service Direc<strong>to</strong>rs (Page 10 of 11)<strong>Farm</strong> <strong>to</strong> Conclusions <strong>School</strong> Sample and Tools Recommendationsand Resources__ Transportation costs are lower__ Local purchases result in good public relations__ <strong>School</strong>s can purchase variable quantities__ <strong>School</strong>s can purchase special varieties__ Other: _________________________________________ In my opinion, there are no benefits <strong>to</strong> serving local food in my district28. What would motivate you <strong>to</strong> increase the use of local foods in your district?(Please select all that apply)__ More products available partially processed(baby carrots, salad mix, chopped onions, etc.)__ More products available canned or frozen__ Assurances of food safety__ More producers in area from whom <strong>to</strong> purchase__ One place <strong>to</strong> order from multiple farmers (I.e., farmer cooperatives)__ <strong>Farm</strong>ers contacting me and showing me their products__Regulations that make it easier <strong>to</strong> purchase directly from farmers__ Financial incentives for purchasing local food__ Additional facilities and/or equipment in the school district <strong>to</strong> prepare food__ Additional food service staff__Programs for food service staff <strong>to</strong> increase culinary skills__ Interest from parents or community member__ Classroom teaching about local foods and agriculture__ Support from district board of education__ Other: __________________________________________________29. What concerns do you have about purchasing local foods? (Please select all thatapply.)__ Quality__ Food safety__ Adequacy of supply__ Reliability of supply__ Ordering procedures__ Payment procedures__ Delivery consideration__ Seasonal availability of <strong>New</strong> York fruits and vegetables__Potential threat <strong>to</strong> relationship with usual vendor__ Product costs__ Consistency of packaging__ Other: __________________________________________________94 Bearing Fruit: <strong>Farm</strong> <strong>to</strong> <strong>School</strong> Evaluation Resources and Recommendations
NY Survey of K-12 Food Service Direc<strong>to</strong>rs (Page 11 of 11)30. How important is each of the following <strong>to</strong> increasing the use of local foods in yourdistrict?A list of when local foods areavailable in <strong>New</strong> York stateA list of local farmers willing <strong>to</strong>sell <strong>to</strong> schoolsHealth and safety informationabout using local foodsRegula<strong>to</strong>ry information (I.e., proceduresfor buying from farmers)<strong>School</strong>-tested recipes and menusthat incorporate local foodsPromotional materials about localfoods <strong>to</strong> display in the cafeteriaInformation and newsletters aboutlocal foods <strong>to</strong> share with familiesExamples of how other schooldistricts use more local foodsVendor indicates on order sheet orin catalog where foods come fromNot at allimportantNot veryimportantSomewhatimportantVeryimportant31. Which of the following steps has your district taken <strong>to</strong> link students with localfarms and agriculture in the last three years? (Please select all that apply.)__ Celebrated NY Harvest for NY Kids Week__ Served meals featuring NY products__ Provided education about NYS food and agriculture__ Held a harvest festival__ Invited a farmer <strong>to</strong> school__ Taken students <strong>to</strong> visit a farm or farmers’ market__ Planted a school garden__ Held a farmers’ market at school__ Visited the Cornell <strong>Farm</strong> <strong>to</strong> <strong>School</strong> Program website__ Other: __________________________________________________<strong>Farm</strong> Conclusions <strong>to</strong> <strong>School</strong> and Sample RecommendationsTools and ResourcesAdapted from “<strong>Farm</strong> <strong>to</strong> <strong>School</strong> in <strong>New</strong> York State: A Survey of K-12Food Serivice Direc<strong>to</strong>rs” Cornell <strong>Farm</strong> <strong>to</strong> <strong>School</strong> Program.www.farm<strong>to</strong>school.org 95
OK Survey of Institutional Food Service Providers (Page 1 of 7)1. My institution’s consumers prefer most of their fruits:<strong>Farm</strong> <strong>to</strong> Conclusions <strong>School</strong> Sample and Tools Recommendationsand Resources□□□FreshFrozenCanned2. My institution’s consumers prefer their vegetables:□□□FreshFrozenCanned3. Does your institution utilize salad bars?□ Yes □ No3a. If yes and you represent a school district, how many schools in each category currentlyhave salad bars?High <strong>School</strong>s _______Middle <strong>School</strong>s _______Elementary <strong>School</strong>s _______4. Approximately what percent of menu items are: (a+b+c must <strong>to</strong>tal 100%)a. Prepared at the service site ______%b. Prepared at a central district processing site ______%c. Prepared off site by a vender/caterer and delivered ______%(Assume the site at which a food is “prepared” is where the most ingredientsare brought <strong>to</strong>gether for a final dish. With the exception of freshfruits and vegetables, heating a food is not considered “preparation”.)5. Please check all methods used <strong>to</strong> dispose of unneeded prepared food:□□□□□□We donate <strong>to</strong> food banksWe donate <strong>to</strong> local charitiesWe allow employees <strong>to</strong> take food homeWe sell excess foodsWe place excess foods in the garbage or down a disposalWe make excess foods available <strong>to</strong> farmers or ranchers96 Bearing Fruit: <strong>Farm</strong> <strong>to</strong> <strong>School</strong> Evaluation Resources and Recommendations
OK Survey of Institutional Food Service Providers (Page 2 of 7)□We add excess foods <strong>to</strong> our composting arrangements6. Are you a member of any purchasing cooperatives?□ Yes □ Noa. If yes, does this cooperative arrange for product delivery?□ Yes □ Nob. Name of cooperative: _______________________________________________7. Do you have a prime vendor from whom you purchase the majority of your fooditems?□ Yes □ No7a. If yes, is the company Oklahoma owned:□ Yes □ No8. Do you have a contract with a food vendor that prohibits your from making localpurchases?□ Yes □ No9. Does your supplier require an exclusive agreement?□ Yes □ No<strong>Farm</strong> Conclusions <strong>to</strong> <strong>School</strong> and Sample RecommendationsTools and Resources10. How many days in advance of actual food preparation do you order food supplies?Canned FoodProduce (fresh)DairyMeats____ days____ days____ days____ daysInstructions: Please complete the following based on food used during your fast fiscalyear (If your institution is a school and participates in summer food services, pleaseinclude that data as well).www.farm<strong>to</strong>school.org 97
OK Survey of Institutional Food Service Providers (Page 3 of 7)<strong>Farm</strong> <strong>to</strong> Conclusions <strong>School</strong> Sample and Tools Recommendationsand Resources11. What were the <strong>to</strong>p 5 FRESH PRODUCE purchases you made in 2000-2001?(I.e. whole pota<strong>to</strong>es, whole apples, fresh strawberries, etc.)1.______________________________________2.______________________________________3.______________________________________4.______________________________________5.______________________________________12. What were the <strong>to</strong>p 5 PREPARED PRODUCE purchases you made in 2000-2001?(i.e. shredded lettuce, peeled carrots, etc)1.______________________________________2.______________________________________3.______________________________________4.______________________________________5.______________________________________Instructions: Please complete the following based on food used during your last fiscalyear (If you institution is a school and participates in summer food services, pleaseinclude that data as well).13. What were the <strong>to</strong>p 5 MEAT & DAIRY purchases you made in 2000-2001?(i.e. hamburger, cold cuts, pork chops, cheeses, milk, eggs,)1.______________________________________2.______________________________________3.______________________________________4.______________________________________5.______________________________________14. Have you purchased foods from a local food producer in the last year?(If no, skip <strong>to</strong> question #15)□ Yes □ No14a. If yes, what products have your purchased?□□□□□□□□□PumpkinsLettucePeasDairy ProductsSpinachToma<strong>to</strong>esSweet CornBeansStrawberries□□□□□□□□□CabbageMushroomsCucumbersBlackberriesPota<strong>to</strong>esChickenGrainsOkraOnions□□□□□□□□□Ground BeefCheeseMelonsSquashEggsPorkPecansLambOther (please describe):98 Bearing Fruit: <strong>Farm</strong> <strong>to</strong> <strong>School</strong> Evaluation Resources and Recommendations
OK Survey of Institutional Food Service Providers (Page 4 of 7)14b. Did you see an increase in fruit and vegetable consumption by consumers whenserving locally produces foods?□ Yes □ No14c. Would you buy products from local producers again?□ Yes □ No □ Not Sure14d. If no, please describe why (check all that apply):□□□□□Inconsistent qualityNot reliableToo much effortPriceOther: please describe why __________________________________15. Please check information that would be helpful for you in making local food purchasingdecisions. Check all that apply.□□□□□□Information on local food programs from around the countryLists of suppliers and products for local sourcesHealth and Safety information of local foodsRegula<strong>to</strong>ry information:(What are the rules about buying foods direct from farmers? Is it legal?)Assistance in developing a system for buying from multiple sourcesAssistance/research on consumers’ vegetable & fruit serving preferences inyour institution16. I would purchase food directly from a local producer (grower/farmer) if price andquality were competitive and a source was available.<strong>Farm</strong> Conclusions <strong>to</strong> <strong>School</strong> and Sample RecommendationsTools and Resources□□□□□Strongly AgreeAgreeDisagreeStrongly DisagreeUncertain17. I would purchase locally produced foods if the Oklahoma Office of CentralPurchasing offered local foods as a part of their contract services.□□□Strongly AgreeAgreeDisagreewww.farm<strong>to</strong>school.org 99
OK Survey of Institutional Food Service Providers (Page 5 of 7)<strong>Farm</strong> <strong>to</strong> Conclusions <strong>School</strong> Sample and Tools Recommendationsand Resources□□Strongly DisagreeUncertain18. My institute would be willing <strong>to</strong> pay a higher price <strong>to</strong> buy locally produced foods<strong>to</strong> serve in cafeterias.□□□□□Strongly AgreeAgreeDisagreeStrongly DisagreeUncertain19. My institution would be interested in buying these foods from local producers.(Check all that apply)□□□□□□□□□□PumpkinsLettucePeasDairy ProductsSpinachToma<strong>to</strong>esSweet CornBeansStrawberriesCabbage□□□□□□□□□MushroomsCucumbersBlackberriesPota<strong>to</strong>esChickenGrainsOkraOnionsGround Beef□□□□□□□□CheeseMelonsSquashEggsPorkPecansLambOther (please describe):_____________________20. What would motivate you <strong>to</strong> serve locally grown or processed food in your institution?(Check all that apply)□□□□□□□□□□□□□Access <strong>to</strong> fresher foodSupport local economy and local communityHigher consumption of fruits and vegetablesBuyer knows product sourcesLower transportation costsLess use of pesticidesHigher quality foodGood public relationsWould help Oklahoma farms and/or Oklahoma businessesAbility <strong>to</strong> purchase small quantitiesAbility <strong>to</strong> purchase special varieties, types of produceOther________________________________None100 Bearing Fruit: <strong>Farm</strong> <strong>to</strong> <strong>School</strong> Evaluation Resources and Recommendations
OK Survey of Institutional Food Service Providers (Page 6 of 7)21. What concerns do you have with regard <strong>to</strong> purchasing locally produced foods?(Check all that apply)□□□□□□□□□□□Food safetyAdequate volumeReliable supplyOrdering methodPayment arrangementDelivery considerationPrime vendor considerationsCostPackage consistencyQualityOther__________________________________22. What barriers currently s<strong>to</strong>p you from purchasing foods directly from local producers?(Check all that apply)□□□□□□□□□□□State spending cap on discretionary purchases (Institutional food servicemust enter in<strong>to</strong> formal contract for any purchases over a certain amount)Institutional (internal) purchasing policiesLack of local producers in area from whom purchaseOther RegulationsLack of products available during certain time of the yearSafetyBudgetConvenience (one-s<strong>to</strong>p shopping)Lack facilities <strong>to</strong> handle large amounts of fresh produce/uncooked bulkmeat, etcLack staffing <strong>to</strong> prep large amounts of fresh produce/uncooked bulk meat, etcOther:<strong>Farm</strong> Conclusions <strong>to</strong> <strong>School</strong> and Sample RecommendationsTools and ResourcesThe Oklahoma Food Policy Council is interested in knowing what would encourageyou <strong>to</strong> change your purchasing behavior <strong>to</strong> include more state produced and processedfood. There are over one-hundred and thirty different types of food productsmade in Oklahoma.23. Are you aware of the Made in Oklahoma program of Oklahoma Department ofAgriculture (www.madeinoklahoma.net)?□ Yes □ Nowww.farm<strong>to</strong>school.org 101
OK Survey of Institutional Food Service Providers (Page 7 of 7)<strong>Farm</strong> <strong>to</strong> Conclusions <strong>School</strong> Sample and Tools Recommendationsand Resources24. What percentage of the food you serve is Oklahoma grown or processed?(Please estimate if not know)_____________ %25. Please identify the title of the person who makes your food purchasing decisions?□□□□□Nutritionist/dieticianChef/food service direc<strong>to</strong>rAdministra<strong>to</strong>rFinancial officerOther: _________________________________26. Does a nutritionist prepare your menu?□ Yes □ No27. If you represent a school, how many students do you serve daily on average?□ Breakfast □ LunchThe Oklahoma State Department of Agriculture and the Oklahoma Food PolicyCouncil are working <strong>to</strong> link local food growers and school food service operations inOklahoma. If you are interested in linking your institution’s food service with localproducers, and/or would like <strong>to</strong> know more about these connections, please provideyour name and contact inform below. This information will only be used <strong>to</strong> link youwith local producers, as a way <strong>to</strong> contact you and/or <strong>to</strong> send more information aboutlocal food connections in your area, and will be kept separate from your survey information.28. Are you interested in connecting your institution with local food producers?□ Yes □ No29. If yes, may we share your name with producers in your area?□ Yes □ NoAdapted from “Oklahoma Institutional Food Service Survey,” Th e Oklahoma<strong>Farm</strong> <strong>to</strong> <strong>School</strong> Report, Oklahoma Food Policy Council, 2003.102 Bearing Fruit: <strong>Farm</strong> <strong>to</strong> <strong>School</strong> Evaluation Resources and Recommendations
Survey of K-12 Food Service Providers in Michigan (Page 1 of 6)PLEASE NOTE: You are being asked <strong>to</strong> participate in a survey sent <strong>to</strong> all food servicedirec<strong>to</strong>r in Michigan contained in the Michigan Department of Education database.Th is survey is intended <strong>to</strong> aid the Department of Education in developing a <strong>Farm</strong> <strong>to</strong><strong>School</strong> Program in Michigan. It is estimated that this will take 20 minutes of yourtime. Your participation in this survey is entirely voluntary, you may choose not <strong>to</strong>participate or you may refuse <strong>to</strong> or answer certain questions or discontinue yourparticipation at any time without penalty or loss of benefits. Return of this surveywill constitute informed consent. All information collected as part of this survey willremain confidential, it will be s<strong>to</strong>red in a locked file in the offices of Dr. Hamm andthe surveys will be destroyed after 3 years. Access <strong>to</strong> the surveys will be restricted <strong>to</strong>investiga<strong>to</strong>rs approved through the MSU Human Subjects Review procedure. Yourprivacy will be protected <strong>to</strong> the maximum extent allowable by law. There are noanticipated risks <strong>to</strong> you for participating. It is anticipated that you, as a food servicedirec<strong>to</strong>r, will benefit from helping determine the direction of a <strong>Farm</strong> <strong>to</strong> <strong>School</strong> Programin Michigan.If you have any question about this survey, please feel free <strong>to</strong> contact Mike Hamm,517-432-1611 or mhamm@msu.edu. If you have any questions or concerns regardingyour rights as a survey participant you may contact-anonymously, if you wish- PeterVasilenko, Ph.D., Chair of the University Committee on Research Involving HumanSubjects (UCRIHS) by phone: (517) 335-2180, fax: (517) 432-4503, email: ucrihs@msu.edu, or regular mail: 202 Olds Hall, East Lansing, MI 48824.Th ank you very much for you participation.Name:___________________<strong>School</strong> District or <strong>School</strong>:_____________________________1. Are you a member of any purchasing cooperatives?__ Yes __ No<strong>Farm</strong> Conclusions <strong>to</strong> <strong>School</strong> and Sample RecommendationsTools and Resources2. If yes, are you a member of?__ SPARC__ Great Lakes Cooperative (GLC)__ Other: _____________________________________3. Who are your major vendors (please list the percentage or purchases you make fromthese vendors)1. ___________________________________ _________%2. ___________________________________ _________%3. ___________________________________ _________%4. ___________________________________ _________%5. ___________________________________ _________%www.farm<strong>to</strong>school.org 103
Survey of K-12 Food Service Providers in Michigan (Page 2 of 6)<strong>Farm</strong> <strong>to</strong> Conclusions <strong>School</strong> Sample and Tools Recommendationsand Resources4. How much do you currently spend annually on fresh produce?$______________________5. Do you have a contract with a food vendor that prohibits you from making localpurchases?__ Yes __ No6. Does your supplier require an exclusive agreement?__ Yes __ No7. How many days in advance of actual food preparation do you order food supplies?Canned Food ____ daysProduce (fresh) ____ daysDairy ____ daysMeats ____ days8. Approximately what percent of menu items are: (a+b+c must <strong>to</strong>tal 100%)a. Prepared at the service site ______%b. Prepared at a central district processing site ______%c. Prepared off site by a vender/caterer and delivered ______%(Assume the site at which a food is “prepared” is where the most ingredients arebrought <strong>to</strong>gether for a final dish. With the exception of fresh fruits and vegetables,heating a food is not considered “preparation”.)9. Your students prefer most of their fruits:__ Fresh__ Frozen__ Canned10. Your students prefer their vegetables:__ Fresh__ Frozen__ Canned11. Do your students utilize salad bars?__ Yes __ No11a. If yes and you represent a school district, how many schools in each categorycurrently have salad bars?High <strong>School</strong>s ______Middle <strong>School</strong>s ______Elementary <strong>School</strong>s ______104 Bearing Fruit: <strong>Farm</strong> <strong>to</strong> <strong>School</strong> Evaluation Resources and Recommendations
Survey of K-12 Food Service Providers in Michigan (Page 3 of 6)Instructions: Please complete the following based on food used during your last fiscalyear (If your institution is a school and participates in summer food services, pleaseinclude that data as well).12. What were the 5 most popular FRESH PRODUCE purchases you made in 2002-2003?(I.e. whole pota<strong>to</strong>es, whole apples, fresh strawberries, etc.)1. ___________________________________2. ___________________________________3. ___________________________________4. ___________________________________5. ___________________________________13. What were the 5 most popular PREPARED FRESH PRODUCE purchases youmade in 2002-2003? (i.e. shredded lettuce, peeled carrots, etc.)1. ___________________________________2. ___________________________________3. ___________________________________4. ___________________________________5. ___________________________________14. Have you purchased foods from a local farmer/producer in the last year?(If no, skip the question #15)__ Yes __ No15a. If yes, what products have you purchased? (Check all that apply)Vegetables__ Green Beans __ Peas __ Spinach __ Sweet Corn __ Mushrooms__ Asparagus __ Broccoli __ Soy Beans __ Dry Beans __ Lettuce__ Squash __ Toma<strong>to</strong>es __ Cabbage __ Pumpkins __ Cucumbers__ Pota<strong>to</strong>es __ Grain __ Onions __ Other: __________________<strong>Farm</strong> Conclusions <strong>to</strong> <strong>School</strong> and Sample RecommendationsTools and ResourcesFruits__ Cherries __ Blueberries __ Peaches __ Melons __ Strawberries__ Apples __ Apple Varieties: _________________ __Other: ___________Meat Products__ Lamb __ Fish __ Ground Beef __ Chicken __Pork__Dairy __ Cheese __ Eggs15b. Did you see an increase in fruit and vegetable consumption by students whenserving locally produced foods?__ Yes __ Nowww.farm<strong>to</strong>school.org 105
Survey of K-12 Food Service Providers in Michigan (Page 4 of 6)<strong>Farm</strong> <strong>to</strong> Conclusions <strong>School</strong> Sample and Tools Recommendationsand Resources15c. Would you buy products from local farms/producers again?__ Yes __ No __ Not Sure15d. If no, please describe why (check all that apply):__ In consistent quality__ Not reliable__ Too much effort__ Price__ Other: please describe why ________________________________16. I would purchase food directly from a local producer (grower/farmer) if price andquality were competitive and a source was available.__ Strongly Agree__ Agree__ Neutral__ Disagree__ Strongly Disagree17. I would purchase locally produced foods if my vendors and/or state warehousedistribu<strong>to</strong>r offered local foods as part of their contract services.__ Strongly Agree__ Agree__ Neutral__ Disagree__ Strongly Disagree18. My district/school would be willing <strong>to</strong> pay a higher price <strong>to</strong> buy locally producedfoods <strong>to</strong> serve in cafeterias.__ Strongly Agree__ Agree__ Neutral__ Disagree__ Strongly Disagree19. My district/school would be interested in buying these foods from local producers.(Check all that apply)Vegetables__ Green Beans __ Peas __ Spinach __ Sweet Corn __ Mushrooms__ Asparagus __ Broccoli __ Soy Beans __ Dry Beans __ Lettuce__ Squash __ Toma<strong>to</strong>es __ Cabbage __ Pumpkins __ Cucumbers__ Pota<strong>to</strong>es __ Grain __ Onions __ Other: __________________106 Bearing Fruit: <strong>Farm</strong> <strong>to</strong> <strong>School</strong> Evaluation Resources and Recommendations
Survey of K-12 Food Service Providers in Michigan (Page 5 of 6)Fruits__ Cherries __ Apples __ Peaches __ Melons __ Strawberries__ Other: ___________Meat Products__ Lamb __ Fish __ Ground Beef __ Chicken __PorkDairy__ Cheese__ Eggs20. What would motivate you <strong>to</strong> serve locally grown or processed food in your institution?(Check all that apply)__ Access <strong>to</strong> fresher food__ Support local economy and local community__ Higher consumption of fruits and vegetables__ Buyer knows product sources__ Lower transportation costs__ Less use of pesticides__ Higher quality food__ Good public relations__ Would help Michigan farms and/or Michigan businesses__ Ability <strong>to</strong> purchase small quantities__ Ability <strong>to</strong> purchase special varieties, types of produce__ Other __________________________________ None21. What concerns do you have with regard <strong>to</strong> purchasing locally produced foods?(Check all that apply)__ Food Safety__ Adequate volume__ Reliable supply__ Ordering method__ Payment arrangement__ Delivery consideration__ Seasonality of Michigan fruits and vegetables__ Prime vendor considerations__ Cost__ Package consistency__ Quality__ Other ________________________________<strong>Farm</strong> Conclusions <strong>to</strong> <strong>School</strong> and Sample RecommendationsTools and Resourceswww.farm<strong>to</strong>school.org 107
Survey of K-12 Food Service Providers in Michigan (Page 6 of 6)<strong>Farm</strong> <strong>to</strong> Conclusions <strong>School</strong> Sample and Tools Recommendationsand Resources22. What barriers could s<strong>to</strong>p you from purchasing foods directly from local producers?(Check all that apply)__ Federal and state procurement regulations (<strong>School</strong> food services must enter in<strong>to</strong>formal contract for any purchases over a certain amount)__ Institutional (internal) purchasing policies__ Lack of local producers in area from whom <strong>to</strong> purchase__ Other Regulations__ Lack of products available during certain time of the year__ Safety__ Budget__ Convenience (one-s<strong>to</strong>p shopping)__ Lack facilities <strong>to</strong> handle fresh produce/uncooked bulk meat, etc.__ Lack staffing <strong>to</strong> prep fresh produce/uncooked bulk meat, etc.__ Other: __________________________________________________________23. Please check information that would be helpful for you in making local foodpurchasing decisions. Check all that apply.__ Information on local food programs from around the country__ Lists of suppliers and products for local sources__ Health and Safety information of local foods__ Regula<strong>to</strong>ry information (What are the rules about buying foods direct from farmers?Is it legal?)__ Assistance in developing a system for buying from multiple sources__ Assistance with marketing techniques for expanding the palate of children__ Other24. Are you interested in connecting your institution with a local farmer?__ Very interested__ Somewhat interested__ Neutral__ Not very interested__ Not interested25. Thank you for taking time <strong>to</strong> fill out this survey. Your participation is very important<strong>to</strong> us. If you have any additional comments regarding this survey or purchasinglocally produced foods, feel free <strong>to</strong> write them here.________________________________________________________________________________________________________________________________________________________________________________________________________________________________________________________________________________________________Adapted from “Survey of K-12 Food Service Providers in Michigan” Izumi BT, Rostant OS, Moss MJ, HammMW. Results from the 2004 Michigan <strong>Farm</strong>-<strong>to</strong>-<strong>School</strong> Survey, J Sch Health 2006 May; 76(5) 169-74.108 Bearing Fruit: <strong>Farm</strong> <strong>to</strong> <strong>School</strong> Evaluation Resources and Recommendations
National <strong>Farm</strong> <strong>to</strong> <strong>School</strong> Web Survey (Page 1 of 6)1. Introduction <strong>to</strong> the Request for InformationThank you for filling out this request for information. We anticipate this form will take 15 <strong>to</strong> 20 minutes <strong>to</strong> complete.The National <strong>Farm</strong> <strong>to</strong> <strong>School</strong> Program is conducting a survey of farm <strong>to</strong> school programs across the country. We areasking school food service staff and /or administra<strong>to</strong>rs <strong>to</strong> respond <strong>to</strong> this survey.If you oversee food service operations for the entire school district, please answer questions based on dataavailable for the school district. If you oversee operations for a single school, please provide data from your school.The information you provide will help develop a national clearing house of farm <strong>to</strong> school project information that willpromote successful farm <strong>to</strong> school models <strong>to</strong> more school districts across the country. The information will helpinform policy makers, legisla<strong>to</strong>rs, funding agencies, media and other school districts about the scope and importanceof the farm <strong>to</strong> school program, which in turn will provide more credibility, support and resources for your efforts atthe local level.The information will be compiled and <strong>report</strong>ed at the national level, and your individual responses will not be used or<strong>report</strong>ed without your prior consent.2. <strong>School</strong> District Data/ General1. Please provide the following information.Your State:Name of your schooldistrict:If you are notrepresenting a schooldistrict, indicate the nameand type of yourindividual school (i.e.Alternative <strong>School</strong>s orPreschools).2. Please indicate the student enrollment number of each type of school within yourschool district or for your individual school. PLEASE PROVIDE TOTAL IF BREAKDOWNBY SCHOOLS IS NOT EASILY AVAILABLE.DISTRICT TOTAL (If youfill this in, you do NOTneed <strong>to</strong> fill out the rest)ElementaryMiddle / Junior HighHighOther schools (i.e.Alternative <strong>School</strong>s /Preschools)<strong>Farm</strong> Conclusions <strong>to</strong> <strong>School</strong> and Sample RecommendationsTools and Resources3. Please indicate the percentage of student enrollment participation in the Free orReduced Lunch Program (check one) PLEASE PROVIDE DISTRICT TOTAL IFBREAKDOWN BY SCHOOLS IS NOT EASILY AVAILABLE. If you are just answering foran individual school, check one category AFTER 'OTHER SCHOOLS.'0-25 % 26-50 % 51-75 % 76-100 %District Total (If you fillnmlkj nmlkj nmlkj nmlkjthis in, you do NOT need<strong>to</strong> fill out the rest)Elementary nmlkj nmlkj nmlkj nmlkjMiddle / Junior High nmlkj nmlkj nmlkj nmlkjHigh nmlkj nmlkj nmlkj nmlkjOther schools (i.e.Alternative <strong>School</strong>s/Preschools)nmlkj nmlkj nmlkj nmlkj4. Please check whether you are filling out this survey for an individual school or anentire school district.nmlkjIndividual <strong>School</strong>nmlkj <strong>School</strong> Districtwww.farm<strong>to</strong>school.org 109
National <strong>Farm</strong> <strong>to</strong> <strong>School</strong> Web Survey (Page 2 of 6)<strong>Farm</strong> <strong>to</strong> Conclusions <strong>School</strong> Sample and Tools Recommendationsand Resources3. Questions if Answering for <strong>School</strong> DistrictYou are being prompted <strong>to</strong> answer questions on this page, because you indicated in the previous question that youare filling out this survey for an entire school district, not just an individual school. IF YOU ARE ANSWERING FOR ANINDIVIDUAL SCHOOL AND MISTAKENLY ENDED UP ON THIS PAGE, CLICK 'PREV' TO CORRECT YOUR RESPONSE ON THEPREVIOUS QUESTION.5. Please indicate the number of each type of school within your school district.PLEASE PROVIDE DISTRICT TOTAL IF BREAKDOWN BY SCHOOLS IS NOT EASILYAVAILABLE.DISTRICT TOTAL (If youfill this in, you do NOTneed <strong>to</strong> fill out the rest)ElementaryMiddle / Junior HighHighOther schools (i.e.Alternative <strong>School</strong>s /Preschools)6. Indicate the number of schools with operational farm <strong>to</strong> school activities you areaware of in your school district. Please indicate DK if your response is “Do NotKnow”. PLEASE PROVIDE TOTAL IF BREAKDOWN BY SCHOOLS IS NOT EASILYAVAILABLE.District Total (if you fillthis in, you do NOT need<strong>to</strong> fill out the rest)ElementaryMiddle / Junior HighHighOther schools7. Please indicate the level of schools implementing the various farm <strong>to</strong> schoolcomponents in your school districtDistrictwideimplementationLocalpurchasing<strong>School</strong>gardens<strong>School</strong>Gardenproduct incafeteria or ManagementclassroomsComposting /WasteIn-classnutritioneducationIn-classsnacksOut-ofclassroomlearninggfedc gfedc gfedc gfedc gfedc gfedc gfedc gfedcElementary gfedc gfedc gfedc gfedc gfedc gfedc gfedc gfedcOtherMiddle/Junior High gfedc gfedc gfedc gfedc gfedc gfedc gfedc gfedcHigh gfedc gfedc gfedc gfedc gfedc gfedc gfedc gfedcOther schools forexampleAlternative/Preschoolsgfedc gfedc gfedc gfedc gfedc gfedc gfedc gfedc110 Bearing Fruit: <strong>Farm</strong> <strong>to</strong> <strong>School</strong> Evaluation Resources and Recommendations
National <strong>Farm</strong> <strong>to</strong> <strong>School</strong> Web Survey (Page 3 of 6)4. Overview of <strong>Farm</strong> <strong>to</strong> <strong>School</strong> Activities<strong>Farm</strong> <strong>to</strong> school encompasses a variety of activities in the cafeteria and the classroom as well as education outside the classrooms. Ifyou oversee food service operations for the entire school district, please answer questions based on data available for the schooldistrict. If you oversee operations for a single school, please use data from your school.8. From the following list of activities, please indicate any farm <strong>to</strong> school activitiesthat your school or school district conducts, and which year it began.Activity conductedIn which year did the activity begin?A. Purchasing food from□ Yes □ No □ Don’t Knowlocal farmersB. <strong>School</strong> gardens□ Yes □ No □ Don’t KnowC. Incorporating school□ Yes □ No □ Don’t Knowgarden produce incafeteria or for use inclassroom taste testsD. Composting /Waste□ Yes □ No □ Don’t KnowManagement ProgramsE. Conducting In-Class□ Yes □ No □ Don’t KnowNutrition EducationF. In -class snacks using□ Yes □ No □ Don’t Knowlocal productsG. Offering out-ofclassroomlearning□ Yes □ No □ Don’t Knowopportunities such asfarm and farmer marketvisitsH. Other□ Yes □ No □ Don’t Know9. Please indicate the number of farmers selling <strong>to</strong> the school or school district viaeach avenue.Check HERE ifyou use thisavenue BUT do11-2021-3031-40not know the 0 FARMERS 1-5 FARMERS 6-10 FARMERSFARMERS FARMERS FARMERSnumber offarmersinvolvedPurchase directly fromnmlkj nmlkj nmlkj nmlkj nmlkj nmlkj nmlkjfarmersPurchase directly fromnmlkj nmlkj nmlkj nmlkj nmlkj nmlkj nmlkjfarmers marketPurchase throughnmlkj nmlkj nmlkj nmlkj nmlkj nmlkj nmlkjdistribu<strong>to</strong>rs / processors,who buy from local farmersPurchase from growernmlkj nmlkj nmlkj nmlkj nmlkj nmlkj nmlkjcooperativesOther nmlkj nmlkj nmlkj nmlkj nmlkj nmlkj nmlkj<strong>Farm</strong> Conclusions <strong>to</strong> <strong>School</strong> and Sample RecommendationsTools and Resourceswww.farm<strong>to</strong>school.org 111
National <strong>Farm</strong> <strong>to</strong> <strong>School</strong> Web Survey (Page 4 of 5)<strong>Farm</strong> <strong>to</strong> Conclusions <strong>School</strong> Sample and Tools Recommendationsand Resources10. To your knowledge, are there any in-class education activities related <strong>to</strong> farm <strong>to</strong>school in your school or school district? These may be conducted either by theschook, the school district, or by other agencies or organizations. Please check anyactivities that you are aware of:gfedc DO NOT KNOW of any in-class education related <strong>to</strong> farm <strong>to</strong> school being conductedgfedc Nutrition / Health educationgfedc Agriculture educationgfedc <strong>Farm</strong>er in the classroomgfedc Chef in the classroomgfedc Cooking demonstrationsgfedc <strong>School</strong> district doesn’t conduct in-class education related <strong>to</strong> farm <strong>to</strong> schoolgfedc Other (please specify)11. To your knowledge, are the activities outlined in this survey supported byexternal funding sources? These may include grants, contracts and other moniesreceived either directly by the school, school district, or by program partners. Pleasecheck sources from the list below:gfedc Federal fundsgfedc State fundsgfedc Local governmentgfedc Private Foundationsgfedc Individual donorsgfedc Local Universities / Collegesgfedc No external support receivedgfedc Other (please specify)12. We would like <strong>to</strong> document the partnerships that bring <strong>to</strong>gether a successfulfarm <strong>to</strong> school program. Please indicate which agencies or organizations, if any,assisted with farm <strong>to</strong> school activities in your school or school district - check all thatapply. Indicate DK if your response is “Do Not Know”Participate in<strong>Farm</strong> <strong>to</strong> school<strong>Farm</strong> <strong>to</strong> <strong>School</strong> Event planning PromotionEvaluationOtherimplementationCommitteeFaith-based / Religiousgfedc gfedc gfedc gfedc gfedc gfedcorganizationsAgriculture focusedgfedc gfedc gfedc gfedc gfedc gfedcorganizationsCooperative Extensiongfedc gfedc gfedc gfedc gfedc gfedcagenciesHealth / Nutritiongfedc gfedc gfedc gfedc gfedc gfedcorganizationsEducational institutions –gfedc gfedc gfedc gfedc gfedc gfedcuniversities and collegesParent groups gfedc gfedc gfedc gfedc gfedc gfedcOthers gfedc gfedc gfedc gfedc gfedc gfedc112 Bearing Fruit: <strong>Farm</strong> <strong>to</strong> <strong>School</strong> Evaluation Resources and Recommendations
National <strong>Farm</strong> <strong>to</strong> <strong>School</strong> Web Survey (Page 5 of 6)13. The National <strong>Farm</strong> <strong>to</strong> <strong>School</strong> Program is developing a network <strong>to</strong> promote andsupport farm <strong>to</strong> school programs and practitioners across the country. We would like<strong>to</strong> know what support from the regional or national level you need most <strong>to</strong> furtherdevelop your farm <strong>to</strong> school program. Please select three options from the list below,and rank them on the basis of priority need.Highest Priority Medium Priority Low PriorityPolicy Development andnmlkj nmlkj nmlkjAdvocacyDeveloping a Supportnmlkj nmlkj nmlkj<strong>Network</strong>Program Development –nmlkj nmlkj nmlkjsuch as finding farmers,developing seasonalmenus, bidspecifications.Outreach <strong>to</strong> Media /nmlkj nmlkj nmlkjPublic RelationsCampaignsSeeking and Maintainingnmlkj nmlkj nmlkjCollaborationsSustaining fundraisingeffortsnmlkj nmlkj nmlkj14. Which of these categories of food do you source locally?gfedc Fresh Produce (fruits and vegetables)gfedc Dairy products and eggsgfedc Bread, Bakery items, Grainsgfedc Meats and entrée optionsgfedc Canned itemsgfedc Beverages and Water15. For the food categories you checked as sourcing locally on the previous question,what is the Total Annual Budget (FY 2004-05) for these categories? ONLY PROVIDETHIS INFORMATION FOR THE CATEGORIES YOU CHECKED ON THE PREVIOUSQUESTION.Total FoodFresh Produce (fruits andvegetables)<strong>Farm</strong> Conclusions <strong>to</strong> <strong>School</strong> and Sample RecommendationsTools and ResourcesDairy products and eggsBread, Bakery items,GrainsMeats and entrée optionsCanned itemsBeverages and Water16. As per FY 04-05 budget indicated in the previous question, please estimateamount spent on LOCAL product. Check N/A if you do not buy this product locally.0-10% 11-20% 21-30% 31-40% More than 40% N/ATotal Food nmlkj nmlkj nmlkj nmlkj nmlkj nmlkjFresh Produce(fruits andnmlkj nmlkj nmlkj nmlkj nmlkj nmlkjvegetables)Dairy products and eggs nmlkj nmlkj nmlkj nmlkj nmlkj nmlkjBread, bakery items andnmlkj nmlkj nmlkj nmlkj nmlkj nmlkjgrainsMeats and entree options nmlkj nmlkj nmlkj nmlkj nmlkj nmlkjCanned items nmlkj nmlkj nmlkj nmlkj nmlkj nmlkjBeverages and Water nmlkj nmlkj nmlkj nmlkj nmlkj nmlkjwww.farm<strong>to</strong>school.org 113
National <strong>Farm</strong> <strong>to</strong> <strong>School</strong> Web Survey (Page 6 of 6)<strong>Farm</strong> <strong>to</strong> Conclusions <strong>School</strong> Sample and Tools Recommendationsand Resources17. Please estimate your future expenditures on local product, indicated aspercentage (%) of FY 2005-06 budgetTotal FoodFresh Produce (fruits andvegetables)Dairy ProductsBread, Bakery items andGrainsMeats and entree optionsCanned itemsBeverages and Water18. THIS IS AN OPTIONAL QUESTIONPlease describe briefly your experiences with implementing a farm <strong>to</strong> school programin your school or district- include any innovative strategies you have applied <strong>to</strong>overcome barriers, and any tips you would like <strong>to</strong> share with other food servicedirec<strong>to</strong>rs interested in the farm <strong>to</strong> school approach. Please also include a few linesabout your future plans for the program.THANK YOU FOR COMPLETING THIS REQUEST FOR INFORMATION. We would like <strong>to</strong> provide your contact informationand program details on the National <strong>Farm</strong> <strong>to</strong> <strong>School</strong> Website and include you on our mailing list. Please check theboxes below <strong>to</strong> indicate your consent or non-consent. If you would like <strong>to</strong> learn more about the farm <strong>to</strong> schoolprogram, please visit www.farm<strong>to</strong>school.org.*19. Please indicate your contact information.Name of respondent:<strong>School</strong>/Organization:Position:Mailing Address:City:State:Zip:*Phone:Fax:email:20. We would like <strong>to</strong> provide your contact information and program details on theNational <strong>Farm</strong> <strong>to</strong> <strong>School</strong> Website. We would also like <strong>to</strong> add your name <strong>to</strong> our mailinglist. We anticipate sending you periodic updates on farm <strong>to</strong> school events,networking and funding opportunities in your region. Please check the boxes below ifyou consent <strong>to</strong> this.gfedc I DO consent <strong>to</strong> my name, contact and program information being featured on the National <strong>Farm</strong> <strong>to</strong> <strong>School</strong> website atwww.farm<strong>to</strong>school.orggfedc I DO wish <strong>to</strong> receive periodic updates from the National <strong>Farm</strong> <strong>to</strong> <strong>School</strong> Program. We anticipate sending you periodic updateson farm <strong>to</strong> school events, networking and funding opportunities in your region.Adapted from “National <strong>Farm</strong> <strong>to</strong> <strong>School</strong> Program Request for Information” National <strong>Farm</strong><strong>to</strong> <strong>School</strong> <strong>Network</strong>, Center for Food & Justice, UEPI, Occidental College, 2006.114 Bearing Fruit: <strong>Farm</strong> <strong>to</strong> <strong>School</strong> Evaluation Resources and Recommendations
K-12 Food Service Direc<strong>to</strong>rs Needs Assessment (Page 1 of 6)Date______________Name_______________________________ Email ______________________________<strong>School</strong>/District____________________________ County________________________Address_________________________________________________________________City___________________________ State____________ Zip code_________________Telephone______________________________ Fax______________________________Basic InformationTotal Student Enrollment______________Number of schools in your district_________ Elementary_____ Middle______ HighDo you participate in USDA school meals program? YES______ NO_______Number of students on free and reduced breakfast/lunch program_____________ON average, how many student lunches do you serve in a day? _______ADP (Average Daily Participation) rate: _______%What is the price of lunch? Full Price________ Reduced__________Do you have a summer feeding lunch program? YES_______ NO________<strong>Farm</strong> Conclusions <strong>to</strong> <strong>School</strong> and Sample RecommendationsTools and ResourcesIf yes, how many children take part in it?____________Do you participate in the DoD Fresh program? (if in a DoD area)YES________ NO________The Food Service FacilityDoes each school in your district have a “scratch” kitchen? YES_______ NO_______If no, how many are there and in which schools?_______________________________Do you have central kitchens that deliver <strong>to</strong> other schools? YES_______ NO_______www.farm<strong>to</strong>school.org 115
K-12 Food Service Direc<strong>to</strong>rs Needs Assessment (Page 2 of 6)<strong>Farm</strong> <strong>to</strong> Conclusions <strong>School</strong> Sample and Tools Recommendationsand ResourcesDo you nave enough cold s<strong>to</strong>rage and/or dry s<strong>to</strong>rage space <strong>to</strong> accommodate an increaseduse of fresh and fresh s<strong>to</strong>red fruits and vegetables? (Describe)Is your Food service equipped <strong>to</strong> prepare whole fruits and vegetables? (Please list) (e.g.Do you have an adequate supply of knives, food processors, wedgers, peelers, slicers,etc.?)Food Service Staff Skills, Experience, and InterestNumber of food service staff:_______ Full Time________ Part TimeNumber with culinary training____________Are there any time constraints on food preparation in the school? (Describe)Do time constraints influence what you put on your menu? (Describe)To what extent is time a deterrent from using more whole fruits and vegetables in yourlunches?□ Large extent □ Moderate extent □ Small extent □ Time is not a deterrentIs your staff adequately trained <strong>to</strong> prepare whole fruits and vegetables? If not, whattraining would be helpful?Are there any whole fruits or vegetables that you do not use because of the amount ofprep time required? (i.e. pumpkin, butternut squash, acorn squash)?116 Bearing Fruit: <strong>Farm</strong> <strong>to</strong> <strong>School</strong> Evaluation Resources and Recommendations
K-12 Food Service Direc<strong>to</strong>rs Needs Assessment (Page 3 of 6)Menus and RecipesDo you have full control over menu development? YES_______ NO________If yes, what are your main considerations when developing your menu(s) (Is it labor, Isit student preferences, Is it pricing)? If no, how is it developed?Do you develop different menus for different schools or districts?Do you have a menu cycle? If so, for what time period?How often are your recipes reviewed and revised?Have you modified or changed recipes recently? Is so, how?How are new items/recipes introduced <strong>to</strong> the students? Provide an example.Fruit and Vegetable Use and ProcurementWhat fruits and vegetables do you use most frequently in your school lunches?(Please list)<strong>Farm</strong> Conclusions <strong>to</strong> <strong>School</strong> and Sample RecommendationsTools and ResourcesMost schools require at least a small degree of processing in fruit and vegetables.Looking at your list above, describe the least processed form (e.g. chopped, sliced,peeled, etc.) in which you could accept each product for you food service. Circle anyyou have purchased whole (fresh or fresh s<strong>to</strong>red).Are there any fruits and vegetables you don’t currently use but would like <strong>to</strong>?YES_______ No_______If yes, which ones?www.farm<strong>to</strong>school.org 117
K-12 Food Service Direc<strong>to</strong>rs Needs Assessment (Page 4 of 6)<strong>Farm</strong> <strong>to</strong> Conclusions <strong>School</strong> Sample and Tools Recommendationsand ResourcesHow would you describe your knowledge of what fruits and vegetables are grownlocally?Very good Ok Need HelpWhat are some things that would make it easier for you <strong>to</strong> purchase local fruits andvegetables in the school?How many produce deliveries do you get in a week?What, if any, flexibility do you have in your delivery schedule?Local Food Practices(by “local” we generally mean within your state or region)Do you purchase any of the fruit and vegetables on your menu locally?If yes, which ones?YES NO Don’t KnowIf no, are there any fruits and vegetables you would like <strong>to</strong> get from local or regionalsources? Which ones?Th ere are many ways <strong>to</strong> start using locally grown fruits and vegetables. For example,have you (or are you interested in…)Let your supplier/distribu<strong>to</strong>r know of your interest in locally produced fruits andvegetables?_____Interested _____Have Done ______Not InterestedPurchased produce directly from a farmer?_____Interested _____Have Done ______Not InterestedFeatured local food in a school event, special meal, or harvest event?For example, celebrating NY Harvest for NY Kids Week_____Interested _____Have Done ______Not Interested118 Bearing Fruit: <strong>Farm</strong> <strong>to</strong> <strong>School</strong> Evaluation Resources and Recommendations
K-12 Food Service Direc<strong>to</strong>rs Needs Assessment (Page 5 of 6)Developed seasonal menus or recipes using local foods?_____Interested _____Have Done ______Not InterestedAre there any other steps besides these that you’ve taken <strong>to</strong> increase you use of localproduce?In your opinion, what barriers are there, if any, <strong>to</strong> your district’s ability <strong>to</strong> purchasefruits and vegetables from your area? (e.g. concern about cost, location, optionsprovided by distribu<strong>to</strong>r, etc.)<strong>School</strong> and CommunityDoes your school hold any harvest, farm, or food system events? If so, what sorts ofactivities are involved?Does your districts wellness or nutrition policy include… (please check all that apply)_____Restrictions on food served in vending machines?_____A soda ban on campus?_____Specifi c s on allowable competitive foods?_____Specifi c s on foods allowed in fund-raisers or class parties?_____Specifi c s on foods children can bring <strong>to</strong> school?_____An emphasis on locally grown/produced food?<strong>Farm</strong> Conclusions <strong>to</strong> <strong>School</strong> and Sample RecommendationsTools and ResourcesDoes your school have a wellness committee? YES_____ NO_____Are there other committees working on nutrition and food service issues? (e.g. parentassociation) YES_____ NO_____Are you included in any of these committees? YES______ NO______How would you describe administrative, school board, and community support forpurchasing local products?www.farm<strong>to</strong>school.org 119
K-12 Food Service Direc<strong>to</strong>rs Needs Assessment (Page 6 of 6)<strong>Farm</strong> <strong>to</strong> Conclusions <strong>School</strong> Sample and Tools Recommendationsand ResourcesStudent Preferences and Involvement in Food ServiceDo you have a process for learning about food interests of the students?YES______ NO______ If so, describe:What kind of contact do you have with students?Do you hold taste testing with students before new recipes or new foods are introducedin the cafeteria? YES____ NO____ If so, describe:Where do you do taste testing? (e.g. in the cafeteria, a garden, or classroom)Does anyone else in the district do taste testing with students? (e.g. classroom teachersor food service direc<strong>to</strong>r/staff) YES_____ NO_____What do you think would help kids at your school <strong>to</strong> eat more fruits and vegetables?Does your food service collaborate with classroom learning around food (i.e. classroomcooking demonstrations, taste-tests, etc.)? Describe:Your <strong>Farm</strong> <strong>to</strong> <strong>School</strong> VisionWhat would you like <strong>to</strong> see in a <strong>Farm</strong> <strong>to</strong> <strong>School</strong> project in your food service?What would help you get started with the process of using more locally grown foodsin your cafeteria?_____Assistance in identifying local foods and potential sources_____Meeting with farmers and suppliers_____Local purchasing connection_____Taste test plan_____Parent/volunteer training program_____Other:______________________________________________Is there anything else you would like <strong>to</strong> add or ask?Adapted from “Northeast K-12 Food Service Direc<strong>to</strong>rs’ Needs Assessment Tool” Wilkins J, Mouillesseaux-Kunzman H, Graham M, Bacelli B, Goodsell M, <strong>Farm</strong> <strong>to</strong> <strong>School</strong> in the Northeast: Making the Connectionfor Healthy Kids and Healthy <strong>Farm</strong>s, A Toolkit of Extension Educa<strong>to</strong>rs and Community Leaders. Cornell<strong>Farm</strong> <strong>to</strong> <strong>School</strong> Program, NY <strong>Farm</strong>s! and <strong>New</strong> York <strong>School</strong> Nutrition Association, May 2006.120 Bearing Fruit: <strong>Farm</strong> <strong>to</strong> <strong>School</strong> Evaluation Resources and Recommendations
Survey of Fruit, Vegetable, and Nut Producers (Page 1 of 3)1. What are your primary agricultural products?Fruits□ Apples □ Pears □ Peaches□ Plums □ Melons □ Cherries□ BerriesVegetables□ Chile □ Toma<strong>to</strong>es □ Carrots□ Sweet Corn □ Green Beans □ Squash□ Lettuce □ Mixed Salad Greens □ Spinach□ Okra □ Cucumbers □ Pota<strong>to</strong>es□ Pumpkins □ Cabbage □ OnionsNuts/Beans/Grains:□ Pistachios □ Peanuts □ Dry Pin<strong>to</strong> Beans□ Whole Wheat Flour □ Other (please describe) __________________________2. What value-added products do you produce?_____________________ _____________________ _____________________3. Do you participate in any form of group sales?□ Yes □ Noa. If yes, does this group arrange for product delivery?b. Name of group _________________________________________________4. How would you describe your operation? (Check all that apply)□ I sell all my product and am not looking for new markets□ I can sell most of my product, but am looking for additional markets□ I would like <strong>to</strong> change the way that I sell my product□ Given the rising costs <strong>to</strong> deliver my product, I want <strong>to</strong> sell only <strong>to</strong> outlets within ____miles of my place.□ I would require additional season extension infrastructure in order <strong>to</strong> produce cropsyear round.□ Certified organic□ Uncertified Organic□ Certified any other label—please specify _______________________<strong>Farm</strong> Conclusions <strong>to</strong> <strong>School</strong> and Sample RecommendationsTools and Resources5. Approximately what percent of your overall sales are at: (combined must <strong>to</strong>tal 100%)a. Broker/Packing House ____________%b. <strong>School</strong>s and Institutions ____________%c. Local S<strong>to</strong>res ____________%d. Larger Regional S<strong>to</strong>res (i.e. Raley’s, Smith’s) ____________%www.farm<strong>to</strong>school.org 121
Survey of Fruit, Vegetable, and Nut Producers (Page 2 of 3)<strong>Farm</strong> <strong>to</strong> Conclusions <strong>School</strong> Sample and Tools Recommendationsand Resourcese. <strong>Farm</strong>ers Markets ____________%f. Side of the Road ____________%g. Restaurants ____________%h. Cooperatives/Group Sales ____________%i. Community Supported Agriculture ____________%j. Personal Contacts/ Friends ____________%k. Other ____________% Please Specify: _____________________________6. Do you generally have extra product that you could sell <strong>to</strong> schools and institutions?□ Yes □ No7. Would you be willing <strong>to</strong> sell your product <strong>to</strong> local schools and institutions?□ Yes □ No8. Do you have the following infrastructure <strong>to</strong> deliver your product <strong>to</strong> schools, institutionsor a central kitchen?Truck: □ Yes □ NoStaffDriver: □ Yes □ NoCold S<strong>to</strong>rage: □ Yes □ NoLiability Insurance: □ Yes □ No9. Have you ever sold any product <strong>to</strong> a local school or institution?□ Yes □ No9a. If so, what did you provide and <strong>to</strong> what institution?Product(s): ___________________________Institution Name: ________________________9b.Would you sell <strong>to</strong> institutions again?□ Yes □ No9c. If no, please describe why: (Check all that apply)□ Unable <strong>to</strong> physically deliver product□ Could not adequately process food (chop lettuce, cut carrots)□ Could not provide lowest price□ <strong>School</strong> or institutional market was <strong>to</strong>o small□ Could not produce sufficient volume of produce□ Could not adequately ensure safety/quality of product□ Inability <strong>to</strong> provide product during whole school year122 Bearing Fruit: <strong>Farm</strong> <strong>to</strong> <strong>School</strong> Evaluation Resources and Recommendations
Survey of Fruit, Vegetable, and Nut Producers (Page 3 of 3)10. Which of the following venues would you like <strong>to</strong> sell your product <strong>to</strong> but do notcurrently sell <strong>to</strong>?□ <strong>School</strong>s and Institutions□ Restaurants□ <strong>Farm</strong>ers Markets□ Side of the road□ Local s<strong>to</strong>res□ Larger Regional S<strong>to</strong>res (i.e. Raley’s, Smith’s)□ Community Supported Agriculture (CSA)□ Other _______________________________________________________11. Do you have school-age children?□ Yes □ No11a. If so, in what school district is/are your child(ren) enrolled? ___________Th e Southwest Marketing <strong>Network</strong> is a collaboration that seeks <strong>to</strong> ensure that farmers in<strong>New</strong> Mexico, Utah, Colorado and Arizona have access <strong>to</strong> the latest technical, financial andmarketing information, as well as personal contacts with successful farm marketers. Th e <strong>Network</strong>is a collaboration of <strong>Farm</strong> <strong>to</strong> Table, Western Rural Development Center, the NationalCenter for Appropriate Technology, the Navajo Nation Department of Agriculture and highereducation universities. We provide quarterly newsletters, an annual conference, and specializedtrainings.12. Do you receive the Southwest Marketing <strong>Network</strong> <strong>New</strong>sletter?□ Yes □ No13. Would you like <strong>to</strong> receive this newsletter in the future?□ Yes □ No<strong>Farm</strong> Conclusions <strong>to</strong> <strong>School</strong> and Sample RecommendationsTools and ResourcesOur goal for this survey is <strong>to</strong> receive the opinions of as many agricultural producers in thestate of <strong>New</strong> Mexico as possible. Because it is difficult <strong>to</strong> keep up-<strong>to</strong>-date lists on all the agriculturalproducers in the state we are relying on farmers such as you <strong>to</strong> aid us in capturingthe opinions of as many farmers as possible.14. Do you know of other farmers who should get this survey? Please list their contactinformation below.Adapted from “Survey of Fruit, Vegetable and Nut Producers,” Central <strong>New</strong> MexicoInstitutional Direc<strong>to</strong>ry 2007, <strong>Farm</strong> <strong>to</strong> Table, <strong>New</strong> Mexico Department of Agriculture.Available at: http://www.farm<strong>to</strong>tablenm.org/central_nm_direc<strong>to</strong>ry_oct07.pdfwww.farm<strong>to</strong>school.org 123
Survey of Institutional Food Service Providers (Page 1 of 4)<strong>Farm</strong> <strong>to</strong> Conclusions <strong>School</strong> Sample and Tools Recommendationsand ResourcesTh is is a survey <strong>to</strong> ascertain what the potential market would be if major NM institutionswere <strong>to</strong> purchase fresh agricultural products from local (<strong>New</strong> Mexico) growers.Your answers <strong>to</strong> these survey questions will be held in confidence. Only the aggregateinformation from all respondents will be published unless your permission is expresslygranted. We do plan <strong>to</strong> publish your contact information and a general list of desiredproducts. Please state if you do not want that information published.Contact InformationName of Institution:_______________________________________________________Name:__________________________________________________________________Title:___________________________________________________________________Address:________________________________________________________________City, State, Zip:___________________________________________________________Telephone:_______________________________________________________________Fax:____________________________________________________________________Email: _________________________________________________________________1. What is the size and makeup of the population that you serve?2. How many meals do you serve?3. Which meals do you serve? q Breakfast q Lunch q Dinner4. Do you serve food year round?5. Do you have a prime produce vendor?Or use several vendors?6. How often do you receive deliveries of fresh produce?7. What are your <strong>to</strong>p fresh produce purchases?Please also list the unit of purchase, the average number of units you purchase at onetime, how often you purchase, and the average cost per unit per item.Item Unit How many How often Price per unitApplesMelonsPearsCherriesPeachesBerriesPlums124 Bearing Fruit: <strong>Farm</strong> <strong>to</strong> <strong>School</strong> Evaluation Resources and Recommendations
Survey of Institutional Food Service Providers (Page 2 of 4)Item Unit How many How often Price per unitChile peppersToma<strong>to</strong>esCarrotsSweet cornGreen beansSquashHead lettuceSalad mixOnionsSpinachCucumbersOkraPumpkinsCabbagePota<strong>to</strong>esSproutsPistachiosPeanutsPecansDry Pin<strong>to</strong> beansNM organic flourOther8. Have you purchased foods from a local producer within the past year?<strong>Farm</strong> Conclusions <strong>to</strong> <strong>School</strong> and Sample RecommendationsTools and Resources□ Yes□ No9. I would purchase food directly from a local producer if price and quality werecompetitive and a source was available:□ Strongly agree □ Agree □ Disagree □ Strongly disagree □ Uncertain10. My institution would be interested in buying these foods from local producers.(Check all that apply)Fruits:□ Apples □ Melons □ Pears □ Cherries □ Peaches □ Berries □ Plumswww.farm<strong>to</strong>school.org 125
Survey of Institutional Food Service Providers (Page 3 of 4)Vegetables:<strong>Farm</strong> <strong>to</strong> Conclusions <strong>School</strong> Sample and Tools Recommendationsand Resources□ Chile Peppers □ Toma<strong>to</strong>es □ Carrots □ Sweet corn□ Green beans □ Squash □ Head lettuce □ Salad mix□ Onions □ Spinach □ Cucumbers □ Okra□ Pumpkins □ Cabbage □ Pota<strong>to</strong>es □ SproutsNuts/Beans/Grains:□ Pistachios □ Peanuts □ Pecans □ Dry pin<strong>to</strong> beans □ NM organic flour□ Other (please describe)11. Please check information that would be helpful for you in making local food purchasingdecisions. (Please check all that apply)□ Lists of suppliers and products from local sources□ Information about local food programs from around the country□ A list of when local foods are available in <strong>New</strong> Mexico (availability / seasonalitychart)□ Broker indication on order sheet of where food comes from (place of origin)□ Other (please describe)12. What concerns do you have in regard <strong>to</strong> purchasing locally produced foods?(Check all that apply)□ Adequate volume□ Reliable supply□ Payment arrangement□ Delivery considerations□ Prime vendor considerations (potential threat <strong>to</strong> existing relationships)□ Seasonal availability of <strong>New</strong> Mexico fruits and vegetables□ Cost□ Package consistency□ Quality□ Other (please describe)13. What would primarily motivate you <strong>to</strong> serve locally grown or processed foods inyour institution? (Check all that apply)126 Bearing Fruit: <strong>Farm</strong> <strong>to</strong> <strong>School</strong> Evaluation Resources and Recommendations
Survey of Institutional Food Service Providers (Page 4 of 4)□ More products available that are partially processed (carrot sticks, salad mix)□ One place <strong>to</strong> order from multiple farmers (ie, farmer cooperatives)□ Lower transportation costs□ Financial incentives for purchasing local food□ Interest from my cus<strong>to</strong>mers□ Better taste□ Longer shelf life□ Additional facilities, equipment, or staff□ Ability <strong>to</strong> purchase in small quantities, or special varieties□ Support for or pressure <strong>to</strong> buy local foods from management□ Other (please describe)14. What barriers currently prevent you from purchasing foods directly from local producers?(Check all that apply)□ Budget□ Internal purchasing policies□ I don’t know any farmers□ Lack of local producers in this area□ Lack of products available during certain times of the year□ Convenience (I prefer one-s<strong>to</strong>p shopping with my regular broker)□ Lack of staff or facilities <strong>to</strong> handle much fresh produce□ Other (please describe)15. Can we share your name and the list of what you would like <strong>to</strong> buy with local producers?□ Yes □ No<strong>Farm</strong> Conclusions <strong>to</strong> <strong>School</strong> and Sample RecommendationsTools and Resources16. If you would like <strong>to</strong> know more about <strong>New</strong> Mexico agricultural products, would youlike <strong>to</strong> sample some of these products when they are in season?□ Yes □ NoTh a nk you for taking the time <strong>to</strong> fill out this survey. Your participation is very important<strong>to</strong> us. Please place the completed survey in the enclosed envelope and return it <strong>to</strong> <strong>Farm</strong><strong>to</strong> Table, 3900 Paseo del Sol, Santa Fe, NM 87507. If you have any additional commentsregarding this survey or purchasing locally available foods, feel free <strong>to</strong> write them downhere.Adapted from “Survey of Institutional Food Service Providers,” Central <strong>New</strong> MexicoInstitutional Direc<strong>to</strong>ry 2007, <strong>Farm</strong> <strong>to</strong> Table, <strong>New</strong> Mexico Department of Agriculture.Available at: http://www.farm<strong>to</strong>tablenm.org/central_nm_direc<strong>to</strong>ry_oct07.pdfwww.farm<strong>to</strong>school.org 127
Student Knowledge Survey (Page 1 of 1)<strong>Farm</strong> <strong>to</strong> Conclusions <strong>School</strong> Sample and Tools Recommendationsand ResourcesDirections: This is a survey <strong>to</strong> find out what you know. Circle the letterthe one best answer.1. Fruits and vegetables contain vitamins and _________.a. proteinb. fiberc. cholesterold. fate. I don’t know2. Fruits and vegetables that are high in Vitamin A are ________ in color.a. red and whiteb. blue and light brownc. yellow-orange and dark greend. brown and purplee. I don’t know3. Which ONE of these foods is a healthy snack?a. Ice creamb. Pota<strong>to</strong> chipsc. Fresh fruitd. Fruit Roll-upse. I don’t know4. The healthiest juice <strong>to</strong> buy has ___________ on the label.a. 100% fruit juiceb. contains fruit juicec. 100% fruit punchd. tastes greate. I don’t know5. A fruit salad will be higher in Vitamin C if you add _____ <strong>to</strong> it.a. applesb. grapesc. bananasd. orangese. I don’t knowAdapted from “Hawthorne Unified <strong>School</strong> District Student Knowledge Survey,” availableat: http://socialmarketing-nutrition.ucdavis.edu/Tools/Downloads/Hawthorne_Unifi e d_<strong>School</strong>_District.pdf Giarratano Russell, S. 2004. Validity and Reliability of aKnowledge survey for Hawthorne Unified <strong>School</strong> District. Unpublished.128 Bearing Fruit: <strong>Farm</strong> <strong>to</strong> <strong>School</strong> Evaluation Resources and Recommendations
Outcome Expectations for Eating Fruits & Vegetables (Page 1 of 5)I. FRUITS AND VEGETABLESWe want <strong>to</strong> know what you think about fruits and vegetables. There are no righ<strong>to</strong>r wrong answers, just your opinion. Please choose the answer that best describeswhat you think.False True1. Eating fruits and vegetables protects you fromdiseases. F T2. Fruits and vegetables are high in fat and sugar. F T3. Most of the vitamin C we get comes fromfruits and vegetables. F T4. Have you visited the website called mypyramid(www.mypyramid.gov) ? No YesII. FRUITS AND VEGETABLES (IF I EAT)We want <strong>to</strong> know what you think will happen if you eat fruits and vegetablesevery day. There are no right or wrong answers, just your opinion. Please choosethe answer that best describes how much you disagree or agree with eachsentence below.If I eat fruits andvegetables every day…Idisagreevery muchIdisagree alittleI am notsureI agree alittleI agreevery much5. I will become stronger A B C D E6. My friends will starteating them <strong>to</strong>oA B C D E<strong>Farm</strong> Conclusions <strong>to</strong> <strong>School</strong> and Sample RecommendationsTools and Resources7. I will have stronger eyes A B C D E8. I will have a nicer smile A B C D E9. My friends will not come<strong>to</strong> my house <strong>to</strong> eatA B C D E10. I will be healthier A B C D E11. I will think better inclassA B C D Ewww.farm<strong>to</strong>school.org 129
Outcome Expectations for Eating Fruits & Vegetables (Page 2 of 5)<strong>Farm</strong> <strong>to</strong> Conclusions <strong>School</strong> Sample and Tools Recommendationsand ResourcesIf I eat fruits andvegetables every day…12. it will keep me fromgetting fatIdisagreevery muchIdisagree alittleI am notsureI agree alittleI agreevery muchA B C D E13. I will have more energy A B C D E14. My friends will makefun of me15. I will have less energythan if I eat a candy bar16. My family will be proudof me17. I will not enjoy eatingthat meal or snackA B C D EA B C D EA B C D EA B C D EIV. FRUITS AND VEGETABLES (I THINK)We want <strong>to</strong> know how sure you are that you can do things <strong>to</strong> eat more fruitsand vegetables. There are no right or wrong answers, just your opinion. Pleasechoose the answer that best describes how much you disagree or agree witheach sentence below.If I eat fruits and vegetablesevery day...I disagreevery muchI disagreea littleI am notsureI agree alittleI agreevery much21. I think I can write my favoritefruit or vegetable on the family’sshopping list22. I think I can ask someonein my family <strong>to</strong> buy my favoritefruit or vegetable23. I think I can go shopping withmy family for my favorite fruit orvegetableA B C D EA B C D EA B C D E130 Bearing Fruit: <strong>Farm</strong> <strong>to</strong> <strong>School</strong> Evaluation Resources and Recommendations
Outcome Expectations for Eating Fruits & Vegetables (Page 3 of 5)If I eat fruits and vegetablesevery day...24. I think I can pick out myfavorite fruit or vegetable at thes<strong>to</strong>re and put it in the shoppingbasket25. I think I can ask someone inmy family <strong>to</strong> make my favoritevegetable dish for dinner26. I think I can ask someone inmy family <strong>to</strong> serve my favoritefruit at dinner27. I think I can ask someonein my family <strong>to</strong> have fruits andfruit juices out where I can reachthem28. I think I can ask someone in myfamily <strong>to</strong> have cut up vegetablesout where I can reach themI disagreevery muchI disagreea littleI am notsureI agree alittleI agreevery muchA B C D EA B C D EA B C D EA B C D EA B C D EV. PHYSICAL ACTIVITYWe want <strong>to</strong> know what you think about physical activity. Remember that physicalactivity can be any play, game, sport, or exercise that gets you moving andbreathing harder. There is no right or wrong answer, just your opinion.<strong>Farm</strong> Conclusions <strong>to</strong> <strong>School</strong> and Sample RecommendationsTools and Resources29. Moderate physical activity makes youbreathe hard and sweat (Example: running).F T30. How many minutes of physical activity do you think elementaryschool students should get each day <strong>to</strong> be healthy?A. At least 15 minutes each dayB. At least 30 minutes each dayC. At least 60 minutes each dayD. At least 90 minutes each dayE. Don’t knowwww.farm<strong>to</strong>school.org 131
Outcome Expectations for Eating Fruits & Vegetables (Page 4 of 5)<strong>Farm</strong> <strong>to</strong> Conclusions <strong>School</strong> Sample and Tools Recommendationsand Resources31. Why is physical activity good for kids?A. Helps keep you from getting sickB. Helps you pay attention in schoolC. Builds healthy bones and muscles <strong>to</strong> keep you strongD. Gives you more energyE. All of the above32. Which of the following choices does not count as physical activity?A. Taking a dog on a walkB. Shooting a basketballC. Playing a board game (Example: Monopoly)D. Playing tag at the park with a friendE. Going on a bike rideVI. PHYSICAL ACTIVITY (I THINK)Please choose either “No” or “Yes” for each of the sentences below. “No” meansthat you do not agree with the sentence. “Yes” means that you agree with thesentence. Remember that physical activity can be any play, game, sport, orexercise that gets you moving and breathing harder.33. I think I can be physically active most days afterschool34. I think I can ask my parent or other adult <strong>to</strong> dophysically active things with me35. I think I can ask my parent or other adult <strong>to</strong> signme up for a sport, dance, or other physical activity36. I think I can be physically active even if it is veryhot or cold outside37. I think I can ask my best friend <strong>to</strong> be physicallyactive with me38. I think I can ask my parent or other adult <strong>to</strong> getme the equipment I need <strong>to</strong> be physically active39. I think I can ask my parent or other adult <strong>to</strong> takeme <strong>to</strong> a physical activity or sport practice40. I think I can be physically active even if I have alot of homework41. I think I have the skills I need <strong>to</strong> be physicallyactiveNNNNNNNNNYYYYYYYYY132 Bearing Fruit: <strong>Farm</strong> <strong>to</strong> <strong>School</strong> Evaluation Resources and Recommendations
Outcome Expectations for Eating Fruits & Vegetables (Page 5 of 5)42. I think I can be physically active no matter howbusy my day isN Y43. I think I can be physically active no matter howtired I may feelN Y44. I am physically active N YVII. PHYSICAL ACTIVITY (IT WOULD)Please circle your answer.If I were <strong>to</strong> be physically active most days…45. it would make me get hurt N Y46. it would help me be healthy N Y47. it would help me control my weight N Y48. it would make me tired N Y49. it would give me energy N Y50. it would make me embarrassed in fron<strong>to</strong>f othersN Y51. it would be fun N Y52. it would get or keep me in shape N Y53. it would be boring N Y54. it would make me better in sports N Y<strong>Farm</strong> Conclusions <strong>to</strong> <strong>School</strong> and Sample RecommendationsTools and ResourcesAdapted from “Outcome Expectations for Eating Fruits and Vegetables,” Five a Day Power Play! Surveyavailable at: http://socialmarketing-nutrition.ucdavis.edu/Tools/SomarkToolsList.php?key_m=16Baranowski T, Davis M, Resnicow K, Baranowski J, Doyle C, Smith M, Lin L, Wang DT. Gimme 5 fruit andvegetables for fun and health: Outcome Evaluation. Health Education & Behavior 2000; 27(1):96-111.California Nutrition <strong>Network</strong>. (2005) Five a Day Power Play! Pre-Post Impact Survey. Unpublished.Saunders, R. P., Pate, R., Fel<strong>to</strong>n, G., Dowda, M., Weinrich, M., Ward, D., Parsons,M., & Baranowski, T. Development of questionnaires <strong>to</strong> measure psychosocialinfluences on children’s physical activity. Preventive Med 1997; 26, 241-247.www.farm<strong>to</strong>school.org 133
General Knowledge of Healthy Eating (Page 1 of 1)<strong>Farm</strong> <strong>to</strong> Conclusions <strong>School</strong> Sample and Tools Recommendationsand ResourcesWe want you <strong>to</strong> tell us what you know about healthful eating.Please check your answer1. What you eat can make a difference in your chances of getting heart disease orcancer.1 True2 False3 Don’t know2. People who are overweight or underweight are more likely <strong>to</strong> have healthproblems than people of normal weight.1 True2 False3 Don’t know3. People who are underweight are more likely <strong>to</strong> have health problems than peoplewho are who not underweight.1 True2 False3 Don’t know4. Which of these would be the best example of a SHORT-TERM Goal <strong>to</strong> help youbegin <strong>to</strong> eat more fruits and vegetables?1 Eat fruit or drink juice every day for breakfast and lunch2 Try <strong>to</strong> eat more fruits and vegetables3 Drink juice at breakfast 3 days this week4 Don’t know5. Which of these would be the LOWEST Fat sandwich choice?1 Cheeseburger2 Tuna salad sandwich with mayonnaise3 Plain grilled chicken breast sandwich4 Don’t know6. Which of these would be the best way <strong>to</strong> add a fruit or vegetable <strong>to</strong> your meal at afast food restaurant?1 Add a <strong>to</strong>ma<strong>to</strong> slice <strong>to</strong> your hamburger2 Order apple pie for dessert3 Order a large serving of French fries4 Order a side of salad5 Don’t know7. Which of these is the HEALTHIEST way <strong>to</strong> eat pota<strong>to</strong>es?1 Pota<strong>to</strong> salad2 French fries3 Baked pota<strong>to</strong> without <strong>to</strong>ppings like butter4 Don’t knowAdapted from “General Knowledge,” available at:http://socialmarketing-nutrition.ucdavis.edu/Tools/Downloads/General_Knowledge.pdfHoelscher D, Day RS, Lee ES, Frankowski RF, Kelder SH, Ward JL, Scheurer ME. Measuring the pr<strong>eval</strong>enceof overweight in Texas school children. American Journal of Public Health 2004; 94: 1002-1008.Reynolds K, Yaroch A, et al. Testing mediating variables in a school-basednutrition intervention program. Health Psychol 2002; 21(1): 51-60.134 Bearing Fruit: <strong>Farm</strong> <strong>to</strong> <strong>School</strong> Evaluation Resources and Recommendations
Veggie Vote Pretest (Page 1 of 1)1.) Do you like <strong>to</strong> try new foods? YES NO2.) Have you participated in Mixed Greens programs before? YES NO3.) Please use a sticker <strong>to</strong> show how you feel about each food.FoodToma<strong>to</strong>CornAmaranthApplePota<strong>to</strong>SaladSquashHaven’tTriedLiked ItSort ofLiked ItDid NotLike ItYes, Iwouldlike <strong>to</strong>taste itagainNo, Iwouldnot like<strong>to</strong> taste itagain? ☺ ☹ YES NO? ☺ ☹ YES NO? ☺ ☹ YES NO? ☺ ☹ YES NO? ☺ ☹ YES NO? ☺ ☹ YES NO? ☺ ☹ YES NO<strong>Farm</strong> Conclusions <strong>to</strong> <strong>School</strong> and Sample RecommendationsTools and ResourcesAdapted from Veggie Vote, Mixed Greens, C.S. Mott Group for Sustainable FoodSystems, Michigan State University and Spectrum Health, Fall 2007.www.farm<strong>to</strong>school.org 135
Student Dining Evaluation (Page 1 of 2)<strong>Farm</strong> <strong>to</strong> Conclusions <strong>School</strong> Sample and Tools Recommendationsand ResourcesStudents <strong>report</strong> that the environment in which meals are served is as important <strong>to</strong> themas the quality of the food. The purpose of this questionnaire is <strong>to</strong> assist adults andstudents in <strong>eval</strong>uation the dining environment at school.This form can be fi lled out by adults who want <strong>to</strong> compare different school meal settings,or by the students themselves.For each of the ten areas of eating experience listed below, please mark the box thatbest describes you assessment of this area <strong>to</strong>day. Please rate each time as Negative,(makes the eating experience less than pleasant) Neutral, (does not make eating eitherunpleasant or pleasant) or Positive (makes the eating experience much better). Pleasealso include any additional comments you may have.1. The noise level in the cafeteriaComments:2. The smells in the cafeteriaComments:3. The lighting in the cafeteriaComments:Negative Neutral Positive□ □ □□ □ □□ □ □4. The taste of the foodComments:□ □ □5. The way the meals are presentedComments:□ □ □136 Bearing Fruit: <strong>Farm</strong> <strong>to</strong> <strong>School</strong> Evaluation Resources and Recommendations
Student Dining Evaluation (Page 2 of 2)6. The amount of time allowed for eatingComments: □ □ □7. The hospitality of the people who serve the foodComments:□ □ □8. The way others who are eating make you feelComments:□ □ □9. The way the cafeteria looksComments:□ □ □<strong>Farm</strong> Conclusions <strong>to</strong> <strong>School</strong> and Sample RecommendationsTools and ResourcesAdapted from “Student Dining Evaluation Form” Th e Dining Experience, Rethinking <strong>School</strong> Lunch, developedby the Center for Ecoliteracy, in collaboration with J. Michael Murphy, Ed.D., Department of Child Psychiatry,Harvard <strong>School</strong> of Medicine Available at:http://www.ecoliteracy.org/programs/pdf/rethinking_dining.pdfwww.farm<strong>to</strong>school.org 137
Fresh From the <strong>Farm</strong> Student Survey (Page 1 of 3)<strong>Farm</strong> <strong>to</strong> Conclusions <strong>School</strong> Sample and Tools Recommendationsand ResourcesPlease answer the following questions. You do not need <strong>to</strong> write your name on this paper.Broccoli Cucumber Radish SpinachPota<strong>to</strong>es Squash Lettuce CarrotsCabbage Toma<strong>to</strong>es Apples BlueberriesPeaches Parsnips Eggplant TurnipsPearsBell Peppers1. Pick four fruits and /or vegetables from the list above that can be grown in thisregion.a)b)c)d)2. Name your favorite vegetable from the list above.3. For the favorite fruit / vegetable you picked in the previous question, can you nameanother place in the world where people eat it a lot?4. Tell us an interesting fact for the favorite fruit / vegetable you picked in Q 2.5. Name two fruits or vegetables from the list that are a good source of Vitamin C.a)b)138 Bearing Fruit: <strong>Farm</strong> <strong>to</strong> <strong>School</strong> Evaluation Resources and Recommendations
Fresh From the <strong>Farm</strong> Student Survey (Page 2 of 3)6. Name one fruit or vegetable from the list that is a good source of Iron and Calcium.7. Apples are a good source of ____________(name of nutrient).8. Not enough _______________ (name of nutrient) in your diet can lead <strong>to</strong> weakbones.9. _______________ is an important nutrient required for good vision.10. Fruits and vegetables are a good source of vitamins and _________. (check one) protein fiber cholesterol fat I don’t now11. Fruits and vegetables that are high in Vitamin A are ________ in color.(check one) red & white blue & light brown yellow-orange & dark green brown & purple I don’t know<strong>Farm</strong> Conclusions <strong>to</strong> <strong>School</strong> and Sample RecommendationsTools and Resources12. A healthy diet includes a variety of fruits and vegetables of different colors. (checkone)TrueFalsewww.farm<strong>to</strong>school.org 139
Fresh From the <strong>Farm</strong> Student Survey (Page 3 of 3)<strong>Farm</strong> <strong>to</strong> Conclusions <strong>School</strong> Sample and Tools Recommendationsand ResourcesFRUIT ORVEGETABLE13. Please fill out the chart below by circling the answer for how much you like thefollowing fruits and vegetables.I do not like thisI like this a littleI like this a lotI don’t know whatthis is?Broccoli ?Cucumbers ?Radish ?Spinach ?Pota<strong>to</strong>es ?Squash ?Lettuce ?Carrots ?Cabbage ?Toma<strong>to</strong>es ?Apples ?Blueberries ?Peaches ?Parsnips ?Eggplant ?Turnip ?Pears ?Bell Peppers ?Adapted from “Seven Generations Ahead - Fresh From the <strong>Farm</strong> Student Survey,” Joshi Aand Azuma AM, Year One Evaluation Report: Fresh from the <strong>Farm</strong> Program Implementationat Lozano Bilingual and International Center <strong>School</strong>, Chicago, Oc<strong>to</strong>ber 2006.140 Bearing Fruit: <strong>Farm</strong> <strong>to</strong> <strong>School</strong> Evaluation Resources and Recommendations
Harvest of the Month Student Evaluation (Page 1 of 4)Confidentiality information <strong>to</strong> be explained <strong>to</strong> studentsWe would like for you <strong>to</strong> complete this survey. You may skip questions you do not want <strong>to</strong> answer butwe hope that you will answer all of them. Any information about who you are will be kept secret. Wewill not share you name or identification number. They will only be used for <strong>report</strong>s.Funded by the U.S. Department of Agriculture Food Stamp Program, an equal opportunity Providerand employer, through the California Nutrition <strong>Network</strong> for Healthy, Active Families.Student identification number___________________________________We want you <strong>to</strong> tell us what you know about healthful eating.Please bubble your answer1. Eating fruits and vegetables can help decrease your chances of getting heartdisease or cancer.O TrueO FalseO Don’t know2. Fruits and vegetables that are high in Vitamin A are __________ in color.O Red and whiteO Blue and light brownO Yellow-orange and dark greenO Brown and purpleO I don’t know3. Almost all fruits and vegetables contain a lot of vitamins and ____________.O ProteinO FiberO CholesterolO FatO Don’t know4. Which of the following fruits and vegetables are grown in California:O SpinachO ApplesO PearsO All of the above5. Fruits and vegetables, like apples and pears, are best when eaten with the peelbecause that is where most of the fiber and antioxidants are.O TrueO FalseO Don’t know<strong>Farm</strong> Conclusions <strong>to</strong> <strong>School</strong> and Sample RecommendationsTools and Resourceswww.farm<strong>to</strong>school.org 141
Harvest of the Month Student Evaluation (Page 2 of 4)<strong>Farm</strong> <strong>to</strong> Conclusions <strong>School</strong> Sample and Tools Recommendationsand Resources6. How much do you like these fruits and vegetables? Please bubble your answer.I do not likethis☹I like this alittleI like thisa lot☺I don’t knowwhat this is?Acorn Squash O O O OAsparagus O O O OAvocados O O O OBeets O O O OBroccoli O O O OCabbage O O O OCarrots O O O OCherries O O O OCooked Greens O O O OCorn O O O ODried Plum O O O OGrapefruit O O O OGreen Beans O O O OMandarins (Tangerines) O O O OMelons O O O OMushrooms O O O ONectarines O O O OOnions O O O OPeas O O O OPeppers O O O OPersimmons O O O OPlums O O O OPota<strong>to</strong>es O O O OPumpkins O O O ORadishes O O O OSalad Greens O O O OSpinach O O O OSweet Pota<strong>to</strong>es O O O OToma<strong>to</strong>es O O O OZucchini O O O O142 Bearing Fruit: <strong>Farm</strong> <strong>to</strong> <strong>School</strong> Evaluation Resources and Recommendations
Harvest of the Month Student Evaluation (Page 3 of 4)7. For breakfast, I think Ican…A. drink a glass of my favoritejuicePlease bubble your answer.I disagreevery muchI disagreea littleI amnotsureI agreea littleI agreeverymuchO O O O OB. add fruit <strong>to</strong> my cereal O O O O O8. For lunch at school, I thinkI can…I disagreevery muchI disagreea littleI amnotsureI agreea littleI agreeverymuchA. eat a vegetable that’sservedO O O O OB. eat a fruit that’s served O O O O O9. For lunch at home I thinkI can…A. eat carrot or celery sticksinstead of chipsB. eat my favorite fruitinstead of my usual dessert10. For a snack I think I canchoose…A. my favorite fruit insteadof my favorite cookieB. my favorite fruits insteadof my favorite candy barI disagreevery muchI disagreea littleI amnotsureI agreea littleI agreeverymuchO O O O OO O O OI disagreevery muchI disagreea littleI amnotsureI agreea littleOI agreeverymuchO O O O OO O O O O<strong>Farm</strong> Conclusions <strong>to</strong> <strong>School</strong> and Sample RecommendationsTools and ResourcesC. my favorite raw vegetableinstead of my favorite cookie O O O O OD. my favorite raw vegetableinstead of my favorite candybarE. my favorite raw vegetableinstead of chipsO O O O OO O O O O11. For dinner I think I can… I disagreevery muchI disagreea littleI amnotsureI agreea littleI agreeverymuchA. eat a serving of vegetables O O O O OB. eat my favorite fruitinstead of my usual dessertO O O O Owww.farm<strong>to</strong>school.org 143
Harvest of the Month Student Evaluation (Page 4 of 4)<strong>Farm</strong> <strong>to</strong> Conclusions <strong>School</strong> Sample and Tools Recommendationsand ResourcesI amI disagree I disagreeI agree I agreenotvery much a littlea little very much11. For dinner I think I can…sureA. eat a serving of vegetables O O O O OB. eat my favorite fruit insteadof my usual dessertO O O O ODuring the past 24 hours (yesterday), how many times did you…(please circle the number of times)12. Drink 100% fruit juices, suchas orange, apple or grape? 0 1 2 3 4 5 or more13. Eat fruit? (Do not count fruitjuice.) 0 1 2 3 4 5 or more14. Eat vegetables? (Include saladsand non-fried pota<strong>to</strong>es.) 0 1 2 3 4 5 or more15. How old are you? _____________Years16. Are you O BoyO Girl17. How do you describe yourself? (You may fill-out more than one)O Latino, HispanicO Black, African AmericanO WhiteO American Indian, Alaskan NativeO Asian, Pacific IslanderO OtherAdapted from “Harvest of the Month Survey,” available athttp://www.cdph.ca.gov/programs/CPNS/Documents/<strong>Network</strong>-Compendium.pdfCullen K, Baranowski T, et al. Availability, accessibility, and preferences for fruit, 100% fruit juice,and vegetables influence children’s dietary behavior. Health Educ Behav 2003; 30(5): 615-26.Baranowski T, Davis M, Resnicow K, Baranowski J, Doyle C, Smith M, Lin L, Wang DT. Gimme 5 fruit andvegetables for fun and health: Outcome Evaluation. Health Education & Behavior 2000; 27(1):96-111.144 Bearing Fruit: <strong>Farm</strong> <strong>to</strong> <strong>School</strong> Evaluation Resources and Recommendations
Food Preference Survey (Page 1 of 1)How much do you like these fruits and vegetables? Please bubble your answer I do not like this I like this a little I like this a lot I don’t knowwhat this isAcorn Squash…………. O O O OAsparagus…………….. O O O OAvocados…………….. O O O OBeets…………………. O O O OBroccoli………………. O O O OCabbage………………. O O O OCarrots………………. O O O OCherries………………. O O O OCooked Greens……… O O O OCorn…………………. O O O ODried Plum…………… O O O OGrapefruit……………… O O O OGreen Beans…………… O O O OMandarins (Tangerines) O O O OMelons………………. O O O OMushrooms…………… O O O ONectarines…………… O O O OOnions…………………. O O O OPeas………………….. O O O OPeppers……………… O O O OPersimmons…………… O O O OPlums…………………. O O O OPota<strong>to</strong>es……………… O O O OPumpkins……………… O O O ORadishes……………… O O O OSalad Greens………… O O O OSpinach……………… O O O OSweet Pota<strong>to</strong>es………… O O O OToma<strong>to</strong>es……………… O O O OZucchini……………… O O O O<strong>Farm</strong> Conclusions <strong>to</strong> <strong>School</strong> and Sample RecommendationsTools and ResourcesAdapted from “Food Preference Survey,” available in English and Spanish at:http://socialmarketing-nutrition.ucdavis.edu/Tools/Downloads/preferences_only_9_14.pdfCullen K, Baranowski T, et al. Availability, accessibility, and preferences for fruit, 100% fruit juice,and vegetables influence children’s dietary behavior. Health Educ Behav 2003; 30(5): 615-26.Domel, S. B., T. Baranowski, et al. (1993). “Measuring fruit and vegetable preferencesamong 4th- and 5th-grade students.” Prev Med 22(6): 866-79.Baxter, S. D. and W. O. Thompson (2002). “Fourth-grade children’s consumption of fruit and vegetable itemsavailable as part of school lunches is closely related <strong>to</strong> preferences.” J Nutr Educ Behav 34(3): 166-71.www.farm<strong>to</strong>school.org 145
Student Survey (Page 1 of 5)<strong>Farm</strong> <strong>to</strong> Conclusions <strong>School</strong> Sample and Tools Recommendationsand ResourcesDear Student,Tha nk you for taking the time <strong>to</strong> fill out this survey. Your responses will be used <strong>to</strong>make the school meals even better!1. Wha t school do you go <strong>to</strong>?______________ ____________________Questions About Breakfast2. Do you eat breakfast at home? ___Yes ___No (If no, go <strong>to</strong> question 4)3. How often do you eat breakfast at home?__ Always __Almost always __Sometimes __Never4. Do you eat breakfast at school? ___Yes ___No (If no, go <strong>to</strong> question 11)5. How often do you eat breakfast at school?__ Always __Almost always __Sometimes __Never6. Do you eat breakfast at school more this year than last year?__Yes__No7. If you eat breakfast at school more this year, for what reasons? Please check all theanswers that apply <strong>to</strong> you.___Breakfast is served in the classroom___I like what is served for breakfast___I don’t eat breakfast at home___Hungry more often___Other (please explain)__________________________________I don’t eat breakfast at school more this year8. If you eat breakfast at school less this year, for what reasons? Please check all theanswers that apply <strong>to</strong> you.___I eat at home___I am not hungry___I don’t like what is served for breakfast while at school___I don’t want <strong>to</strong> eat breakfast in the morning___Other (please explain)__________________________________I don’t eat breakfast at school less this year9. What is your favorite breakfast food served in the school cafeteria?146 Bearing Fruit: <strong>Farm</strong> <strong>to</strong> <strong>School</strong> Evaluation Resources and Recommendations
Student Survey (Page 2 of 5)10. Please name up <strong>to</strong> 3 healthy foods you would like offered for breakfast at school.1.2.3.Questions About Lunch11. If you bring lunch from home, please name the <strong>to</strong>p three foods that you usually bring.1.2.3.__Do not bring lunch from home12. How often do you eat lunch offered in the school cafeteria?__ Always __Almost always __Sometimes __Never13. In this past school year, what changes do you like in the food offered for schoollunch?14. In this past school year, what changes do you not like in the food offered for schoollun ch?15. If you don’t always eat lunch at school, please check your <strong>to</strong>p 3 reasons why.___I bring lunch from home___I am not hungry___I never eat lunch___My lunch time is <strong>to</strong>o early in the day___I don’t like what is served in the school cafeteria___I don’t like the food that I bring from home___There is not food <strong>to</strong> bring for lunch from home___<strong>School</strong> lunch costs a lot of money___I forgot my lunch money___I don’t have enough time <strong>to</strong> eat during lunch___People tease me about the food that I eat at lunch___Other (please explain)_______________________________<strong>Farm</strong> Conclusions <strong>to</strong> <strong>School</strong> and Sample RecommendationsTools and Resourceswww.farm<strong>to</strong>school.org 147
Student Survey (Page 3 of 5)<strong>Farm</strong> <strong>to</strong> Conclusions <strong>School</strong> Sample and Tools Recommendationsand ResourcesQUESTIONS 16-22 ARE FOR 7 TH GRADERS ONLY.16. In the past year, have you eaten food from a school lunch taste test?__Yes __No ___I don’t know (if no, go <strong>to</strong> question 23)17. Were any of the foods that you tried new <strong>to</strong> you?__Yes __No ___I don’t know18. If yes, now that you tried new food at a school lunch taste test, are you more willing<strong>to</strong> try new foods in other places such as at home or in a restaurant? __Yes__No ___I don’t know19. For what reasons do you like <strong>to</strong> try new foods?20. What was your favorite food that was taste tested in the school cafeteria?21. What was your least favorite food that was taste tested in the school cafeteria?22. What was your favorite food from a taste test food that is now served in the schoolcafeteria for breakfast or lunch?Questions About Cooking Food23. Have you cooked food or helped someone else cook before?__Yes __No (if no, go <strong>to</strong> question #26)24. If yes, where have you cooked food? Please check all the answers that apply <strong>to</strong> you.___<strong>School</strong> classroom___<strong>School</strong> kitchen___At home___A friend’s house___Relative’s house___During an after school program___During a summer program___Other (please explain):25. What did you cook?148 Bearing Fruit: <strong>Farm</strong> <strong>to</strong> <strong>School</strong> Evaluation Resources and Recommendations
Student Survey (Page 4 of 5)Questions About Gardening and <strong>Farm</strong>s26. Have you ever grown food in a garden?__Yes __No ( if no, skip <strong>to</strong> question #30)27. Where did you garden? Please check all the answers that apply <strong>to</strong> you.___At home___At school___A friend’s house___A relative’s house___During an after school program___During a summer program___Other: (please explain):28. Did you eat any of the food that you grew in the garden?___Yes ___No ___I don’t remember29. Name up <strong>to</strong> 3 foods you grew that you liked <strong>to</strong> eat:1.2.3.30. Have you ever been <strong>to</strong> a farm?__Yes __No31. If yes, which farm or farms you have visited:32. For what reasons do you think farms are important?33. Does some of the food served in your school cafeteria come from Vermont farms?__Yes __No ___I don’t know<strong>Farm</strong> Conclusions <strong>to</strong> <strong>School</strong> and Sample RecommendationsTools and Resources34. If yes, please name some of these foods?Questions About Food and Healthy Eating35. Where do you learn about food and healthy eating? Please check all the answers thatapply <strong>to</strong> you.___Another family member (aunt,___As part of a classroom lesson___My coach___In the school cafeteria or kitchen___Friends___A school cafeteria worker___Online/the Internet___As part of an after school program___Magazines___As part of a summer program___Books___A doc<strong>to</strong>r or nurse___Television___At a friend’s house___Other (please explain):___My parents___My brother or sister___Another family member (aunt, uncle, grandparents, etc)www.farm<strong>to</strong>school.org 149
Student Survey (Page 5 of 5)<strong>Farm</strong> <strong>to</strong> Conclusions <strong>School</strong> Sample and Tools Recommendationsand Resources36. How often do you eat the following foods, compared <strong>to</strong> last year? Please circle the answer.Eat fruitMore often Less often Same Don’t knowEat vegetables More often Less often Same Don’t knowEat food grown locally More often Less often Same Don’t knowEat fresh fruits and vegetables (notfrom a can or frozen)More often Less often Same Don’t knowEat organic foodMore often Less often Same Don’t knowEat fast food like McDonald’s More often Less often Same Don’t knowEat new kinds of foods More often Less often Same Don’t knowEat healthy snacks More often Less often Same Don’t knowEat sweets or dessertsMore often Less often Same Don’t know37. How often do you do the following, compared <strong>to</strong> last year? Please circle the answer.Help my family make healthy foodchoicesMore often Less often Same Don’t knowHelp my family with groceryshoppingMore often Less often Same Don’t knowQuestions About Yourself38. What grade are you in: ___4 th grade ___7 th grade39. Are you a: ___Boy ___ Girl40. How do you describe yourself:___White___Black/African American___Asian/Pacific Islander___Hispanic/Latino/Latina___Native American___Biracial/multiracial___ Other (please explain):That was our last question. Thank you for completing our survey! Please give yourcompleted survey <strong>to</strong> your teacher.Adapted from “BSFP Evaluation Report FY III,” Evaluation Services,Center for Rural Studies, University of Vermont150 Bearing Fruit: <strong>Farm</strong> <strong>to</strong> <strong>School</strong> Evaluation Resources and Recommendations
Student Interview Pro<strong>to</strong>col (Page 1 of 1)[BEFORE: You may want <strong>to</strong> conduct these interviews within focus groups inparticipating schools] Describe concept of a salad bar What foods would you like <strong>to</strong> see on the salad bar? What foods would you NOT want <strong>to</strong> see? Is there anything about the salad bar that would make you excited about trying it out?[AFTER: Focus groups with kids that have participated] What do you like best about the salad bar? What foods do you especially like? [Probe re: taste, quality, presentation] What don’t you like about the salad bar? [Probe re: time spent in line,] What foods don’t you like? [Probe re: taste, quality, cultural differences, newness,presentation] How could we improve the salad bar for you? Do the vegetables in the salad bar remind you of anything in your school garden?[Probe for connections between garden and salad bar][AFTER: Focus groups with kids who have not participated] Have you seen or heard about the salad bar? Have you thought about trying it out? Why/ why not? How could we improve the salad bar?Indica<strong>to</strong>rs <strong>to</strong> gather Participation rates in school lunch before and after salad bar Participation rates broken down by free/reduced/paid<strong>Farm</strong> Conclusions <strong>to</strong> <strong>School</strong> and Sample RecommendationsTools and ResourcesAdapted from “Bi-annual Interview Pro<strong>to</strong>col - Students,” UC SAREPwww.farm<strong>to</strong>school.org 151
Self Efficacy Survey - Eating Fruits and Vegetables (Page 1 of 1)<strong>Farm</strong> <strong>to</strong> Conclusions <strong>School</strong> Sample and Tools Recommendationsand ResourcesSelf-Efficacy Survey - Eating FVs (Baranowski et al.)How sure are you that you can:Please check your answer1. For breakfast, I think I can…A. drink a glass of my favorite juiceB. add fruit <strong>to</strong> my cereal2. For lunch at school, I think I can…I disagreeverymuchI disagreea littleI am notsureI agree alittleI agreevery much1 2 3 4 5 1 2 3 4 5 I disagreeverymuchI disagreea littleI am notsureI agree alittleI agreevery muchA. eat a vegetable that’s served 1 2 3 4 5 B. eat a fruit that’s served 1 2 3 4 5 I disagree I disagree I am not I agree a3. For lunch at home I think I can…verymucha little sure littleI agreevery muchA. Eat carrot or celery sticks instead of chips 1 2 3 4 5 B. Eat my favorite fruit instead of my usualdessert1 2 3 4 5 4. For a snack I think I can choose…I disagree I disagreevery much a littleI am notsureI agree alittleI agreevery muchA. my favorite fruit instead of my favoritecookie1 2 3 4 5 B. my favorite fruit instead of my favoritecandy bar1 2 3 4 5 C. my favorite raw vegetable with dip insteadof my favorite cookie1 2 3 4 5 D. my favorite raw vegetable with dip insteadof my favorite candy bar1 2 3 4 5 E. my favorite raw vegetable with dip insteadof chips1 2 3 4 5 5. For dinner I think I can….I disagree I disagree I am not I agree avery much a little sure littleA. eat a big serving of vegetables 1 2 3 4 5 B. eat my favorite fruit instead of my usualdessert1 2 3 4 5 I agreevery much6. I think I can…I disagree I disagree I am not I agree avery much a little sure littleA. eat at least 2 cups of fruit and juice each day 1 2 3 4 5 B. eat at least 2½ cups of vegetables each day 1 2 3 4 5 C. eat at least 4½ cups of fruits and vegetableseach dayI agreevery much1 2 3 4 5 Adapted from Self-Efficacy Survey: Eating, Fruits and Vegetables available athttp://socialmarketing-nutrition.ucdavis.edu/Tools/Downloads/self_effic_fruitveg.pdfBaranowski T, Davis M, Resnicow K, Baranowski J, Doyle C, Smith M, Lin L, Wang DT. Gimme 5 fruit andvegetables for fun and health: Outcome Evaluation. Health Education & Behavior 2000; 27(1):96-111.152 Bearing Fruit: <strong>Farm</strong> <strong>to</strong> <strong>School</strong> Evaluation Resources and Recommendations
Eating, Asking, Preparing Fruits and Vegetables (Page 1 of 1)Self-Efficacy Survey – Eating, Asking, Preparing FVs (Reynolds et al.)How sure are you that you can: Please check your answerNot Sure Sure Very sure1. eat fruits I like (such as bananas or raisins) at breakfast1 2 3 2. eat vegetables I like (such as green peppers or <strong>to</strong>ma<strong>to</strong>es)at breakfast3. drink a glass of my favorite juice (such as orange juiceor apple juice) with my breakfast4. eat fruits I like (such as applesauce or fruit cocktail) atlunch5. eat vegetables I like (such as salad or a plain bakedpota<strong>to</strong>) at lunch6. drink a glass of my favorite juice (such as grape juice orV-8 juice) with my lunch7. eat fruits I like (such as apples or oranges) for dessert atdinner8. eat vegetables I like (such as corn or beans) at dinner9. drink a glass of my favorite juice (such as <strong>to</strong>ma<strong>to</strong> juiceor orange juice) with my dinner10. snack on fruits I like (such as grapes or bananas) insteadof on foods like cake or cookies11. snack on vegetables I like (such as carrot or celerysticks) instead of on foods like pota<strong>to</strong> or corn chips12. drink a glass of my favorite juice (such as apple juice orgrape juice) with my snack13. ask my mom or dad <strong>to</strong> buy fruit for snacks1 2 3 1 2 3 1 2 3 1 2 3 1 2 3 1 2 3 1 2 3 1 2 3 1 2 3 1 2 3 1 2 3 1 2 3 14. ask my mom or dad <strong>to</strong> fix my favorite vegetable dishesat dinner1 2 3 15. ask my mom or dad <strong>to</strong> keep 100% juice in therefrigera<strong>to</strong>r1 2 3 16. help my mom or dad fix a fruit or vegetable snack 1 2 3 17. cook a vegetable (like corn-on-the-cob) for dinner1 2 3 19. eat at least 4½ cups of fruit and vegetables each day20. eat at least 2 cups of fruit and juice each day1 2 3 1 2 3 21. eat at least 2½ cups of vegetables each day 1 2 3 <strong>Farm</strong> Conclusions <strong>to</strong> <strong>School</strong> and Sample RecommendationsTools and ResourcesAdapted from Self-Efficacy Survey: Eating, Asking, Preparing Fruits and Vegetables available athttp://socialmarketing-nutrition.ucdavis.edu/Tools/Downloads/Self_efficacy_survey_Reynolds.pdfReynolds K, Yaroch A, et al. Testing mediating variables in a school-basednutrition intervention program. Health Psychol 2002; 21(1): 51-60.www.farm<strong>to</strong>school.org 153
Diet His<strong>to</strong>ry Questionnaire (Page 1 of 1)<strong>Farm</strong> <strong>to</strong> Conclusions <strong>School</strong> Sample and Tools Recommendationsand Resources(Information about the <strong>to</strong>ol is provided here for reference. Sample <strong>to</strong>ol availablein English and Spanish at http://riskfac<strong>to</strong>r.cancer.gov/DHQ/)The Diet His<strong>to</strong>ry Questionnaire (DHQ) is a food frequency questionnaire(FFQ) developed by staff at the Risk Fac<strong>to</strong>r Moni<strong>to</strong>ring and Methods Branch(RFMMB) of the National Cancer Institute (NCI). This FFQ consists of 124food items and includes both portion size and dietary supplement questions. Ittakes about 1 hour <strong>to</strong> complete and was designed, based on cognitive researchfi ndings, <strong>to</strong> be easy <strong>to</strong> use.Data show that the DHQ provides reasonable nutrient estimates, and the<strong>to</strong>ol has been validated. The DHQ is available in a variety of file formats,each designed for a specifi c method of capturing the data from paper-basedforms. Review the options below and determine the method that you will use<strong>to</strong> capture the data before downloading and printing copies for distribution.The DHQ and other required files are available on each method’s page. As ofAugust 2005, a web-based version of the DHQ is also available as an optionfor capturing data. The <strong>to</strong>ol is available in both English and Spanish.DHQ data s<strong>to</strong>red in an ASCII text fi le can be analyzed using theDiet*Calcsoftware. Please be aware that although Diet*Calc is available at nocost, there may be costs associated with printing the forms and with scanningor entering the data. There are 3 methods for capturing survey data -- scanning,data entry, and computer-assisted interviews. To date, scanning hasproven <strong>to</strong> be the most effective method for DHQ. The NCI website(http://riskfac<strong>to</strong>r.cancer.gov/DHQ/) provides additional information on thecosts associated with this <strong>to</strong>ol as well as a sample survey.NCI also suggests that users may be able <strong>to</strong> reduce costs by sharing informationand resources with other users. join the DHQ LISTSERV mailing list(https://list.nih.gov/archives/dhq-l.html).Adapted from “Diet His<strong>to</strong>ry Questionnaire,” National Cancer Institute.Available at: http://riskfac<strong>to</strong>r.cancer.gov/DHQ/.154 Bearing Fruit: <strong>Farm</strong> <strong>to</strong> <strong>School</strong> Evaluation Resources and Recommendations
24 Hour Diet Recall (Page 1 of 1)Th e purpose of the 24 Hour Dietary Recall is <strong>to</strong> estimate the types of food and drinka participant consumes in a typical day, the method of preparation, the amount eaten,and the approximate time the food or drink was consumed.Please be as specific and honest as possible for review with the Registered Dietitian.Th ank you.Day 1Food Item Serving Size Time Consumed WhereDay 2Food Item Serving Size Time Consumed WhereDay 3Food Item Serving Size Time Consumed Where<strong>Farm</strong> Conclusions <strong>to</strong> <strong>School</strong> and Sample RecommendationsTools and ResourcesAdapted from “24 Hour Diet Recall,” Dearborn County Hospital. Availableat: www.dch.org/eventseduc/24%20Hour%20Diet%20Recall.docwww.farm<strong>to</strong>school.org 155
Estimating Fruit & Vegetable Consumption by Students (Page 1 of 1)<strong>Farm</strong> <strong>to</strong> Conclusions <strong>School</strong> Sample and Tools Recommendationsand ResourcesMethodology:<strong>School</strong> cafeteria “Daily production records” or “daily menu production worksheets” arethe form on which food service kitchen staff record the amounts of specific foods servedat the beginning and end of the lunch meal everyday. The difference between these twofigures indicates the amount of food within each category that children <strong>to</strong>ok off the lunchline, in other words, how much was served <strong>to</strong> students that day. These records do notaccount for how much students actually ate off their plates, which will require furtherplate waste studies.The USDA <strong>School</strong> Meals Initiative for Healthy Children is based on Food Based Menus.With Food Based Menus, foods from specific food groups and in specific quantities mustbe offered. The minimum USDA requirement in the meal component ofVegetables/Fruits for grades K-6 is two or more servings of vegetables and/or fruits,which is equivalent <strong>to</strong> 3/4 cup per child per day plus 1/2 cup extra over a week.Calculate the fruit and vegetable amount taken by students by recording the beginningand end amounts on the production records. This figure is calculated on ¼ cup servings.Total the number of ¼ cup servings for each day, and divide by 3 <strong>to</strong> obtain the number of3/4 th cup servings. Sum the 3/4 th cup servings for the entire month, and divide by <strong>to</strong>talnumber of meals served for a percentage of the 3/4 th cup servings per meal. Divide thisby the number of students consuming meals <strong>to</strong> obtain the servings/meal or student /day(A).Assuming that students consume what they take on their lunch trays, (A) can be used as aproxy for consumption. It may also be necessary <strong>to</strong> calculate this data over selectedmonths during the year <strong>to</strong> account for seasonal differences.Adapted from “Estimation of Fruit and Vegetable Consumption by Students Based on Analysisof <strong>School</strong> Food Service Production Records” Final Evaluation Report, Comp<strong>to</strong>n <strong>Farm</strong> <strong>to</strong> <strong>School</strong>Demonstration Project, Feenstra and Ohmart, UC SAREP, July 1, 2004 - June 30, 2005.156 Bearing Fruit: <strong>Farm</strong> <strong>to</strong> <strong>School</strong> Evaluation Resources and Recommendations
Food Recognition Form (Page 1 of 3)Food Recognition Form (Cullen)Directions: Mark each food you ate at lunch, supper and snacks for the last 24hours. Drinks and breakfast are on the back of this sheet.LUNCH SUPPER SNACKSLUNCH SUPPER SNACKS Buy□ Buy O Buy Buy Take□ Take O Take TakeProtein FoodsBeef, Pork, Ham Chicken, Fish Pizza Lasagna Spaghetti and Meat sauce Tacos, Enchiladas Tuna fish, Cheese, Egg Hamburger, Hot dog Peanut butter sandwich Lunch meat, bologna Beans, black-eyed peas Other_____________ Breads & GrainsNoodles, macaroni, rice Biscuits, cornbread Bread, buns Tortillas VegetablesCorn Mixed Vegetables Green Beans Broccoli Peas Carrots Toma<strong>to</strong>es Celery Lettuce, <strong>to</strong>ssed salad Squash, Zucchini French fries, tater <strong>to</strong>ts Pota<strong>to</strong>es: mashed, baked Spinach Other_____________ <strong>Farm</strong> Conclusions <strong>to</strong> <strong>School</strong> and Sample RecommendationsTools and Resourceswww.farm<strong>to</strong>school.org 157
Food Recognition Form (Page 2 of 3)<strong>Farm</strong> <strong>to</strong> Conclusions <strong>School</strong> Sample and Tools Recommendationsand ResourcesFruitsChipsApples, applesauce Bananas Berries or cherries Grapes Oranges or grapefruit Peaches Melon Pears Kiwifruit, mango Raisins Other_____________ Pota<strong>to</strong> Chips, corn chips Nachos, Nuts Pretzels, Popcorn, Crackers Other_____________ Sweets & DessertsCookies, Granola Bar Cake, cupcakes, pie Donuts, sweet rolls Candy (pieces, bar) Pudding, jello Ice cream, popsicle Other____________ DrinksMilk, low-fat white or chocolateMilk, regular white or chocolateIced tea Soft drink Fruit drink, Kool-aid, drink boxFruit juice___________ Coffee Water Hot Chocolate Other_____________ 158 Bearing Fruit: <strong>Farm</strong> <strong>to</strong> <strong>School</strong> Evaluation Resources and Recommendations
Food Recognition Form (Page 3 of 3)OtherDrinksButter Margarine Jam or Jelly Sugar Salad Dressing Orange juiceApple juiceOther juiceMilk, lowfatMilk, regularCoffee, TeaOther_____________CerealsHot cereal (oatmeal, grits)Cold cereal____________BreadsToast or breadBiscuitsMuffinsDonuts, sweet rollsPoptartsFrench <strong>to</strong>astPancakesWafflesBREAKFAST<strong>Farm</strong> Conclusions <strong>to</strong> <strong>School</strong> and Sample RecommendationsTools and ResourcesProtein FoodsEggsSausageBaconCheesePeanut butterAdapted from “Food Recognition Form,” available athttp://www.cdph.ca.gov/programs/CPNS/Documents/<strong>Network</strong>-Compendium.pdfCullen K, Bartholomew L. Validity of a 1-day food recognition form <strong>to</strong> measure fruitand vegetable consumption in 9-12 year old girls. Poster Presentation: AmericanDietetic Association Food and Nutrition Conference and Expo. 2003.www.farm<strong>to</strong>school.org 159
Kids Questionnaire (Page 1 of 1)<strong>Farm</strong> <strong>to</strong> Conclusions <strong>School</strong> Sample and Tools Recommendationsand ResourcesSample questions from the Kids Questionnaire© (Block Dietary Data Systemswww.nutritionquest.com)Adapted from Sample Questions from the Kids Questionnaire, BlockDietary Data Systems, www.nutritionquest.com160 Bearing Fruit: <strong>Farm</strong> <strong>to</strong> <strong>School</strong> Evaluation Resources and Recommendations
Fruit and Vegetable Consumption Survey (YRBS) (Page 1 of 2)1.2.3.4.<strong>Farm</strong> Conclusions <strong>to</strong> <strong>School</strong> and Sample RecommendationsTools and Resourceswww.farm<strong>to</strong>school.org 161
Fruit and Vegetable Consumption Survey (YRBS) (Page 2 of 2)<strong>Farm</strong> <strong>to</strong> Conclusions <strong>School</strong> Sample and Tools Recommendationsand Resources5.6.Adapted from “Fruit and Vegetable Consumption Youth Risk Behaviour Survey (YRBS),”Centers for Disease Control available at: http://socialmarketing-nutrition.ucdavis.edu/Tools/Downloads/Fruit_and_Vegetable_Consumption_Survey.pdf162 Bearing Fruit: <strong>Farm</strong> <strong>to</strong> <strong>School</strong> Evaluation Resources and Recommendations
Teacher Focus Group Questions and Guide (Page 1 of 2)Th e Burling<strong>to</strong>n <strong>School</strong> Food Project has been working in your school district for 2 yearsand has taken on these three goals:1. Increased awareness, engagement, and consumption of local and healthyfoods by Burling<strong>to</strong>n <strong>School</strong> children2. Implementation of a Food Action Plan <strong>to</strong> increase access and use of local andhealthy foods3. Build community capacity <strong>to</strong> meet the food needs of low-income Burling<strong>to</strong>nschool district studentsTh e following are questions on what impacts you have seen as a result of this project inyour school district. All of your responses will be confidential and your answers will inno way affect your participation in the BSFP. By food, farms and nutrition education wemean a way <strong>to</strong> integrate critical issues of children’s diets and health and the impact ofnutrition on academic performance in<strong>to</strong> your existing curriculum.Students1. Since this project started working with the school district 3 years ago, whatspecific food, farm and nutrition <strong>to</strong>pics have been <strong>cover</strong>ed in your classroom?2. What changes have you seen in your students skills, knowledge and attitude<strong>to</strong>wards food, farms and nutrition education?3. What are examples of how you know students are more aware, more engaged,and consuming more healthy and local foods?Curriculum4. What changes in your curriculum have been made in food, farm and nutritioneducation?5. In what ways have you integrated food, farm and nutrition education in<strong>to</strong>your curriculum? i.e. farm <strong>to</strong>urs, ag/food related curriculum, cooking, etc.6. What are the <strong>to</strong>p three best practices that you recommend other teachers use<strong>to</strong> integrate food, farm and nutrition education?7. How have you measured the success of integrating food, farm and nutritioneducation in your curriculum and what were the results?<strong>Farm</strong> Conclusions <strong>to</strong> <strong>School</strong> and Sample RecommendationsTools and ResourcesTaste Tests8. At what level did your students participate in the school taste tests?9. How did your students respond <strong>to</strong> participating in the taste tests?www.farm<strong>to</strong>school.org 163
Teacher Focus Group Questions and Guide (Page 1 of 2)<strong>Farm</strong> <strong>to</strong> Conclusions <strong>School</strong> Sample and Tools Recommendationsand Resources10. What has been the impact of the taste test on your students? The schoolfood service? <strong>School</strong> cafeteria offerings?11. In what ways is the taste test model used in your school successful or notsuccessful for your school’s needs?12. In what ways would you recommend improving the school taste tests?Resources13. What are the key resources that you have used <strong>to</strong> integrate food, farms andnutrition education in<strong>to</strong> your classroom and curriculum?14. What other resources or professional development would be useful for futurework in this project?Larger Impact15. Since this project started working with the school district 2 years ago, whatchanges have you seen in the overall school culture <strong>to</strong>wards food, farms andnutrition education? What changes have you seen in your school and districtadministra<strong>to</strong>rs?16. How has your involvement in this project personally impacted you?17. What impacts have this project had on the larger community?Final Feedback18. What did you like most about being a partner in the Burling<strong>to</strong>n <strong>School</strong> FoodProject?19. What are ways in which the BSFP may be improved?20. Do you have any additional comments regarding the BSFP?Th ank you for taking your time <strong>to</strong> attend this focus group <strong>to</strong>day. We really appreciateall the work you have done as part of the BSFP.Adapted from “Teacher Focus Group Questions,” Schmidt M.C., Kolodinsky J, The Burling<strong>to</strong>n<strong>School</strong> Food Project, Final Evaluation Report, December 2006, Center for Rural Studies.164 Bearing Fruit: <strong>Farm</strong> <strong>to</strong> <strong>School</strong> Evaluation Resources and Recommendations
District-Wide Teacher Focus Group Guide (Page 1 of 1)Th e BSFP has been working in your school district for 3 years and has taken on thesethree goals:1. Increased awareness, engagement, and consumption of local and healthyfoods by Burling<strong>to</strong>n <strong>School</strong> children2. Implementation of a Food Action Plan <strong>to</strong> increase access and use of local andhealthy foods3. Build community capacity <strong>to</strong> meet the food needs of low-income Burling<strong>to</strong>nschool district studentsTh e following are questions on what impacts you have seen as a result of this project inyour school district.By food, farm and nutrition education we mean a way <strong>to</strong> naturally integrate critical issuesof children’s diets and health and the impact of nutrition on academic performancein<strong>to</strong> your existing curriculum.1. Since this project started working with the school district 2 years ago, whatchanges have you seen in your students skills, knowledge and attitude <strong>to</strong>wardsfood, farm and nutrition education?2. Since this project started working with the school district 2 years ago, whatchanges in your school’s curriculum have been made in food, farm and nutritioneducation? What resources have been used <strong>to</strong> make this happen?3. Since this project started working with the school district 2 years ago, whatchanges have you seen in the overall school culture <strong>to</strong>wards in food, farm andnutrition education?<strong>Farm</strong> Conclusions <strong>to</strong> <strong>School</strong> and Sample RecommendationsTools and Resources4. What impacts have you seen on the larger community as a result of this project?Th ank you for your participation in the Burling<strong>to</strong>n <strong>School</strong> Food Project and for takingthe time <strong>to</strong> complete these questionsAdapted from “District-Wide Teacher Focus Group Guide,” Schmidt M.C., Kolodinsky J, The Burling<strong>to</strong>n<strong>School</strong> Food Project, Final Evaluation Report, December 2006, Center for Rural Studies.www.farm<strong>to</strong>school.org 165
Sample <strong>School</strong> Wellness Policy (Page 1 of 4)<strong>Farm</strong> <strong>to</strong> Conclusions <strong>School</strong> Sample and Tools Recommendationsand ResourcesResponsibilitiesTh e Board of Education recognizes the important connection between a healthy dietand a student’s ability <strong>to</strong> learn effectively and achieve high standards in school. TheBoard also recognizes the school’s role, as part of the larger community, <strong>to</strong> promotefamily health, sustainable agriculture and environmental res<strong>to</strong>ration.Th e Board of Education recognizes that the sharing of food is a fundamental experiencefor all peoples; a primary way <strong>to</strong> nurture and celebrate our cultural diversity; and anexcellent bridge for building friendships, and inter-generational bonds.MissionTh e educational mission is <strong>to</strong> improve the health of the entire community by teachingstudents and families ways <strong>to</strong> establish and maintain life-long healthy eating habits. Themission shall be accomplished through nutrition education, garden experiences, thefood served in schools, and core academic content in the classroom.Goals1. Ensure that no student in Berkeley is hungry.2. Ensure that a healthy and nutritious breakfast, lunch and after school snack is available<strong>to</strong> every student at every school so that students are prepared <strong>to</strong> learn <strong>to</strong> theirfullest potential.3. Eliminate the reduced-price category for school lunch, breakfast and snacks, so thatall low-income children have healthy food available at no cost.4. Ensure that all qualified children become eligible for free meals by frequently checkingwith Alameda County Social Services.5. Ensure maximum participation in the school meal program by developing a coordinated,comprehensive outreach and promotion plan for the school meal programs.6. Shift from food-based menu planning <strong>to</strong> nutrient-based planning (as set forth underUSDA guidelines) <strong>to</strong> allow for more flexible food selection.7. Ensure that the nutritional value of the food served significantly improves upon USDADietary Guidelines by providing nutritious, fresh, tasty, locally grown food that reflectsBerkeley’s cultural diversity.8. Ensure that the food served shall be organic <strong>to</strong> the maximum extent possible, asdefined by the California Certified Organic <strong>Farm</strong>ers.9. Eliminate potential harmful food additives and processes, such as bovine growthhormones, irradiation, and genetically modified foods.166 Bearing Fruit: <strong>Farm</strong> <strong>to</strong> <strong>School</strong> Evaluation Resources and Recommendations
Sample <strong>School</strong> Wellness Policy (Page 2 of 4)10. Serve meals in a pleasant environment with sufficient time for eating, while fosteringgood manners and respect for fellow students.11. Maximize the reduction of waste by recycling, reusing, composting and purchasingrecycled products. Each school site shall have a recycling program.12. Ensure that a full service kitchen will be installed at school sites where public bondmoney is expended <strong>to</strong> repair or remodel a school.StrategiesA. Integration in<strong>to</strong> the Curriculum1. Integrate eating experiences, gardens, and nutrition education in<strong>to</strong> the curriculumfor math, science, social studies and language arts at all grade levels.2. Establish a school garden in every school. Give students the opportunity <strong>to</strong>plant, harvest, prepare, cook and eat food they have grown.3. Establish relationships with local farms. Encourage farmers and farm workers<strong>to</strong> come <strong>to</strong> the school classroom and arrange for students <strong>to</strong> visit farms.B. Student Participation1. Solicit student preferences in planning menus and snacks through annualfocus groups, surveys, and taste tests of new foods and recipes.2. Ensure that 5 students are represented on the Child Nutrition Advisory Committee.C. Waste Reduction1. Ensure that cafeterias are part of the environmental education of students andstaff through reducing waste, composting, recycling and purchasing recycledmaterial.<strong>Farm</strong> Conclusions <strong>to</strong> <strong>School</strong> and Sample RecommendationsTools and ResourcesD. Sustainable Agriculture1. Purchase food from school gardens and local farmers as a first priority, basedon availability and acceptability. Child Nutrition Services will coordinate itsmenus with school garden production and provide <strong>to</strong> garden coordina<strong>to</strong>rs a lis<strong>to</strong>f the produce it wishes <strong>to</strong> purchase.2. Work with the Alameda County Cooperative Bid (13 school districts) <strong>to</strong> increasethe amount of products purchased from local farms and organic foodsuppliers.E. Nutrition Education and Professional Development1. Provide regular professional development <strong>to</strong> enable the Food Services Staff<strong>to</strong>become full partners in providing excellent food for our students.www.farm<strong>to</strong>school.org 167
Sample <strong>School</strong> Wellness Policy (Page 3 of 4)<strong>Farm</strong> <strong>to</strong> Conclusions <strong>School</strong> Sample and Tools Recommendationsand Resources2. Provide regular training, at least annually, <strong>to</strong> teachers and the Food ServiceStaffon basic nutrition, nutrition education, and benefits of organic and sustainableagriculture.3. Provide Child Nutrition Services with USDA approved computer software,training and support <strong>to</strong> implement nutrient-based menu planning.F. Business Plan1. The Board of Education shall do a comprehensive cost/benefit analysis andbusiness plan. The plan shall include an examination of different developmentmodels of increased fresh food preparation at the central and satellite kitchens.G. Public Information1. Each year in March, Child Nutrition Services shall prepare The Direc<strong>to</strong>r’sAnnual Report for the Board of Education, which will include: a) Descriptionof the level of service for each site and level of participation; b) Profit and LossStatement for the past fiscal year; c) Outreach and Promotion Marketing Plan(with assistance from Advisory Committee) d) Budget for the future year; e)Report on the progress in meeting the food policy goals ; f) Nutritional qualityof the food being served; g) Inven<strong>to</strong>ry of equipment; h) Budget for maintenanceand replacement equipment; i) Accounting of Child Nutrition Services’ financialreserve and a budget allocating the reserve.2. The Berkeley Unifi e d <strong>School</strong> District’s Food Policy, Direc<strong>to</strong>r’s Annual Report,Monthly Menus and food policy information shall be available at District Officeand on the Board of Education’s Web site.3. A summary of the Direc<strong>to</strong>r’s Annual Report shall be distributed as part of theApril and May menus.H. Public Policy1. Advocate for label disclosure: a) Request State and Federal representativessupport legislation that will clearly label food products that have been irradiated,genetically modified or have been exposed <strong>to</strong> bovine growth hormones. b)Send a Board of Education resolution requesting support for labeling legislation<strong>to</strong>: 1. Every <strong>School</strong> Board in the State of California. 2. The State <strong>School</strong> BoardsAssociation. 3. The Nation <strong>School</strong> Boards Association.I. Establishment of a Child Nutrition Advisory Committee1. Child Nutrition Advisory Committee shall be established <strong>to</strong> discuss foodrelated<strong>to</strong>pics of concern <strong>to</strong> the school community and help make policy recommendations<strong>to</strong> the Board of Education.2. The 24 Member Child Nutrition Advisory Committee shall be as follows: a)10 Community/Parent representatives appointed by the Board of Education b)Th e Superintendent. c) Th e Direc<strong>to</strong>r of Child Nutrition Services. d) 3 Classifiedemployees appointed by their employee organization. e) 3 Teachers (elementary,168 Bearing Fruit: <strong>Farm</strong> <strong>to</strong> <strong>School</strong> Evaluation Resources and Recommendations
Sample <strong>School</strong> Wellness Policy (Page 4 of 4)middle and high school) appointed by their employee organization. f) 1 Principalappointed by their employee organization. g) 5 Students (3 middle schooland 2 high school) appointed by student government3. The Advisory Committee shall meet at least six times a year at hours convenientfor public participation.4. The Duties and Responsibilities shall be as follows: a) Present <strong>to</strong> the Board ofEducation an Annual Report in April of each year on the status of meeting thefood policy goals.Th e <strong>report</strong> shall contain:1. Review and comment on the Direc<strong>to</strong>r’s Annual Report, Profit and Loss Statement,Marketing Plan and Business Plan.2. Recommendations for improving the delivery and cost effectiveness of foodservices. b) Assist the Direc<strong>to</strong>r of Child Nutrition Service in the developmentand implementation of the Outreach and Promotion Marketing plan. c) Reviewand <strong>report</strong> by February 1 <strong>to</strong> the Board of Education on recommendations <strong>to</strong>eliminate potentially harmful food additives and processes. d) Make periodic<strong>report</strong>s, as the Advisory Committee deems necessary. e) Establish rules for decision-making.J. Maintenance and Repair of Equipment1. The Board of Education instructs the Maintenance Committee <strong>to</strong> includekitchen facilities, food preparation and s<strong>to</strong>rage of equipment as high priority inits comprehensive maintenance policy.2. Modernize computer equipment and programs, and institute an au<strong>to</strong>matedaccounting system.K. Community Use of <strong>School</strong> District Property<strong>Farm</strong> Conclusions <strong>to</strong> <strong>School</strong> and Sample RecommendationsTools and Resources1. District facilities, including school kitchens shall be available <strong>to</strong> community basedgroups for their use and enjoyment under terms established by the Board of Education.Adapted from Berkeley Unifi e d <strong>School</strong> District Wellness Policy www.schoollunchinitiative.orgwww.farm<strong>to</strong>school.org 169
Sample State Policy (Page 1 of 3)HOUSE OF REPRESENTATIVES<strong>Farm</strong> <strong>to</strong> Conclusions <strong>School</strong> Sample and Tools Recommendationsand ResourcesWednesday, February 15, 2006Committee Substitute forHouse Bill No. 2655COMMITTEE SUBSTITUTE FOR HOUSE BILL NO. 2655 — By WINCHESTER,LINDLEY and SHELTON of the House and LAWLER of the Senate.An Act relating <strong>to</strong> agriculture; creating the Oklahoma <strong>Farm</strong>-<strong>to</strong>-<strong>School</strong> Program Act;establishing the Oklahoma <strong>Farm</strong>-<strong>to</strong>-<strong>School</strong> Program; stating purpose of the Program;making the Oklahoma Department of Agriculture, Food, and Forestry the lead agency forthe Program; directing the State Department of Education <strong>to</strong> provide assistance and staffing;requiring the Oklahoma Department of Agriculture, Food, and Forestry <strong>to</strong> establishgrant guidelines; creating the Oklahoma <strong>Farm</strong>-<strong>to</strong>-<strong>School</strong> Task Force; stating purpose ofthe Task Force; providing for membership, appointment of chair, and staffing; requiring awritten <strong>report</strong>; providing for travel reimbursement; providing for codification; providingan effective date; and declaring an emergency.BE IT ENACTED BY THE PEOPLE OF THE STATE OF OKLAHOMA:SECTION 1. NEW LAW A new section of law <strong>to</strong> be codified in the Oklahoma Statutesas Section 1960 of Title 2, unless there is created a duplication in numbering, reads asfollows:This act shall be known and may be cited as the “Oklahoma <strong>Farm</strong>-<strong>to</strong>-<strong>School</strong> ProgramAct”.SECTION 2. NEW LAW A new section of law <strong>to</strong> be codified in the Oklahoma Statutesas Section 1961 of Title 2, unless there is created a duplication in numbering, reads asfollows:A. The Legislature, recognizing that school children in the state need access <strong>to</strong> fresh,tasty, and nutritious food and that farmers in the state need a market for the food theygrow, hereby establishes the Oklahoma <strong>Farm</strong>-<strong>to</strong>-<strong>School</strong> Program. The purpose of theProgram shall be <strong>to</strong>:170 Bearing Fruit: <strong>Farm</strong> <strong>to</strong> <strong>School</strong> Evaluation Resources and Recommendations
Sample State Policy (Page 2 of 3)1. Provide fresh, high-quality, locally grown foods <strong>to</strong> school cafeterias;2. Teach students about healthy eating through nutrition education and school gardens,thereby setting the stage for life-long healthy eating habits; and3. Provide Oklahoma farmers with new markets for their products.B. The Oklahoma Department of Agriculture, Food, and Forestry shall be the leadpublic agency for general administration and moni<strong>to</strong>ring of the Oklahoma <strong>Farm</strong>-<strong>to</strong>-<strong>School</strong>Program and activities related <strong>to</strong> the Program. The State Department of Education shallprovide assistance and staff support for the implementation of the Oklahoma <strong>Farm</strong>-<strong>to</strong>-<strong>School</strong> Program Act.C. The Oklahoma Department of Agriculture, Food, and Forestry shall establishguidelines for the award of grants <strong>to</strong>:1. <strong>School</strong> districts <strong>to</strong> incorporate food from local farmers on school menus and <strong>to</strong> implementnutrition education programs; and2. Local farmers <strong>to</strong> do the planning, development, and implementation of the new schoolmarket.SECTION 3. NEW LAW A new section of law <strong>to</strong> be codified in the Oklahoma Statutesas Section 1962 of Title 2, unless there is created a duplication in numbering, reads asfollows:A. There is hereby created until July 1, 2007, the Oklahoma <strong>Farm</strong>-<strong>to</strong>-<strong>School</strong> TaskForce. The purpose of the Task Force shall be <strong>to</strong> study the obstacles <strong>to</strong> the operationof the Oklahoma <strong>Farm</strong>-<strong>to</strong>-<strong>School</strong> Program and make recommendations <strong>to</strong> address theproblems and issues.<strong>Farm</strong> Conclusions <strong>to</strong> <strong>School</strong> and Sample RecommendationsTools and ResourcesB. The Task Force shall be composed of fifteen (15) members as follows:1. The Secretary of Agriculture or a designee;2. The Superintendent of Public Instruction or a designee;3. A representative of the Oklahoma State University Extension Services;4. A person who represents a vendor that supplies food <strong>to</strong> school districts in the state;and5. Eleven persons who are members of a nonprofit food policy council appointed by theGovernor.www.farm<strong>to</strong>school.org 171
Sample State Policy (Page 3 of 3)<strong>Farm</strong> <strong>to</strong> Conclusions <strong>School</strong> Sample and Tools Recommendationsand ResourcesC. The Secretary of Agriculture shall serve as chair of the Task Force and shall callthe meetings of the Task Force. Staffing assistance shall be provided by the staff of theOklahoma Department of Agriculture, Food, and Forestry and the State Department ofEducation.D. The Task Force shall present a written <strong>report</strong> <strong>to</strong> the Governor, the Speaker of theOklahoma House of Representatives, and the President Pro Tempore of the State Senateby December 31, 2006.E. Members of the Task Force shall receive no compensation for serving on the TaskForce but may receive travel reimbursement as follows:1. Legislative members of the Task Force may be reimbursed for necessary travel expensesincurred in the performance of duties, in accordance with Section 456 of Title 74 of theOklahoma Statutes from the legislative body in which they serve; and2. Other members of the Task Force may be reimbursed for necessary travel expenses incurredin the performance of duties by the respective appointing authorities in accordancewith the State Travel Reimbursement Act.SECTION 4. This act shall become effective July 1, 2006.SECTION 5. It being immediately necessary for the preservation of the public peace,health and safety, an emergency is hereby declared <strong>to</strong> exist, by reason whereof this act shalltake effect and be in full force from and after its passage and approval.COMMITTEE REPORT BY: COMMITTEE ON HEALTH AND HUMAN SER-VICES, dated2-14-06 — DO PASS, As Amended and Coauthored.Adapted from “Oklahoma HB 2655,” available at:http://www.okhouse.gov/Legislation/BillFiles/hb2655cs_lrp.PDF172 Bearing Fruit: <strong>Farm</strong> <strong>to</strong> <strong>School</strong> Evaluation Resources and Recommendations
Assessing Financial Viability of <strong>Farm</strong> <strong>to</strong> <strong>School</strong> Programs (Page 1 of 1)Sample Template: XXXX Student Nutrition Services COSTS & INCOME, Yrs XX-Number of mealsPro-rate of <strong>to</strong>tal districtPro-rate of elementary, ifapplicableCOSTSFood and Food SuppliesProduceNon-produceSub<strong>to</strong>tal foodFood suppliesSub<strong>to</strong>tal food/suppliesNon-capital Equip, SuppliesFuelRent/repairsOther*Sub<strong>to</strong>tal equip, suppliesLaborTotal laborAdditional Salad BarLabor / requirement for farm<strong>to</strong> school programSub<strong>to</strong>tal laborInterestSales taxIndirectTotal costsINCOMENSLPBreakfastNeedy breakfastMisc. food service salesSupplemental grantsTotal incomePROFIT (OR LOSS)Total DistrictSalad Bar Meals(<strong>Farm</strong> <strong>to</strong> <strong>School</strong>Component)Non-Salad BarMeals (Non-farm <strong>to</strong><strong>School</strong>)<strong>Farm</strong> Conclusions <strong>to</strong> <strong>School</strong> and Sample RecommendationsTools and ResourcesAdapted from “Assessing Financial Viability of <strong>Farm</strong> <strong>to</strong> <strong>School</strong> Programs” Yolo County <strong>Farm</strong> <strong>to</strong><strong>School</strong> Evaluation Report Year Two Annual Report, Gail Feenstra and Jeri Ohmart, 2004-05www.farm<strong>to</strong>school.org 173
Rethinking <strong>School</strong> Lunch Calcula<strong>to</strong>r (Page 1 of 3)<strong>Farm</strong> <strong>to</strong> Conclusions <strong>School</strong> Sample and Tools Recommendationsand ResourcesIntroductionTh is <strong>to</strong>ol for financial analysis is designed <strong>to</strong> help you forecast the financial impact ofrethinking your food service models. Th e calcula<strong>to</strong>r contains several individual worksheetsthat track income and expense categories for a district of up <strong>to</strong> 15 schools, fromelementary through high school. The worksheets are optimized <strong>to</strong> support “fresh prep”,farm-<strong>to</strong>-school lunch programs that promote healthy outcomes for students and districts.Th is financial calcula<strong>to</strong>r is provided for informational purposes only and is not intended,and should not be construed, as a financial advisor or software budgeting application.Th e Center for Ecoliteracy and Bon Appétit Management Company does not providetechnical support or budget advice and you should consult with a professional businessadvisor about your individual circumstances.On the next page, find an example of the “Assumptions” spreadsheet, the first part of theFinancial Calcula<strong>to</strong>r. The full calcula<strong>to</strong>r also includes spreadsheets <strong>to</strong> enter Ops Revenue,Ops Management, Ops Labor, Ops Expense, District Overhead and Proforma,and includes a Help file as well. To download the <strong>to</strong>ol <strong>to</strong> use in your own school lunchcalculations, please visit:http://www.ecoliteracy.org/programs/pdf/rethinking_calcula<strong>to</strong>r.zip174 Bearing Fruit: <strong>Farm</strong> <strong>to</strong> <strong>School</strong> Evaluation Resources and Recommendations
Rethinking <strong>School</strong> Lunch Calcula<strong>to</strong>r (Page 2 of 3)Scenario - Assumptions Input Grid<strong>School</strong> District Name XYZ Unified <strong>School</strong> District<strong>School</strong> Name (Unit) A B C D EStudent Population 1200 1200 800 800 800Adult Population 100 100 75 75 75Operating Days 180 180 180 180 180Operating Weeks 36 36 36 36 36Café/Retail Food Cost % 38% 38% 38% 38% 38%Vending Food Cost % 65% 65% 65% 65% 65%Contract Food Cost % 0% 0% 35% 0% 0%Catering Food Cost % 28% 28% 28% 28% 28%Management Tax & Benefit Rate 30%Full Time Staff Tax & Benefit Rate 35%Part Time Staff Tax & Benefit Rate 20%Federal & State Reimbursement Input GridFull Pay Partial Pay FreeFederal Reimbursement - Breakfast$0.22 $ 0.87 $ 1.17State Reimbursement - Breakfast $ - $ - $ -<strong>Farm</strong> Conclusions <strong>to</strong> <strong>School</strong> and Sample RecommendationsTools and Resourceswww.farm<strong>to</strong>school.org 175
Rethinking <strong>School</strong> Lunch Calcula<strong>to</strong>r (Page 3 of 3)<strong>Farm</strong> <strong>to</strong> Conclusions <strong>School</strong> Sample and Tools Recommendationsand ResourcesFederal Reimbursement - Lunch$0.20 $ 1.74 $ 2.14State Reimbursement - Lunch $ - $ 0.13 $ 0.13Federal Reimbursement - Snack$0.05 $ 0.29 $ 0.58State Reimbursement - Snack $ - $ - $ -Available - Annual Commodity Assistance CalculationScenario A B C D EDaily - Full Pay 60 60 56 56 56Daily - Partial Pay 96 96 88 88 88Daily - Free 144 144 112 112 112Daily - Total 300 300 256 256 256Annual - Operating Days 180 180 180 180 180Annual - Lunches 54000 54000 46080 46080 46080$$Commodity Assistance per Meal 0.16 $ 0.16 $ 0.16 0.16 0.16$$Annual - Commodity Assistance 8,640 $ 8,640 $ 7,373 7,373 7,373$$Adapted from Rethinking <strong>School</strong> Lunch Financial Calcula<strong>to</strong>r, Center for Ecoliteracy’sRethinking <strong>School</strong> Lunch Guide, J. P. Dozier, Bon Appétit Management Company, incollaboration with the Center for Ecoliteracy and its Food Service Direc<strong>to</strong>rs’ Roundtable,March 30, 2004. Available at: http://www.ecoliteracy.org/programs/rsl-guide.html.176 Bearing Fruit: <strong>Farm</strong> <strong>to</strong> <strong>School</strong> Evaluation Resources and Recommendations
Seasonal Use of Locally Grown Fruits & Vegetables Assessment (Page 1 of 2)For each of the fruits and vegetables listed below, over the past year have purchases offresh produce during the availability period from any source been made? For example,did you purchase fresh blueberries from any source anytime from mid July though Oc<strong>to</strong>ber?Once the school or college has identified which locally grown fruits or vegetables couldbe purchased ruing specifi c periods of the year, documenting actual purchases is thenext and very important step. <strong>School</strong> administra<strong>to</strong>rs, school meals program budgetmanagers, funding agencies and community supporters are all interested in the economicimpact farm <strong>to</strong> school is having on the school and on the local economy. Keepingtrack of local purchases and their costs <strong>to</strong> the school is essential in making a solidassessment.Th e form on the next page was developed <strong>to</strong> track the quantity of fruits and vegetablespurchased from in-state producers and the cost.<strong>Farm</strong> Conclusions <strong>to</strong> <strong>School</strong> and Sample RecommendationsTools and Resourceswww.farm<strong>to</strong>school.org 177
Seasonal Use of Locally Grown Fruits & Vegetables Assessment (Page 2 of 2)<strong>Farm</strong> <strong>to</strong> Conclusions <strong>School</strong> Sample and Tools Recommendationsand ResourcesProduce Item Jan Feb Mar Apr May Jun Jul Aug Sep Oct Nov Dec Yes NoApplesBlueberriesCherries,sweetCherries, sourGrapesMelonsPeachesPearsPlumsRaspberriesStrawberriesAsparagusBeansBeetsBroccoliCabbageCarrotsCauliflowerCeleryCelery rootCornCucumberEggplantLettuceOnionsParsnipsPeasPeppersPota<strong>to</strong>esPumpkinsRadishesRhubarbRutabagasSpinachSquash,summerSquash,winterToma<strong>to</strong>esTurnipsAdapted from “Making the Cafeteria Connection Toolbox,” <strong>Farm</strong> <strong>to</strong> <strong>School</strong> in the Northeast: Makingthe Connection for Healthy Kids and Healthy <strong>Farm</strong>s. By Jennifer L. Wilkins, Heidi Mouillesseaux-Kunzman, Martha Goodsell, Betsey Bacelli, Meredith Graham Cornell <strong>Farm</strong> <strong>to</strong> <strong>School</strong> Program, NY<strong>Farm</strong>s!, and the <strong>New</strong> York <strong>School</strong> Nutrition Association. May 2007. The <strong>to</strong>olbox was developed as par<strong>to</strong>f a project funded by the Northeast Sustainable Agriculture Research and Education Program.178 Bearing Fruit: <strong>Farm</strong> <strong>to</strong> <strong>School</strong> Evaluation Resources and Recommendations
K-12 Food Service Check-in Form (Page 1 of 1)Date: _______ <strong>School</strong> Name: _____________________ in ____________________ district1. What local fruits and vegetables did you use in your food service this past month? (listitems mentioned)For each food, did you get these items through a supplier or did you purchase them directlyfrom a farmer? (Circle one or both if applicable)Supplier <strong>Farm</strong>er2. What other locally produced food products (such as dairy products, meats, poultry, eggs,maple syrup, honey) did you use in your food service this past month?For each food, did you get these items through a supplier or did you purchasedirectly from a farmer? (Circle one or both if applies)Supplier <strong>Farm</strong>erthem3. Did you ask/talk with your supplier about availability of local (state or regional) foods?4. Did you seek out any other sources of local foods?5. Have you talked directly with any farmer about what they grow and could provide?6. Did you encounter any difficulty in procuring local foods? Describe.7. How would you describe the quality of the local foods that you served? Name the foods._______________________________Excellent Good Fair OK Poor8. Did you do any sort of marketing <strong>to</strong> make student and the school community aware thatlocally produced foods were being served?Yes______ No_______Describe: _________________________________________________________<strong>Farm</strong> Conclusions <strong>to</strong> <strong>School</strong> and Sample RecommendationsTools and Resources9. How would you describe the reactions of the students <strong>to</strong> the local foods that you served?Ecstatic Enthusiastic Neutral Mildly Negative Other: ____________10. How did the price of the local items compare with similar items you would havereceived through national/regional distribution?Adapted from “Periodic Check-in with K-12 <strong>School</strong>s,” Making the Cafeteria Connection Toolbox, <strong>Farm</strong> <strong>to</strong><strong>School</strong> in the Northeast: Making the Connection for Healthy Kids and Healthy <strong>Farm</strong>s. By Jennifer L. Wilkins,Heidi Mouillesseaux-Kunzman, Martha Goodsell, Betsey Bacelli, Meredith Graham Cornell <strong>Farm</strong> <strong>to</strong> <strong>School</strong>Program, NY <strong>Farm</strong>s!, and the <strong>New</strong> York <strong>School</strong> Nutrition Association. May 2007. The <strong>to</strong>olbox was developedas part of a project funded by the Northeast Sustainable Agriculture Research and Education Program.www.farm<strong>to</strong>school.org 179
Local Food Purchases Record (Page 1 of 1)<strong>Farm</strong> <strong>to</strong> Conclusions <strong>School</strong> Sample and Tools Recommendationsand ResourcesOnce the school or college has identified which locally grown fruits or vegetables couldbe purchased during specific periods of the year, documenting actual purchases is thenext and very important step. <strong>School</strong> administra<strong>to</strong>rs, school meals program budgetmanagers, funding agencies and community supporters are all interested in the economicimpact farm <strong>to</strong> school is having on the school and on the local economy. Keepingtrack of local purchases and their costs <strong>to</strong> the school is essential in making a solidassessment.Th e form below was developed <strong>to</strong> track the quantity of fruits and vegetables purchasedfrom in-state producers and the cost.<strong>School</strong> District: _____________________________________ Week:________________ItemUnitNo. ofUnitsPrice/UnitName ofSupplier or<strong>Farm</strong>erComments: delivery,quality, service, use,acceptance, etc.Adapted from “Making the Cafeteria Connection Toolbox,” <strong>Farm</strong> <strong>to</strong> <strong>School</strong> in the Northeast: Makingthe Connection for Healthy Kids and Healthy <strong>Farm</strong>s. By Jennifer L. Wilkins, Heidi Mouillesseaux-Kunzman, Martha Goodsell, Betsey Bacelli, Meredith Graham Cornell <strong>Farm</strong> <strong>to</strong> <strong>School</strong> Program, NY<strong>Farm</strong>s!, and the <strong>New</strong> York <strong>School</strong> Nutrition Association. May 2007. The <strong>to</strong>olbox was developed as par<strong>to</strong>f a project funded by the Northeast Sustainable Agriculture Research and Education Program.180 Bearing Fruit: <strong>Farm</strong> <strong>to</strong> <strong>School</strong> Evaluation Resources and Recommendations
Questions for Food Service Providers (Page 1 of 1)We would like <strong>to</strong> get your feedback on the Burling<strong>to</strong>n <strong>School</strong> Food Project and lessonsyou have learned in participating as a Food Service Provider. Your responses will help inthe <strong>eval</strong>uation of this project so that other schools may learn from your good work!Taste Tests1. What are the main lessons that you have learned in carrying out taste testsof new foods in your cafeteria?Menu Changesa. How has the taste test been successful?b. How would you recommend improving the taste tests?2. How has the school cafeteria menu changed because of this project? Whathave been some reactions <strong>to</strong> these changes?3. How has your cafeteria been successful in bringing fresh and local foods in<strong>to</strong>your menu choices?4. What response have you gotten from students regarding the taste tests andnew menu choices?Impact on your work as a Food Service Provider5. How has this project changed your work as a Food Service provider?6. What are barriers or challenges that you have faced as Food Service staff <strong>to</strong>integrate fresh and local foods <strong>to</strong> your school cafeteria?7. What are overall lessons you have learned that you would like <strong>to</strong> share withothers who may try <strong>to</strong> replicate this project in another school?8. Please feel free <strong>to</strong> add anything that was not <strong>cover</strong>ed above.<strong>Farm</strong> Conclusions <strong>to</strong> <strong>School</strong> and Sample RecommendationsTools and ResourcesTh a nk you very much for participating in this focus group.Adapted from “Questions for Food Service Providers,” Schmidt M.C., Kolodinsky J, The Burling<strong>to</strong>n<strong>School</strong> Food Project, Final Evaluation Report, December 2006, Center for Rural Studies.www.farm<strong>to</strong>school.org 181
Classroom/<strong>School</strong> Waste Audit (Page 1 of 1)<strong>Farm</strong> <strong>to</strong> Conclusions <strong>School</strong> Sample and Tools Recommendationsand ResourcesType ofMaterialMixed PaperCardboardPlasticBottles#1(PETE)#2(HDPE)Glass Bottles& JarsAluminumCans<strong>New</strong>spaperFood WastePolystyrene#6OtherPlastics#3, 4, 5, 7Yard WasteMisc. Items,Textiles,ElectronicsEstimatePercentagesLocationVisually estimatethe amount in % or Foundweight the material(pounds or ounces)Please check below the appropriate box or boxes <strong>to</strong>determine what can be done with the materials youhave found during the waste auditCompost ReduceReuse RecycleDonate orExchange DumpsterOther WasteTry and keep your food and green waste separate from the dumpster waste during theaudit. This is not necessary for a visual audit.Adapted from Performing a <strong>School</strong> Waste Audit, Recyclworks.org. Completeinstructions available at: http://www.recycleworks.org/schools/s_audits.htm182 Bearing Fruit: <strong>Farm</strong> <strong>to</strong> <strong>School</strong> Evaluation Resources and Recommendations
Food Service Direc<strong>to</strong>r Interview (Page 1 of 1)[Interview school food service direc<strong>to</strong>r, kitchen prep personnel at schools. May want<strong>to</strong> organize a focus group at each school <strong>to</strong> discuss issues, concerns before programstarts.]• How has the salad bar program worked for you the last few months?• What works well? What doesn’t work? What are the major challenges?• Have labor issues (prep, clean-up) been addressed satisfac<strong>to</strong>rily? What could beimproved? Have volunteers been helpful or not?• Have equipment issues been addressed? What could be improved?• Is delivery and s<strong>to</strong>rage an issue? What could be improved?• Are food costs for this program acceptable, within limits?• Have you been able <strong>to</strong> integrate USDA commodities in<strong>to</strong> the salad bar? Whichones? Can you use more/less than you used <strong>to</strong>? Has this affected the program cost?• What is your sense about the acceptance of the salad bar among the children? Platewaste estimate?• How is the program accepted by teachers? Parents? <strong>School</strong> administra<strong>to</strong>rs?• How could this program be improved?Indica<strong>to</strong>rs <strong>to</strong> gather• Monthly food and labor costs for salad bar program compared <strong>to</strong> no salad bar• Participation rates in each school (students and teachers)• List of produce purchased monthly-quantities, prices• Percentage of produce and/or food sales that come from local farmers. [There maybe other direct purchases from local growers in addition <strong>to</strong> the salad bar]• List of commodities used in lunch program, in salad bar program.<strong>Farm</strong> Conclusions <strong>to</strong> <strong>School</strong> and Sample RecommendationsTools and ResourcesAdapted from “UC SAREP Bi-annual Interview Pro<strong>to</strong>col – FoodService Direc<strong>to</strong>r,” Feenstra and Ohmart, UC SAREPwww.farm<strong>to</strong>school.org 183
Salad Bar Coordina<strong>to</strong>r Interview (Page 1 of 1)[Review the monthly <strong>report</strong>s <strong>to</strong> help you conduct this interview]<strong>Farm</strong> <strong>to</strong> Conclusions <strong>School</strong> Sample and Tools Recommendationsand Resources• How has the salad bar been working?• What works well? What doesn’t work? What are the major challenges?• How as the interface with farmers’ been? Problems? How have you dealt with diffic ulties?• How has the interface with school food service been? Problems? How have youdealt with difficulties?• How has the interface with children gone? Problems? How have you dealt withthem?• How has the interface worked with parents? Teachers? Administra<strong>to</strong>rs? Problems?How have you dealt with them?• What advice would you give another district that is trying <strong>to</strong> start such a program?• What advice would you give another district about sustaining such a program?• What do you need <strong>to</strong> do your job better?• What are your plans for the next 6 months?Adapted from “UC SAREP Bi-annual Interview Pro<strong>to</strong>col – Salad BarCoordina<strong>to</strong>r,” Feenstra and Ohmart, UC SAREP184 Bearing Fruit: <strong>Farm</strong> <strong>to</strong> <strong>School</strong> Evaluation Resources and Recommendations
<strong>Farm</strong>er Interview Pro<strong>to</strong>col (Page 1 of 1)[Depending on the number of participating farmers, you may want <strong>to</strong> select a randomsample <strong>to</strong> conduct the following brief interview]· How has the salad bar program worked for you the last few months?· What works well? What doesn’t work? What are the major challenges?· Have you planted additional acreage for the program? How much?· What additional crops have you planted? How much?· Do you use any season extension practices as a result of the program?· Are the prices you receive adequate, competitive?· Do you have additional costs from this program? What are they?· Are there additional requirements (pack? delivery? labor, etc.)· Has your marketing plan changed as a result of this program? How?· Overall, is this program profitable for you?· What would it take <strong>to</strong> make this program more profitable?· How could this program be improved?Indica<strong>to</strong>rs <strong>to</strong> gather<strong>Farm</strong> Conclusions <strong>to</strong> <strong>School</strong> and Sample RecommendationsTools and Resources· Weekly or monthly quantities sold and prices· Gross sales per farmer· Additional costs associated with program· List of produce items sold each monthAdapted from “UC SAREP Bi-annual Interview Pro<strong>to</strong>col – <strong>Farm</strong>ers” Feenstra and Ohmart, UC SAREPwww.farm<strong>to</strong>school.org 185
<strong>Farm</strong>er Survey (Page 1 of 3)Name:Date:<strong>Farm</strong> <strong>to</strong> Conclusions <strong>School</strong> Sample and Tools Recommendationsand ResourcesTitle:<strong>School</strong> District:Street Address:City: State: Zip:Telephone:E-Mail:Fax:1. Are you currently supplying produce <strong>to</strong> the schools in your area?If yes, skip <strong>to</strong> number 8If no, go <strong>to</strong> number 2.2. Is there excess capacity on your farm that you could plant specifically for a farm-<strong>to</strong>schoolprogram?3. Do you currently have extra product that you could sell <strong>to</strong> schools?4. Do you do value-added processing? If no, skip <strong>to</strong> number 6.5. Do you have the capacity <strong>to</strong> do additional processing <strong>to</strong> make your product acceptablefor sale <strong>to</strong> your school or district?6. Are you a member of a cooperative?7. Do you have the infrastructure (e.g., trucks, driver, cold s<strong>to</strong>rage) <strong>to</strong> deliver product<strong>to</strong> schools or a central processing location?If you are currently participating in farm <strong>to</strong> school8. Please describe the products and quantities you are selling <strong>to</strong> schools.186 Bearing Fruit: <strong>Farm</strong> <strong>to</strong> <strong>School</strong> Evaluation Resources and Recommendations
<strong>Farm</strong>er Survey (Page 2 of 3)9. Do you sell <strong>to</strong> Dept. of Defense Fresh program?10. How did you become involved in selling <strong>to</strong> schools?11. Is this project economically viable from your perspective?12. Do you sell <strong>to</strong> other institutions?13. Are there policies at the school, district, local, state or federal level which suppor<strong>to</strong>r undermine selling <strong>to</strong> schools?Transportation and Delivery14. Who delivers your products <strong>to</strong> schools? How?15. How often are pick-ups made?16. How often are deliveries made?17. Are they picked up from your farm?18. Are they delivered on the same day?19. Are deliveries made <strong>to</strong> a central location or <strong>to</strong> individual schools?<strong>Farm</strong> Conclusions <strong>to</strong> <strong>School</strong> and Sample RecommendationsTools and Resources20. How did the transport mechanism evolve?Supply21. How many schools are you supplying?22. Are you able <strong>to</strong> consistently meet demand?23. Are you able <strong>to</strong> provide products <strong>to</strong> schools year-round? What, when?24. Do you sell processed products, e.g. apple juice, dried fruit?www.farm<strong>to</strong>school.org 187
<strong>Farm</strong>er Survey (Page 3 of 3)Pricing<strong>Farm</strong> <strong>to</strong> Conclusions <strong>School</strong> Sample and Tools Recommendationsand Resources25. How is the price for your product determined?26. Are you selling at or below the standard wholesale price?27. Are you selling at, above, or below the retail price?28. Are you making enough profit <strong>to</strong> continue selling <strong>to</strong> schools?29. If you deliver your product washed, pre-cut, packaged or processed in any way doyou charge extra for that service?Outside Support30. Are you part of a group that has helped organize this project?31. Do you or the organizing group receive outside support for this project such asgrant funds, donations, or services?Adapted from “Initial Questions for <strong>Farm</strong>ers,” Community Food SecurityCoalition and the Center for Food & Justice, Occidental College188 Bearing Fruit: <strong>Farm</strong> <strong>to</strong> <strong>School</strong> Evaluation Resources and Recommendations
Healthy City Parent Survey (Page 1 of 2)Hello, may I please speak with __________________. This is ____________ and I am callingon behalf of the Healthy City program with Jenn and Aziza. We are calling the parentsof all teenagers who participated in the program <strong>to</strong> follow up with them on the impac<strong>to</strong>f Healthy City on their child and family. Aziza mentioned that we could contact you. Isnow a good time <strong>to</strong> answer some questions? It should take about 7-10 minutes and allresponses will be kept confidential.If no: Can I schedule a time <strong>to</strong> call you back? [RECORD TIME]If yes: Thank you for agreeing <strong>to</strong> participate and again, all your answers will be keptconfi d ential and will not impact your child’s ability <strong>to</strong> participate in this program in thefuture in any way.1. First off, we would like <strong>to</strong> understand the impact your child’s participation in theHealthy City Program had on your child and your family. I’m going <strong>to</strong> read severalstatements and I’d like for you <strong>to</strong> tell me the level of change using the responses “not at all”,“a little”, “<strong>to</strong> some degree”, “very much”, and “a great deal”. I’ll repeat those responses again.Did the participation of your son/daughter in the Healthy City Program change: [REPEATSCALE EACH TIME AS NEEDED]Your child’s eating habits?If some change, please explainYour child’s involvement inschool?If some change, please explainYour family’s eating habits?If some change, please explainYour family’s involvement inyour child’s school activities?If some change, please explainNot atallAlittleTo somedegreeVerymuchA greatdeal<strong>Farm</strong> Conclusions <strong>to</strong> <strong>School</strong> and Sample RecommendationsTools and Resources2. Did your child bring home fresh vegetables <strong>to</strong> share with you and your family?YesNoIF YES:a. What vegetables did you like the most?b. What vegetables did you like the least?c. Were there any you would have liked information on how <strong>to</strong> cook with?www.farm<strong>to</strong>school.org 189
Healthy City Parent Survey (Page 2 of 2)<strong>Farm</strong> <strong>to</strong> Conclusions <strong>School</strong> Sample and Tools Recommendationsand Resources3. Using the same responses from “not at all” <strong>to</strong> “a great deal”, how did your child’s participationin the Healthy City program impact the following areas?Your child eats more vegetables at homeYour child eats more nutritious foods such asfruits, vegetables and whole grains at homeYour child talks about what they did during theday when they got home from Healthy CityYour child has become more responsible overallYour child has increased his or her physicalactivity, exercise, or playingYour child has had an improvement in his orher overall healthYour child has improved communication withyou and your familyYour child has increased his or her savings withthe money they earned from participatingYour child has an improved work ethic, such asshowing up on time and valuing working hardNotat allAlittleTo somedegree4. Did their participation cause any other changes in your child or family?VerymuchA greatdeal5. What skills or knowledge did your son or daughter learn from their participation in theHealthy City Program?6. What was your child’s response <strong>to</strong> being <strong>to</strong> work on time?7. What did your child do with their earnings from participating?8. Did your child share with you anything they liked or disliked about the Healthy Cityprogram? Yes No a. If yes, please explain comments:9. What did you like most about the Healthy City program?10. Overall, how satisfied are you with the Healthy City Program?SomewhatSomewhatVery satisfiedNeithersatisfieddissatisfiedVery dissatisfied11. What would you change about the Healthy City Program <strong>to</strong> improve it in the future?Th at was my fi n al question. Thank you so much for your time, I really appreciate it. Have agood day/evening.Adapted from “Healthy City Parent Survey,” Schmidt M.C., Kolodinsky J, The Burling<strong>to</strong>n<strong>School</strong> Food Project, Final Evaluation Report, December 2006, Center for Rural Studies.190 Bearing Fruit: <strong>Farm</strong> <strong>to</strong> <strong>School</strong> Evaluation Resources and Recommendations
Citizen Interview (Page 1 of 2)Th e next set of questions is about children’s nutrition and school lunch.Q1 Do you have a child or any children in kindergarten through 12th grade?1 Yes2 No3 Don’t know [DO NOT READ]4 Refused [DO NOT READ]If (q1>1) skip all questionsQ2 Has your child participated in any food, farm and/or nutrition education activitiesat school?1 Yes2 No3 Don’t know [DO NOT READ]4 Refused [DO NOT READ]If (Q2>1) skp Q4Q3 How have these education activities changed your child’s eating habits?[READ RESPONSES AND CHECK ALL THAT APPLY.]No changeWilling <strong>to</strong> try new foodsEats more fruits and vegetablesHas shared this information with your familyHas changed your families eating habitsAnything else? (other, please specify)Don’t know [DO NOT READ]Refused [DO NOT READ]<strong>Farm</strong> Conclusions <strong>to</strong> <strong>School</strong> and Sample RecommendationsTools and ResourcesQ4 Of the following choices, please select the <strong>to</strong>p 3 <strong>to</strong>ols that would be most helpful <strong>to</strong>get your child <strong>to</strong> eat more healthy foods.READ LIST. ASK: What is your first choice that would be most helpful <strong>to</strong> get your child<strong>to</strong> eat more healthy foods?SELECT FIRST CHOICEASK: What is your second choice? [READ LIST IF NEEDED]SELECT SECOND CHOICEASK: What is your third choice? [READ LIST IF NEEDED]www.farm<strong>to</strong>school.org 191
Citizen Interview (Page 2 of 2)<strong>Farm</strong> <strong>to</strong> Conclusions <strong>School</strong> Sample and Tools Recommendationsand Resources[RANDOMIZE OPTIONS every time they are asked]Nutrition informationHealthy recipesParent workshops on buying and cooking foodTips for introducing new foods <strong>to</strong> kidsReinforcement from schoolQ5 How many days a week does your child eat lunch served by the school cafeteria?01234598 Don’t know [DO NOT READ]99 Refused [DO NOT READ]Q6 If your school cafeteria served more fresh and local foods would you encourage yourchild <strong>to</strong> eat:1 More school lunches2 Less school lunches3 The same amount of school lunches4 Don’t know [DO NOT READ]5 Refused [DO NOT READ]Q7 Approximately how much do you pay per day for your child <strong>to</strong> eat lunch served inyour school cafeteria?[ENTER DOLLAR AMOUNT AND HIT NEXT TO CONTINUE]$9.98 Don’t know [DO NOT READ]9.99 Refused [DO NOT READ]Q8 Based on this amount, how much more money would you be willing <strong>to</strong> pay perlunch if the school cafeteria served fresh, local food?[ENTER DOLLAR AMOUNT AND HIT NEXT TO CONTINUE]$Range allowed: $.00-$5.00$5.01 Don’t know [DO NOT READ]$5.02 Refused [DO NOT READ]Adapted from “Vermonter Poll 2006 Questions” Schmidt M.C., Kolodinsky J, The Burling<strong>to</strong>n<strong>School</strong> Food Project, Final Evaluation Report, December 2006, Center for Rural Studies.192 Bearing Fruit: <strong>Farm</strong> <strong>to</strong> <strong>School</strong> Evaluation Resources and Recommendations
Questions for Food Committee Members (Page 1 of 1)1. What are the goals of the Food Committee?2. What are the major accomplishments/activities that the Food Committee hasmade over the course of the grant?3. What aspects of the taste test model make it successful?4. In what ways has “farm <strong>to</strong> school” activities been integrated in<strong>to</strong> the school?5. How is this project and the work of the Food Committee received by others (i.e.administrative support, food service, students, parents, etc.)? Please provide examplesof feedback you have received.6. What are the strengths of the Food Committee?7. What barriers or challenges does the Food Committee face?8. How is the Food Committee working <strong>to</strong> make farm <strong>to</strong> school activities sustainablewithin the school?9. What are lessons you have learned that you would like <strong>to</strong> share with others whomay try <strong>to</strong> replicate this project in another school?10. Please provide any other comments that were not <strong>cover</strong>ed in the above questions.Th ank you for your participation in the Burling<strong>to</strong>n <strong>School</strong> Food Project and fortaking the time <strong>to</strong> complete these questions.<strong>Farm</strong> Conclusions <strong>to</strong> <strong>School</strong> and Sample RecommendationsTools and ResourcesAdapted from “Food Council Member Questions,” Schmidt M.C., Kolodinsky J, The Burling<strong>to</strong>n<strong>School</strong> Food Project, Final Evaluation Report, December 2006, Center for Rural Studies.www.farm<strong>to</strong>school.org 193
Project Partner Interview (Page 1 of 2)I. PERSONAL ROLE<strong>Farm</strong> <strong>to</strong> Conclusions <strong>School</strong> Sample and Tools Recommendationsand Resources1. Briefly describe your role in the Burling<strong>to</strong>n <strong>School</strong> Food Project (BSFP) and anychanges that may have occurred from the beginning of the grant <strong>to</strong> the end.2. What are some obstacles you personally have faced in your work with the project?How have you overcome these obstacles?3. What are specific lessons you have learned that you would recommend others whomight take on your role? OR What are the <strong>to</strong>p three best practices that you recommendothers use <strong>to</strong> carry out your role in the BSFP?II. MEETING GRANT GOALS1. What are examples from your experiences in this project that demonstrateincreased awareness, engagement, and consumption of local and healthy foods byBurling<strong>to</strong>n <strong>School</strong> children?2. What fac<strong>to</strong>rs have led <strong>to</strong> the successful integration of food from local farms in<strong>to</strong> theBurling<strong>to</strong>n <strong>School</strong> District cafeterias?3. What are the key components of a farm <strong>to</strong> school integration model?If you work directly with childrena. What changes have you seen in students’ skills, knowledge and attitudes<strong>to</strong>wards food, farms and nutrition?If you work directly with teachersb. In what ways have teachers integrated food, farm and nutrition educationin<strong>to</strong> their curriculum?If you assisted with taste testsc. How did students respond <strong>to</strong> participating in the taste tests?d. What has been the impact of the taste test on your students? The schoolfood service? <strong>School</strong> cafeteria offerings?e. What are attributes of the taste test model that you would recommend <strong>to</strong>others who want <strong>to</strong> replicate try this out?f. In what ways would you recommend improving school taste tests?If you work with Food Service Staffg. How have the Food Service staff been integrated in<strong>to</strong> this project?h. What fac<strong>to</strong>rs have led <strong>to</strong> Food Service Staff buy-in <strong>to</strong> make this projectwork in the school cafeterias?i. What have been the lessons learned from Food Service Staff <strong>to</strong> make thisproject work in the school cafeterias?If you work with farmersj. How have farmers been integrated in<strong>to</strong> this project?k. What fac<strong>to</strong>rs have led <strong>to</strong> farmer buy-in <strong>to</strong> produce and/or sell productsfor farm <strong>to</strong> school integration?194 Bearing Fruit: <strong>Farm</strong> <strong>to</strong> <strong>School</strong> Evaluation Resources and Recommendations
Project Partner Interview (Page 2 of 2)l. What have been the lessons learned <strong>to</strong> make farm <strong>to</strong> school integrationsuccessful from the perspectives of the farmers?4. What are examples that demonstrate the success of the implementation of a FoodAction Plan <strong>to</strong> increased access and use of local and healthy foods by the Burling<strong>to</strong>n<strong>School</strong> District?If you work with the Food Councila. How has the Food Council served <strong>to</strong> meet the goals of the BSFP?5. What are examples that demonstrate that this project has built community capacity<strong>to</strong> meet the food needs of low-income Burling<strong>to</strong>n school district students?6. What changes have you seen in the overall school culture <strong>to</strong>wards Food <strong>Farm</strong> &Nutrition?If work you with parents, volunteers, and community membersa. What role have parents, volunteers and community members played inthe success of this project?7. What are unintended outcomes that occurred because of this project? What fac<strong>to</strong>rscaused them <strong>to</strong> occur?III. COLLABORATIVE1. There are many partners and organizations involved in the BSFP. What are lessonsthat you have learned <strong>to</strong> make this type of multi-stakeholder collaborative work?2. What are effective ways <strong>to</strong> communicate with partners?3. What are effective ways <strong>to</strong> keep partners informed about your activities?4. What demonstrates that this partnership has worked effectively <strong>to</strong>gether? OR Howhas this partnership worked effectively <strong>to</strong>gether?5. What are ways you would recommend improving the partnership?6. What unintended partnerships have developed that have fostered the BSFP? Howhave they assisted in the project?<strong>Farm</strong> Conclusions <strong>to</strong> <strong>School</strong> and Sample RecommendationsTools and ResourcesIV. LESSONS LEARNED AND AREAS TO IMPROVE1. What lessons have you learned from the overall project as fac<strong>to</strong>rs that have made thisproject successful?2. What are the key components of a successful farm <strong>to</strong> school model?3. What are ways in which this project may be improved?4. How is the project working <strong>to</strong> make the program sustainable beyond key people?5. Feel free <strong>to</strong> share any final thoughts on anything that I have not <strong>cover</strong>ed.Th ank you so much for your time and all your hard work and effort for the BSFP.Adapted from “Project Partner Interview Guide” Schmidt M.C., Kolodinsky J, The Burling<strong>to</strong>n<strong>School</strong> Food Project, Final Evaluation Report, December 2006, Center for Rural Studies.www.farm<strong>to</strong>school.org 195
Volunteer Interview (Page 1 of 1)<strong>Farm</strong> <strong>to</strong> Conclusions <strong>School</strong> Sample and Tools Recommendationsand ResourcesDear Volunteer,Th ank you for volunteering your time and energy with the Burling<strong>to</strong>n <strong>School</strong> FoodProject. As part of this project’s <strong>eval</strong>uation, we would like <strong>to</strong> hear from you about yourexperiences. Please answer the questions below and email your responses <strong>to</strong> Michele,the project <strong>eval</strong>ua<strong>to</strong>r, at mschmidt@uvm.edu. You may also mail your responses <strong>to</strong> MicheleC. Schmidt, Center for Rural Studies, 207 Morrill Hall, University of Vermont,Burling<strong>to</strong>n, VT 05405. Please feel free <strong>to</strong> email Michele if you have any questions.1. Please describe what trainings and activities you volunteered for with the Burling<strong>to</strong>n<strong>School</strong> Food Project through City Market, taste tests, or field trips.2. Why did you decide <strong>to</strong> volunteer for the Burling<strong>to</strong>n <strong>School</strong> Food Project?3. What specifi c skills or knowledge did you gain from your volunteer experience withthe Burling<strong>to</strong>n <strong>School</strong> Food Project?4. How did your volunteerism for the Burling<strong>to</strong>n <strong>School</strong> Food Project impact your life?What did you gain out of this experience?5. How does the volunteer activity that you did with the Burling<strong>to</strong>n <strong>School</strong> Food Projectimpact your child or youth in Burling<strong>to</strong>n <strong>School</strong>s?6. How does the volunteer activity that you did with the Burling<strong>to</strong>n <strong>School</strong> Food Projectimpact the larger community?7. What feedback do you have on ways <strong>to</strong> improve this type of volunteer experience forothers in the future?8. Please feel free <strong>to</strong> make any other comments.Th ank you for your participation in the Burling<strong>to</strong>n <strong>School</strong> Food Project and for takingthe time <strong>to</strong> complete these questions.Adapted from “Volunteer Interview Guide,” Schmidt M.C., Kolodinsky J, The Burling<strong>to</strong>n<strong>School</strong> Food Project, Final Evaluation Report, December 2006, Center for Rural Studies.196 Bearing Fruit: <strong>Farm</strong> <strong>to</strong> <strong>School</strong> Evaluation Resources and Recommendations
Notes
Notes
Notes
Notes
Above and back <strong>cover</strong>: Kids at Abernethy Elementaryin Portland, OR learn about squash grown on theHertel family Sun Gold <strong>Farm</strong> as part of the PortlandPublic <strong>School</strong>s Harvest of the Month program.Pho<strong>to</strong>s by Rachel Torchia.
The national farm <strong>to</strong> school community brought <strong>to</strong>gether through the National <strong>Farm</strong> <strong>to</strong> <strong>School</strong> <strong>Network</strong> is committed<strong>to</strong> supporting farm <strong>to</strong> school program <strong>eval</strong>uations that will build upon the existing knowledge base for this innovativeprogram. In 2008, the National <strong>Farm</strong> <strong>to</strong> <strong>School</strong> <strong>Network</strong> embarked on a comprehensive <strong>eval</strong>uation of farm <strong>to</strong> schoolprograms at multiple sites across the country. Please contact the authors of this publication if you are interested inlearning more about participating in this initiative, or would like <strong>to</strong> enlist <strong>eval</strong>uation services for the future.Contact Us:Center for Food & Justice, Urban & Environmental Policy Institute, Occidental Collegewww.uepi.oxy.edu | www.farm<strong>to</strong>school.orgajoshi@oxy.edu | 323-341-5095