eval report cover.indd - New Jersey Farm to School Network Wiki
eval report cover.indd - New Jersey Farm to School Network Wiki
eval report cover.indd - New Jersey Farm to School Network Wiki

Create successful ePaper yourself
Turn your PDF publications into a flip-book with our unique Google optimized e-Paper software.
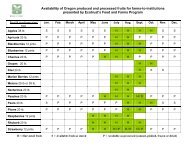
►►►►►Student lunchparticipation at anelementary schoolin the VEN-CAprogram rose from50% <strong>to</strong> 56% over thefi r st two years that afarm <strong>to</strong> school programwas in place. 49On days when staffand teachers had achoice between afarm <strong>to</strong> school saladbar lunch and a hotlunch, they chosethe salad bar mealby a fourteen <strong>to</strong> oneratio.Notes: CLP-CA, COM-CA represent salad bar and hot lunch meal participation;others represent pre and post salad bar meal participation.Timeline for collection of data – VEN-CA: 2 years; RSD-CA: 5months; CLP-CA: avg. over 5 years; AES-OR: 1 year; OSB-WA: 1year; CLP-CA: over 5 years; COM-CA: 1 year.At Jefferson Elementary <strong>School</strong> in RSD-CA, participation rates in the first fivemonths of a farm <strong>to</strong> school program rose 4% for students receiving free lunches,5.3% for students receiving reduced price meals, and 8.5% for paid students. Participationby adults (teachers and staff) shot up from 1.9% (just six lunches permonth) <strong>to</strong> 28.8% (133 lunches per month). RSD-CA also <strong>report</strong>ed a 9% increasein overall meal participation, including adult meals. From 1999-2005 (beforeimplementation of the farm <strong>to</strong> school program) the number of meals served bythe district grew at an average of about 2% per year. Th e school district <strong>report</strong>eda more than 25% leap in the number of meals served during the 2005-06 schoolyear as compared <strong>to</strong> 2004-05, during which time farm <strong>to</strong> school salad bars at fiveelementary schools were initiated. 47AES-OR <strong>report</strong>ed a 3% increase in participation rates (both in full-priced andreduced-priced meals) over the previous year when the program was not operational.The control school <strong>report</strong>ed no change in meal participation rates. 45Th e OSB-WA program <strong>report</strong>ed a 16% increase in school meal participation atLincoln Elementary and a 13% increase at Pioneer Elementary (as compared <strong>to</strong>previous years); they were the first two schools that implemented the organicsalad bar in 2003-04. 48Overall lunch participation at Caldwell Elementary in the COM-CA programshowed that salad bar participation was comparable <strong>to</strong> the hot lunch participation(averaging 51.6% and 50.3%, respectively). As a Provision II district whereall students can eat breakfast and lunch free of charge, Comp<strong>to</strong>n had higherlunch participation than many other non-Provision II districts. 20Review of <strong>Farm</strong> <strong>to</strong> <strong>School</strong> Evaluation Literaturewww.farm<strong>to</strong>school.org 43