A Spatial Analysis of Multivariate Output from Regional ... - IMAGe
A Spatial Analysis of Multivariate Output from Regional ... - IMAGe
A Spatial Analysis of Multivariate Output from Regional ... - IMAGe
Create successful ePaper yourself
Turn your PDF publications into a flip-book with our unique Google optimized e-Paper software.
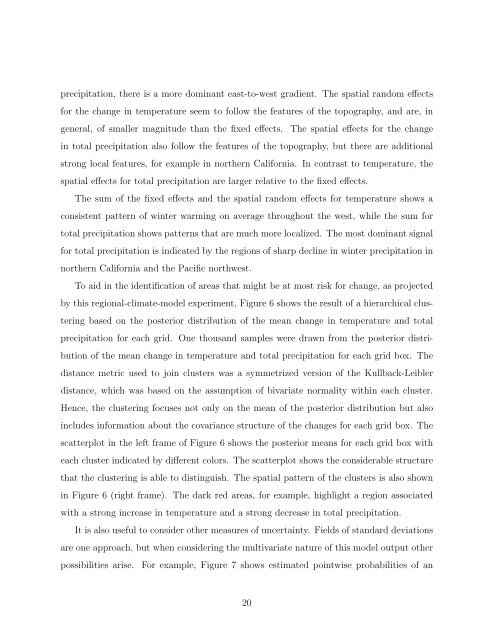
precipitation, there is a more dominant east-to-west gradient. The spatial random effectsfor the change in temperature seem to follow the features <strong>of</strong> the topography, and are, ingeneral, <strong>of</strong> smaller magnitude than the fixed effects. The spatial effects for the changein total precipitation also follow the features <strong>of</strong> the topography, but there are additionalstrong local features, for example in northern California. In contrast to temperature, thespatial effects for total precipitation are larger relative to the fixed effects.The sum <strong>of</strong> the fixed effects and the spatial random effects for temperature shows aconsistent pattern <strong>of</strong> winter warming on average throughout the west, while the sum fortotal precipitation shows patterns that are much more localized. The most dominant signalfor total precipitation is indicated by the regions <strong>of</strong> sharp decline in winter precipitation innorthern California and the Pacific northwest.To aid in the identification <strong>of</strong> areas that might be at most risk for change, as projectedby this regional-climate-model experiment, Figure 6 shows the result <strong>of</strong> a hierarchical clusteringbased on the posterior distribution <strong>of</strong> the mean change in temperature and totalprecipitation for each grid. One thousand samples were drawn <strong>from</strong> the posterior distribution<strong>of</strong> the mean change in temperature and total precipitation for each grid box. Thedistance metric used to join clusters was a symmetrized version <strong>of</strong> the Kullback-Leiblerdistance, which was based on the assumption <strong>of</strong> bivariate normality within each cluster.Hence, the clustering focuses not only on the mean <strong>of</strong> the posterior distribution but alsoincludes information about the covariance structure <strong>of</strong> the changes for each grid box. Thescatterplot in the left frame <strong>of</strong> Figure 6 shows the posterior means for each grid box witheach cluster indicated by different colors. The scatterplot shows the considerable structurethat the clustering is able to distinguish. The spatial pattern <strong>of</strong> the clusters is also shownin Figure 6 (right frame). The dark red areas, for example, highlight a region associatedwith a strong increase in temperature and a strong decrease in total precipitation.It is also useful to consider other measures <strong>of</strong> uncertainty. Fields <strong>of</strong> standard deviationsare one approach, but when considering the multivariate nature <strong>of</strong> this model output otherpossibilities arise. For example, Figure 7 shows estimated pointwise probabilities <strong>of</strong> an20


