A Spatial Analysis of Multivariate Output from Regional ... - IMAGe
A Spatial Analysis of Multivariate Output from Regional ... - IMAGe
A Spatial Analysis of Multivariate Output from Regional ... - IMAGe

Create successful ePaper yourself
Turn your PDF publications into a flip-book with our unique Google optimized e-Paper software.
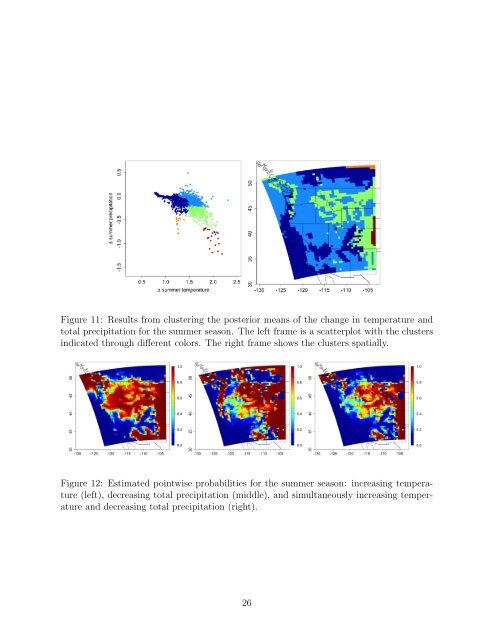
Figure 11: Results <strong>from</strong> clustering the posterior means <strong>of</strong> the change in temperature andtotal precipitation for the summer season. The left frame is a scatterplot with the clustersindicated through different colors. The right frame shows the clusters spatially.Figure 12: Estimated pointwise probabilities for the summer season: increasing temperature(left), decreasing total precipitation (middle), and simultaneously increasing temperatureand decreasing total precipitation (right).26