Application Note 3 - Tebu-Bio
Application Note 3 - Tebu-Bio
Application Note 3 - Tebu-Bio

Create successful ePaper yourself
Turn your PDF publications into a flip-book with our unique Google optimized e-Paper software.
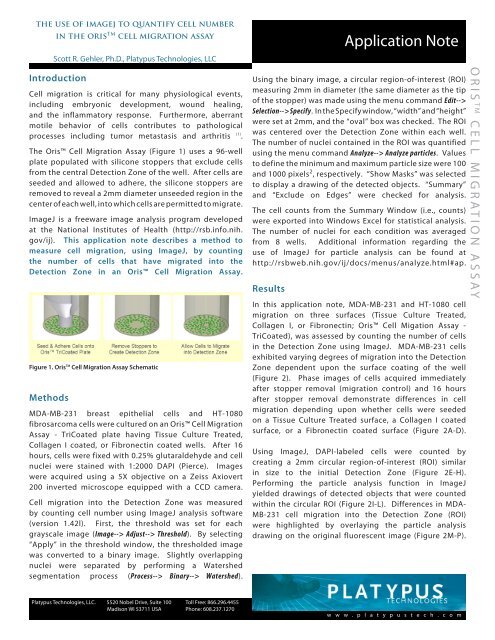
the use of imagej to quantify cell number<br />
Introduction<br />
Cell migration is critical for many physiological events,<br />
including embryonic development, wound healing,<br />
and the inflammatory response. Furthermore, aberrant<br />
motile behavior of cells contributes to pathological<br />
processes including tumor metastasis and arthritis (1) .<br />
The Oris Cell Migration Assay (Figure 1) uses a 96-well<br />
plate populated with silicone stoppers that exclude cells<br />
from the central Detection Zone of the well. After cells are<br />
seeded and allowed to adhere, the silicone stoppers are<br />
removed to reveal a 2mm diameter unseeded region in the<br />
center of each well, into which cells are permitted to migrate.<br />
ImageJ is a freeware image analysis program developed<br />
at the National Institutes of Health (http://rsb.info.nih.<br />
gov/ij). This application note describes a method to<br />
measure cell migration, using ImageJ, by counting<br />
the number of cells that have migrated into the<br />
Detection Zone in an Oris Cell Migration Assay.<br />
Methods<br />
in the oris TM cell migration assay<br />
Scott R. Gehler, Ph.D., Platypus Technologies, LLC<br />
Figure 1. Oris TM Cell Migration Assay Schematic<br />
MDA-MB-231 breast epithelial cells and HT-1080<br />
fibrosarcoma cells were cultured on an Oris Cell Migration<br />
Assay - TriCoated plate having Tissue Culture Treated,<br />
Collagen I coated, or Fibronectin coated wells. After 16<br />
hours, cells were fixed with 0.25% glutaraldehyde and cell<br />
nuclei were stained with 1:2000 DAPI (Pierce). Images<br />
were acquired using a 5X objective on a Zeiss Axiovert<br />
200 inverted microscope equipped with a CCD camera.<br />
Cell migration into the Detection Zone was measured<br />
by counting cell number using ImageJ analysis software<br />
(version 1.42l). First, the threshold was set for each<br />
grayscale image (Image--> Adjust--> Threshold). By selecting<br />
“Apply” in the threshold window, the thresholded image<br />
was converted to a binary image. Slightly overlapping<br />
nuclei were separated by performing a Watershed<br />
segmentation process (Process--> Binary--> Watershed).<br />
Platypus Technologies, LLC. 5520 Nobel Drive, Suite 100 Toll Free: 866.296.4455<br />
Madison WI 53711 USA Phone: 608.237.1270<br />
<strong>Application</strong> <strong>Note</strong><br />
Using the binary image, a circular region-of-interest (ROI)<br />
measuring 2mm in diameter (the same diameter as the tip<br />
of the stopper) was made using the menu command Edit--><br />
Selection--> Specify. In the Specify window, “width” and “height”<br />
were set at 2mm, and the “oval” box was checked. The ROI<br />
was centered over the Detection Zone within each well.<br />
The number of nuclei contained in the ROI was quantified<br />
using the menu command Analyze--> Analyze particles. Values<br />
to define the minimum and maximum particle size were 100<br />
and 1000 pixels 2 , respectively. “Show Masks” was selected<br />
to display a drawing of the detected objects. “Summary”<br />
and “Exclude on Edges” were checked for analysis.<br />
The cell counts from the Summary Window (i.e., counts)<br />
were exported into Windows Excel for statistical analysis.<br />
The number of nuclei for each condition was averaged<br />
from 8 wells. Additional information regarding the<br />
use of ImageJ for particle analysis can be found at<br />
http://rsbweb.nih.gov/ij/docs/menus/analyze.html#ap.<br />
Results<br />
In this application note, MDA-MB-231 and HT-1080 cell<br />
migration on three surfaces (Tissue Culture Treated,<br />
Collagen I, or Fibronectin; Oris Cell Migation Assay -<br />
TriCoated), was assessed by counting the number of cells<br />
in the Detection Zone using ImageJ. MDA-MB-231 cells<br />
exhibited varying degrees of migration into the Detection<br />
Zone dependent upon the surface coating of the well<br />
(Figure 2). Phase images of cells acquired immediately<br />
after stopper removal (migration control) and 16 hours<br />
after stopper removal demonstrate differences in cell<br />
migration depending upon whether cells were seeded<br />
on a Tissue Culture Treated surface, a Collagen I coated<br />
surface, or a Fibronectin coated surface (Figure 2A-D).<br />
Using ImageJ, DAPI-labeled cells were counted by<br />
creating a 2mm circular region-of-interest (ROI) similar<br />
in size to the initial Detection Zone (Figure 2E-H).<br />
Performing the particle analysis function in ImageJ<br />
yielded drawings of detected objects that were counted<br />
within the circular ROI (Figure 2I-L). Differences in MDA-<br />
MB-231 cell migration into the Detection Zone (ROI)<br />
were highlighted by overlaying the particle analysis<br />
drawing on the original fluorescent image (Figure 2M-P).<br />
w w w . p l a t y p u s t e c h . c o m<br />
ORIS TM CELL MIGRATION ASSAY
Merge Particle Analysis DAPI with Phase<br />
Drawing ROI Outline<br />
Figure 3. Quantitation of Cell Number using<br />
ImageJ.<br />
MDA-MB-231 (A) and HT-1080 (B) cell migration<br />
on three surfaces (Tissue Culture Treated,<br />
Collagen I, or Fibronectin). Data are presented<br />
as average cell number ± SD from 8 wells for<br />
each condition. p