INTERIM REPORT as of September 30, 2011 - Coca Cola İçecek
INTERIM REPORT as of September 30, 2011 - Coca Cola İçecek
INTERIM REPORT as of September 30, 2011 - Coca Cola İçecek

You also want an ePaper? Increase the reach of your titles
YUMPU automatically turns print PDFs into web optimized ePapers that Google loves.
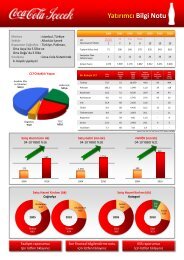
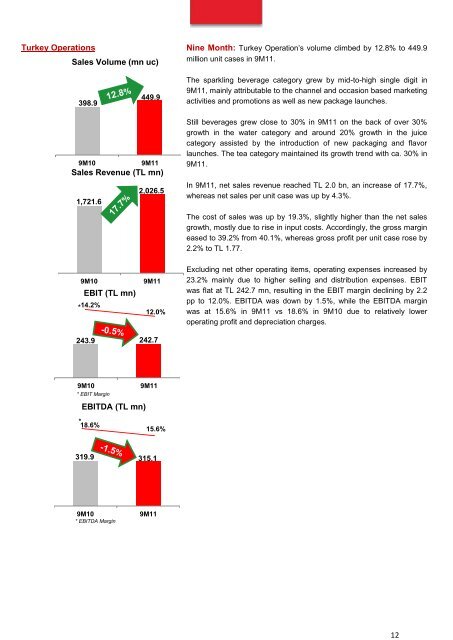
12Turkey Operations Nine Month: Turkey Operation’s volume climbed by 12.8% to 449.9Sales Volume (mn uc)million unit c<strong>as</strong>es in 9M11.398.9449.9The sparkling beverage category grew by mid-to-high single digit in9M11, mainly attributable to the channel and occ<strong>as</strong>ion b<strong>as</strong>ed marketingactivities and promotions <strong>as</strong> well <strong>as</strong> new package launches.9M109M11Sales Revenue (TL mn)2,026.51,721.6Still beverages grew close to <strong>30</strong>% in 9M11 on the back <strong>of</strong> over <strong>30</strong>%growth in the water category and around 20% growth in the juicecategory <strong>as</strong>sisted by the introduction <strong>of</strong> new packaging and flavorlaunches. The tea category maintained its growth trend with ca. <strong>30</strong>% in9M11.In 9M11, net sales revenue reached TL 2.0 bn, an incre<strong>as</strong>e <strong>of</strong> 17.7%,where<strong>as</strong> net sales per unit c<strong>as</strong>e w<strong>as</strong> up by 4.3%.The cost <strong>of</strong> sales w<strong>as</strong> up by 19.3%, slightly higher than the net salesgrowth, mostly due to rise in input costs. Accordingly, the gross margine<strong>as</strong>ed to 39.2% from 40.1%, where<strong>as</strong> gross pr<strong>of</strong>it per unit c<strong>as</strong>e rose by2.2% to TL 1.77.9M10EBIT (TL mn)* 14.2%9M1112.0%Excluding net other operating items, operating expenses incre<strong>as</strong>ed by23.2% mainly due to higher selling and distribution expenses. EBITw<strong>as</strong> flat at TL 242.7 mn, resulting in the EBIT margin declining by 2.2pp to 12.0%. EBITDA w<strong>as</strong> down by 1.5%, while the EBITDA marginw<strong>as</strong> at 15.6% in 9M11 vs 18.6% in 9M10 due to relatively loweroperating pr<strong>of</strong>it and depreciation charges.243.9 242.79M109M11* EBIT MarginEBITDA (TL mn)*18.6%15.6%319.9 315.19M10* EBITDA Margin9M11