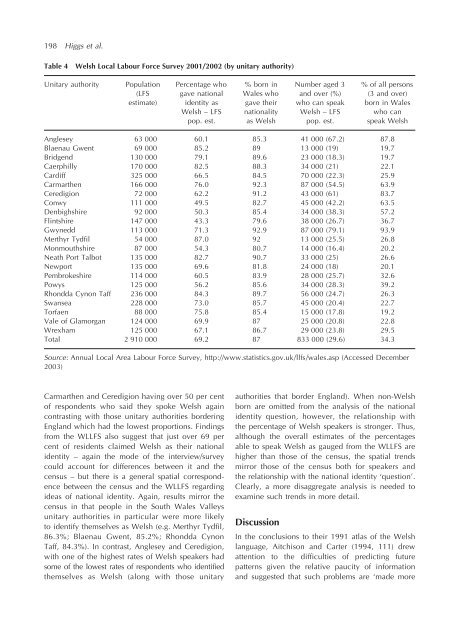
198 Higgs et al.Table 4<strong>Welsh</strong> Local Labour Force Survey 2001/2002 (by unitary authority)Unitary authorityPopulation(LFSestimate)Percentage whogave nationalidentity as<strong>Welsh</strong> – LFSpop. est.% born <strong>in</strong>Wales whogave <strong>the</strong>irnationalityas <strong>Welsh</strong>Number aged 3and over (%)who can speak<strong>Welsh</strong> – LFSpop. est.% <strong>of</strong> all persons(3 and over)born <strong>in</strong> Waleswho canspeak <strong>Welsh</strong>Anglesey 63 000 60.1 85.3 41 000 (67.2) 87.8Blaenau Gwent 69 000 85.2 89 13 000 (19) 19.7Bridgend 130 000 79.1 89.6 23 000 (18.3) 19.7Caerphilly 170 000 82.5 88.3 34 000 (21) 22.1Cardiff 325 000 66.5 84.5 70 000 (22.3) 25.9Carmar<strong>the</strong>n 166 000 76.0 92.3 87 000 (54.5) 63.9Ceredigion 72 000 62.2 91.2 43 000 (61) 83.7Conwy 111 000 49.5 82.7 45 000 (42.2) 63.5Denbighshire 92 000 50.3 85.4 34 000 (38.3) 57.2Fl<strong>in</strong>tshire 147 000 43.3 79.6 38 000 (26.7) 36.7Gwynedd 113 000 71.3 92.9 87 000 (79.1) 93.9Merthyr Tydfil 54 000 87.0 92 13 000 (25.5) 26.8Monmouthshire 87 000 54.3 80.7 14 000 (16.4) 20.2Neath Port Talbot 135 000 82.7 90.7 33 000 (25) 26.6Newport 135 000 69.6 81.8 24 000 (18) 20.1Pembrokeshire 114 000 60.5 83.9 28 000 (25.7) 32.6Powys 125 000 56.2 85.6 34 000 (28.3) 39.2Rhondda Cynon Taff 236 000 84.3 89.7 56 000 (24.7) 26.3Swansea 228 000 73.0 85.7 45 000 (20.4) 22.7Torfaen 88 000 75.8 85.4 15 000 (17.8) 19.2Vale <strong>of</strong> Glamorgan 124 000 69.9 87 25 000 (20.8) 22.8Wrexham 125 000 67.1 86.7 29 000 (23.8) 29.5Total 2 910 000 69.2 87 833 000 (29.6) 34.3Source: Annual Local Area Labour Force Survey, http://www.statistics.gov.uk/llfs/wales.asp (Accessed December2003)Carmar<strong>the</strong>n and Ceredigion hav<strong>in</strong>g over 50 per cent<strong>of</strong> respondents who said <strong>the</strong>y spoke <strong>Welsh</strong> aga<strong>in</strong>contrast<strong>in</strong>g with those unitary authorities border<strong>in</strong>gEngland which had <strong>the</strong> lowest proportions. F<strong>in</strong>d<strong>in</strong>gsfrom <strong>the</strong> WLLFS also suggest that just over 69 percent <strong>of</strong> residents claimed <strong>Welsh</strong> as <strong>the</strong>ir nationalidentity – aga<strong>in</strong> <strong>the</strong> mode <strong>of</strong> <strong>the</strong> <strong>in</strong>terview/surveycould account for differences between it and <strong>the</strong><strong>census</strong> – but <strong>the</strong>re is a general spatial correspondencebetween <strong>the</strong> <strong>census</strong> and <strong>the</strong> WLLFS regard<strong>in</strong>gideas <strong>of</strong> national identity. Aga<strong>in</strong>, results mirror <strong>the</strong><strong>census</strong> <strong>in</strong> that people <strong>in</strong> <strong>the</strong> South Wales Valleysunitary authorities <strong>in</strong> particular were more likely<strong>to</strong> identify <strong>the</strong>mselves as <strong>Welsh</strong> (e.g. Merthyr Tydfil,86.3%; Blaenau Gwent, 85.2%; Rhondda CynonTaff, 84.3%). In contrast, Anglesey and Ceredigion,with one <strong>of</strong> <strong>the</strong> highest rates <strong>of</strong> <strong>Welsh</strong> speakers hadsome <strong>of</strong> <strong>the</strong> lowest rates <strong>of</strong> respondents who identified<strong>the</strong>mselves as <strong>Welsh</strong> (along with those unitaryauthorities that border England). When non-<strong>Welsh</strong>born are omitted from <strong>the</strong> analysis <strong>of</strong> <strong>the</strong> nationalidentity question, however, <strong>the</strong> relationship with<strong>the</strong> percentage <strong>of</strong> <strong>Welsh</strong> speakers is stronger. Thus,although <strong>the</strong> overall estimates <strong>of</strong> <strong>the</strong> percentagesable <strong>to</strong> speak <strong>Welsh</strong> as gauged from <strong>the</strong> WLLFS arehigher than those <strong>of</strong> <strong>the</strong> <strong>census</strong>, <strong>the</strong> spatial <strong>trends</strong>mirror those <strong>of</strong> <strong>the</strong> <strong>census</strong> both for speakers and<strong>the</strong> relationship with <strong>the</strong> national identity ‘question’.Clearly, a more disaggregate analysis is needed <strong>to</strong>exam<strong>in</strong>e such <strong>trends</strong> <strong>in</strong> more detail.DiscussionIn <strong>the</strong> conclusions <strong>to</strong> <strong>the</strong>ir 1991 atlas <strong>of</strong> <strong>the</strong> <strong>Welsh</strong>language, Aitchison and Carter (1994, 111) drewattention <strong>to</strong> <strong>the</strong> difficulties <strong>of</strong> predict<strong>in</strong>g futurepatterns given <strong>the</strong> relative paucity <strong>of</strong> <strong>in</strong>formationand suggested that such problems are ‘made more
<strong>Use</strong> <strong>of</strong> <strong>the</strong> <strong>census</strong> <strong>of</strong> <strong>population</strong> <strong>to</strong> <strong>discern</strong> <strong>trends</strong> <strong>in</strong> <strong>the</strong> <strong>Welsh</strong> language 199so by <strong>the</strong> poverty <strong>of</strong> <strong>the</strong> <strong>population</strong> <strong>census</strong> <strong>in</strong> terms<strong>of</strong> language <strong>in</strong>formation’. Concerns over <strong>the</strong> lack<strong>of</strong> a sound statistical base with which <strong>to</strong> moni<strong>to</strong>rchanges over time have been expressed elsewhere(Jones and Williams 2000). Consequently, HywelJones, a senior statistician from <strong>the</strong> <strong>Welsh</strong> Assembly,has been seconded <strong>to</strong> <strong>the</strong> <strong>Welsh</strong> Language Board <strong>to</strong>establish a comprehensive database and <strong>to</strong> <strong>in</strong>terrogatea suite <strong>of</strong> current data sets <strong>to</strong> tease out sociol<strong>in</strong>guistic<strong>trends</strong> and implications. O<strong>the</strong>rs havesuggested alternatives <strong>to</strong> <strong>the</strong> use <strong>of</strong> <strong>the</strong> <strong>census</strong>;both Williams (1989 2000) and Williams and Morris(2000, 50) demonstrate <strong>the</strong> potential advantages thatmay accrue from conduct<strong>in</strong>g language use surveyswhich show how <strong>the</strong> <strong>Welsh</strong> language is actuallybe<strong>in</strong>g used <strong>in</strong> <strong>the</strong> home, workplace and community<strong>in</strong> order <strong>to</strong> gauge ‘what people actually do with <strong>the</strong><strong>Welsh</strong> which <strong>the</strong>y can speak’. Currently <strong>the</strong> <strong>Welsh</strong>Language Board is await<strong>in</strong>g <strong>the</strong> results <strong>of</strong> surveysit has commissioned on a range <strong>of</strong> issues such aslanguage reproduction with<strong>in</strong> <strong>the</strong> family, <strong>the</strong> sociol<strong>in</strong>guisticbehaviour <strong>of</strong> young people, <strong>the</strong> potentialfor an <strong>in</strong>creased use <strong>of</strong> <strong>Welsh</strong> with<strong>in</strong> <strong>the</strong> economyand <strong>the</strong> effect <strong>of</strong> market<strong>in</strong>g campaigns on <strong>the</strong>decision <strong>of</strong> young parents <strong>to</strong> send <strong>the</strong>ir children <strong>to</strong><strong>Welsh</strong>-medium schools.This paper has been concerned with address<strong>in</strong>gtwo pr<strong>in</strong>cipal research questions. Firstly, with<strong>in</strong> <strong>the</strong>limitations <strong>of</strong> <strong>the</strong> 2001 <strong>census</strong> <strong>of</strong> <strong>population</strong>, <strong>in</strong>moni<strong>to</strong>r<strong>in</strong>g <strong>the</strong> <strong>Welsh</strong> language, we have beenconcerned with demonstrat<strong>in</strong>g <strong>the</strong> <strong>trends</strong> that canbe gauged from an analysis <strong>of</strong> aggregate data at <strong>the</strong>unitary authority level and with compar<strong>in</strong>g such<strong>trends</strong> with those from o<strong>the</strong>r sources such as <strong>the</strong><strong>Welsh</strong> Local Labour Force Survey and with resultsfrom previous <strong>census</strong>es. Secondly, we have highlightedcurrent gaps <strong>in</strong> knowledge where <strong>the</strong> <strong>census</strong>is less useful <strong>to</strong> policymakers charged with <strong>in</strong>vestigat<strong>in</strong>gsuch <strong>trends</strong>. A number <strong>of</strong> research questionsarise from <strong>the</strong> aggregate analysis conducted <strong>to</strong> date,for example:• What effect has <strong>the</strong> changes <strong>in</strong> <strong>the</strong> nature <strong>of</strong> <strong>the</strong>question had on <strong>the</strong> overall f<strong>in</strong>d<strong>in</strong>gs? For example,changes <strong>in</strong> <strong>the</strong> way <strong>the</strong> question was phrased (from‘Can you?’ <strong>to</strong> ‘Do you?’) or <strong>the</strong> fact that respondents<strong>in</strong> <strong>the</strong> 2001 <strong>census</strong> were asked if <strong>the</strong>y unders<strong>to</strong>od<strong>the</strong> language? This led commenta<strong>to</strong>rs such asBalsom <strong>to</strong> state: ‘At last, it appears as if our <strong>of</strong>ficialstatisticians are tak<strong>in</strong>g some account <strong>of</strong> <strong>the</strong> complexity<strong>of</strong> <strong>the</strong> language situation <strong>in</strong> Wales. This<strong>in</strong>volves recogniz<strong>in</strong>g that, <strong>in</strong> a bil<strong>in</strong>gual community,<strong>the</strong> apparently straightforward question “Do youspeak <strong>Welsh</strong>” cannot be fully answered with a simpleYes or No’ (2003, 33).• What effect did <strong>the</strong> <strong>Welsh</strong> tick box controversyalluded <strong>to</strong> above have on <strong>the</strong> response <strong>to</strong> <strong>the</strong> question?Were those who put <strong>the</strong>ir ethnic identity as<strong>Welsh</strong> also <strong>Welsh</strong> speakers or more <strong>in</strong>cl<strong>in</strong>ed <strong>to</strong> say<strong>the</strong>y unders<strong>to</strong>od and spoke <strong>Welsh</strong> when <strong>the</strong>ydidn’t?• If <strong>the</strong>re are future <strong>census</strong>es, what additional questionscould be asked <strong>to</strong> provide more diagnosticmeasures <strong>of</strong> <strong>the</strong> evolv<strong>in</strong>g nature <strong>of</strong> <strong>the</strong> <strong>Welsh</strong>language?• If additional questions are rejected, how couldancillary surveys be used <strong>in</strong> conjunction with <strong>the</strong>basic <strong>census</strong> analysis <strong>to</strong> provide a more completepicture?• Does devolution necessarily imply that Walesneeds its own national statistical <strong>of</strong>fice? If so howmight language-related questions be imbedded <strong>in</strong>ma<strong>in</strong>stream socio-economic <strong>in</strong>vestigations, so that<strong>the</strong> reality <strong>of</strong> usage <strong>in</strong> all doma<strong>in</strong>s, ra<strong>the</strong>r than <strong>the</strong>potential conta<strong>in</strong>ed with<strong>in</strong> self-ascribed replies,<strong>in</strong>forms policy decisions.One policy area which is key <strong>to</strong> <strong>the</strong> <strong>trends</strong> notedfrom our aggregate analysis is education. It is <strong>the</strong>s<strong>in</strong>gle most important fac<strong>to</strong>r determ<strong>in</strong><strong>in</strong>g <strong>the</strong> <strong>to</strong>talnumbers <strong>of</strong> young people capable <strong>of</strong> speak<strong>in</strong>g <strong>Welsh</strong>.Critically, s<strong>in</strong>ce <strong>the</strong> Education Reform Act <strong>of</strong> 1988,<strong>Welsh</strong> has become a core subject <strong>in</strong> <strong>the</strong> nationalcurriculum <strong>of</strong> Wales for all children up until <strong>the</strong> age<strong>of</strong> 16. This has two broad implications. First it <strong>of</strong>fers<strong>the</strong> opportunity <strong>to</strong> acquire a range <strong>of</strong> bil<strong>in</strong>gual skillsfor all <strong>Welsh</strong> school children wherever <strong>the</strong>y areon <strong>the</strong> l<strong>in</strong>guistic cont<strong>in</strong>uum. Secondly it helps <strong>to</strong>ma<strong>in</strong>stream <strong>the</strong> bil<strong>in</strong>gual policies <strong>of</strong> <strong>the</strong> WAG,because now <strong>the</strong>re is a tacit understand<strong>in</strong>g that<strong>the</strong> language (<strong>in</strong> <strong>the</strong>ory) belongs <strong>to</strong> all, not just <strong>to</strong> adecl<strong>in</strong><strong>in</strong>g m<strong>in</strong>ority with<strong>in</strong> <strong>the</strong> country. The challengefac<strong>in</strong>g language planners is <strong>to</strong> ensure thatthose taught <strong>Welsh</strong> <strong>to</strong> age 16 cont<strong>in</strong>ue <strong>to</strong> have <strong>the</strong>opportunities <strong>to</strong> cont<strong>in</strong>ue speak<strong>in</strong>g <strong>the</strong> languageoutside <strong>the</strong> school environment. A second issue is<strong>the</strong> significant number <strong>of</strong> Adult <strong>Welsh</strong> learnerswho acquire skills <strong>in</strong> <strong>Welsh</strong> but who face difficulties<strong>in</strong>tegrat<strong>in</strong>g with<strong>in</strong> <strong>Welsh</strong>-speak<strong>in</strong>g networks,especially with<strong>in</strong> anglicized areas. This, <strong>in</strong> turn,po<strong>in</strong>ts <strong>to</strong> <strong>the</strong> need for a more disaggregate analysisas and when <strong>the</strong> detailed data from <strong>the</strong> <strong>census</strong> and<strong>the</strong> data sets be<strong>in</strong>g collected by <strong>the</strong> WLB becomeavailable.