Use of the census of population to discern trends in the Welsh ...
Use of the census of population to discern trends in the Welsh ...
Use of the census of population to discern trends in the Welsh ...

Create successful ePaper yourself
Turn your PDF publications into a flip-book with our unique Google optimized e-Paper software.
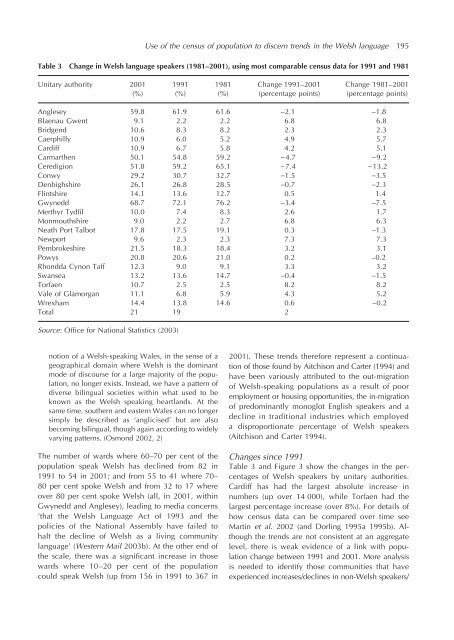
<strong>Use</strong> <strong>of</strong> <strong>the</strong> <strong>census</strong> <strong>of</strong> <strong>population</strong> <strong>to</strong> <strong>discern</strong> <strong>trends</strong> <strong>in</strong> <strong>the</strong> <strong>Welsh</strong> language 195Table 3 Change <strong>in</strong> <strong>Welsh</strong> language speakers (1981–2001), us<strong>in</strong>g most comparable <strong>census</strong> data for 1991 and 1981Unitary authority 2001(%)1991(%)1981(%)Change 1991–2001(percentage po<strong>in</strong>ts)Change 1981–2001(percentage po<strong>in</strong>ts)Anglesey 59.8 61.9 61.6 −2.1 −1.8Blaenau Gwent 9.1 2.2 2.2 6.8 6.8Bridgend 10.6 8.3 8.2 2.3 2.3Caerphilly 10.9 6.0 5.2 4.9 5.7Cardiff 10.9 6.7 5.8 4.2 5.1Carmar<strong>the</strong>n 50.1 54.8 59.2 −4.7 −9.2Ceredigion 51.8 59.2 65.1 −7.4 −13.2Conwy 29.2 30.7 32.7 −1.5 −3.5Denbighshire 26.1 26.8 28.5 −0.7 −2.3Fl<strong>in</strong>tshire 14.1 13.6 12.7 0.5 1.4Gwynedd 68.7 72.1 76.2 −3.4 −7.5Merthyr Tydfil 10.0 7.4 8.3 2.6 1.7Monmouthshire 9.0 2.2 2.7 6.8 6.3Neath Port Talbot 17.8 17.5 19.1 0.3 −1.3Newport 9.6 2.3 2.3 7.3 7.3Pembrokeshire 21.5 18.3 18.4 3.2 3.1Powys 20.8 20.6 21.0 0.2 –0.2Rhondda Cynon Taff 12.3 9.0 9.1 3.3 3.2Swansea 13.2 13.6 14.7 −0.4 −1.5Torfaen 10.7 2.5 2.5 8.2 8.2Vale <strong>of</strong> Glamorgan 11.1 6.8 5.9 4.3 5.2Wrexham 14.4 13.8 14.6 0.6 −0.2Total 21 19 2Source: Office for National Statistics (2003)notion <strong>of</strong> a <strong>Welsh</strong>-speak<strong>in</strong>g Wales, <strong>in</strong> <strong>the</strong> sense <strong>of</strong> ageographical doma<strong>in</strong> where <strong>Welsh</strong> is <strong>the</strong> dom<strong>in</strong>antmode <strong>of</strong> discourse for a large majority <strong>of</strong> <strong>the</strong> <strong>population</strong>,no longer exists. Instead, we have a pattern <strong>of</strong>diverse bil<strong>in</strong>gual societies with<strong>in</strong> what used <strong>to</strong> beknown as <strong>the</strong> <strong>Welsh</strong> speak<strong>in</strong>g heartlands. At <strong>the</strong>same time, sou<strong>the</strong>rn and eastern Wales can no longersimply be described as ‘anglicised’ but are alsobecom<strong>in</strong>g bil<strong>in</strong>gual, though aga<strong>in</strong> accord<strong>in</strong>g <strong>to</strong> widelyvary<strong>in</strong>g patterns. (Osmond 2002, 2)The number <strong>of</strong> wards where 60–70 per cent <strong>of</strong> <strong>the</strong><strong>population</strong> speak <strong>Welsh</strong> has decl<strong>in</strong>ed from 82 <strong>in</strong>1991 <strong>to</strong> 54 <strong>in</strong> 2001; and from 55 <strong>to</strong> 41 where 70–80 per cent spoke <strong>Welsh</strong> and from 32 <strong>to</strong> 17 whereover 80 per cent spoke <strong>Welsh</strong> (all, <strong>in</strong> 2001, with<strong>in</strong>Gwynedd and Anglesey), lead<strong>in</strong>g <strong>to</strong> media concerns‘that <strong>the</strong> <strong>Welsh</strong> Language Act <strong>of</strong> 1993 and <strong>the</strong>policies <strong>of</strong> <strong>the</strong> National Assembly have failed <strong>to</strong>halt <strong>the</strong> decl<strong>in</strong>e <strong>of</strong> <strong>Welsh</strong> as a liv<strong>in</strong>g communitylanguage’ (Western Mail 2003b). At <strong>the</strong> o<strong>the</strong>r end <strong>of</strong><strong>the</strong> scale, <strong>the</strong>re was a significant <strong>in</strong>crease <strong>in</strong> thosewards where 10–20 per cent <strong>of</strong> <strong>the</strong> <strong>population</strong>could speak <strong>Welsh</strong> (up from 156 <strong>in</strong> 1991 <strong>to</strong> 367 <strong>in</strong>2001). These <strong>trends</strong> <strong>the</strong>refore represent a cont<strong>in</strong>uation<strong>of</strong> those found by Aitchison and Carter (1994) andhave been variously attributed <strong>to</strong> <strong>the</strong> out-migration<strong>of</strong> <strong>Welsh</strong>-speak<strong>in</strong>g <strong>population</strong>s as a result <strong>of</strong> pooremployment or hous<strong>in</strong>g opportunities, <strong>the</strong> <strong>in</strong>-migration<strong>of</strong> predom<strong>in</strong>antly monoglot English speakers and adecl<strong>in</strong>e <strong>in</strong> traditional <strong>in</strong>dustries which employeda disproportionate percentage <strong>of</strong> <strong>Welsh</strong> speakers(Aitchison and Carter 1994).Changes s<strong>in</strong>ce 1991Table 3 and Figure 3 show <strong>the</strong> changes <strong>in</strong> <strong>the</strong> percentages<strong>of</strong> <strong>Welsh</strong> speakers by unitary authorities.Cardiff has had <strong>the</strong> largest absolute <strong>in</strong>crease <strong>in</strong>numbers (up over 14 000), while Torfaen had <strong>the</strong>largest percentage <strong>in</strong>crease (over 8%). For details <strong>of</strong>how <strong>census</strong> data can be compared over time seeMart<strong>in</strong> et al. 2002 (and Dorl<strong>in</strong>g 1995a 1995b). Although<strong>the</strong> <strong>trends</strong> are not consistent at an aggregatelevel, <strong>the</strong>re is weak evidence <strong>of</strong> a l<strong>in</strong>k with <strong>population</strong>change between 1991 and 2001. More analysisis needed <strong>to</strong> identify those communities that haveexperienced <strong>in</strong>creases/decl<strong>in</strong>es <strong>in</strong> non-<strong>Welsh</strong> speakers/