- Page 3 and 4:
Economic Commission for AfricaAfric
- Page 5 and 6:
Table of ContentsList of AcronymsFo
- Page 7 and 8:
8 Perspectives, Conclusions and Way
- Page 9 and 10:
6.5 Experiences from South Africa a
- Page 11 and 12:
5.4 HIV prevalence among young peop
- Page 13 and 14:
List of AcronymsACGSACRWCADFAfDBAGD
- Page 15:
UNAIDSUNDPUNECAUNESCOUNFPAUNICEFUNS
- Page 18 and 19:
Evidence pointing to the negative i
- Page 20 and 21:
This edition of the AWR is technica
- Page 22 and 23:
Wieringa is the Director of the Int
- Page 24 and 25:
The Centre appreciates the professi
- Page 26 and 27:
Design and piloting of the AGDIThe
- Page 28 and 29:
The AGDI’s socialblock investigat
- Page 30 and 31:
ensure that contraception is fully
- Page 32 and 33:
Demonstratecommitment throughthe el
- Page 34 and 35:
• Run these initiatives in tandem
- Page 36 and 37:
• Provide all institutions, which
- Page 38 and 39:
These compellinginstruments andinit
- Page 40 and 41:
ties where they are shown to exist;
- Page 42 and 43:
emphasize the inter-linkages betwee
- Page 44 and 45:
The role ofNational AdvisoryPanels
- Page 46 and 47:
The extent towhich women areeffecti
- Page 48 and 49:
Table 1.1Gender Status Index with b
- Page 50 and 51:
Table 1.2Correlation between women
- Page 52 and 53:
The AfricanWomen’s Protocoltheref
- Page 54 and 55:
ECONOMICRatificationReportingLawPol
- Page 56 and 57:
Example:Scoring of ratification of
- Page 58 and 59:
The AGDI is MDGsensitive, affording
- Page 60 and 61:
ownership of rural/urban plots, hou
- Page 62 and 63:
“Promoting the role of women in s
- Page 65 and 66:
Commitment to Women’sRights2Intro
- Page 67 and 68:
Figure 2.1Picture view of composite
- Page 69 and 70:
Box 2.1CEDAW Committee’s response
- Page 71 and 72:
given to women’s rights in nation
- Page 73 and 74:
is the elimination of discriminatio
- Page 75 and 76:
parities between the enactment and
- Page 77 and 78:
Table 2.6CEDAW Article 16 implement
- Page 79 and 80:
Table 2.7African Women’s Protocol
- Page 81 and 82:
Figure 2.2Prevalence of FGM/C in th
- Page 83 and 84:
following recommendations to Africa
- Page 85 and 86:
Commitment to AddressingViolence Ag
- Page 87 and 88:
mation dissemination, justice deliv
- Page 89 and 90:
Box 3.1Examples of country BPfA pri
- Page 91 and 92:
“Based on the [Protocol] and Adde
- Page 93 and 94:
tive monitoring. Civil Society Orga
- Page 95 and 96:
not given full meaning due to the l
- Page 97 and 98:
sexual harassment. Despite this gov
- Page 99 and 100:
ized anti-trafficking police agency
- Page 101 and 102:
under the Children’s Act of 1998
- Page 103:
account, African Governments and pa
- Page 106 and 107:
Overview of the education GSI resul
- Page 108 and 109:
EnrolmentThe enrolment subcomponent
- Page 110 and 111:
strates that such a situation signa
- Page 112 and 113:
part of both sexes, however, there
- Page 114 and 115:
Box 4.5Reversing adult illiteracy-
- Page 116 and 117:
Adopting a moregeneral approach,Tun
- Page 118 and 119:
HRE hasattracted limitedattention c
- Page 120 and 121:
education is delegated to the natio
- Page 122 and 123:
The promotion of Human Rights Educa
- Page 124 and 125:
• Strengthening the health sector
- Page 126 and 127:
Figure 5.1Overall Health GSI4.03.5C
- Page 128 and 129:
Table 5.2Child health sub-component
- Page 130 and 131:
Complementarydata on somecountries
- Page 132 and 133:
Box 5.3The importance of time-use s
- Page 134 and 135:
Table 5.6Composite table of the hea
- Page 136 and 137:
Countries are alsomaking progress i
- Page 138 and 139:
STIs and actions through strategies
- Page 140 and 141:
Box 5.7How some countries are addre
- Page 142 and 143:
Box 5.9Some insights into maternal
- Page 144 and 145: munity health), which render diffic
- Page 146 and 147: In Ethiopia, the contraceptive prev
- Page 148 and 149: Most countriesreport of extensivein
- Page 150 and 151: • Integrate HIV/AIDS concerns int
- Page 152 and 153: Table 6.1The GSI of the economic bl
- Page 154 and 155: It is estimated that66 per cent off
- Page 156 and 157: Table 6.3GSI on time use for Benin,
- Page 158 and 159: through income from informal sector
- Page 160 and 161: Box 6.3Case study of some aspects o
- Page 162 and 163: Access to resourcesThis is explaine
- Page 164 and 165: Table 6.7The GSI on levels of gende
- Page 166 and 167: Figure 6.7Composite scores on econo
- Page 168 and 169: It defines equal remuneration for w
- Page 170 and 171: ILO Convention 111 on Discriminatio
- Page 172 and 173: Lack of ratificationsnot withstandi
- Page 174 and 175: place/enterprise agreements, and wo
- Page 176 and 177: the World Bank and the Internationa
- Page 178 and 179: Box 6.8United Republic of Tanzania
- Page 180 and 181: Currently, thegovernment isalso see
- Page 182 and 183: Grassroots farmerinterest groups,su
- Page 184 and 185: The Beijing +5outcomes alsostress t
- Page 186 and 187: Box 6.10Mozambique’s support to w
- Page 188 and 189: Scores on financialand humanresourc
- Page 190 and 191: Some countries such as Ghana and So
- Page 192 and 193: policies, laws, pilot schemes invol
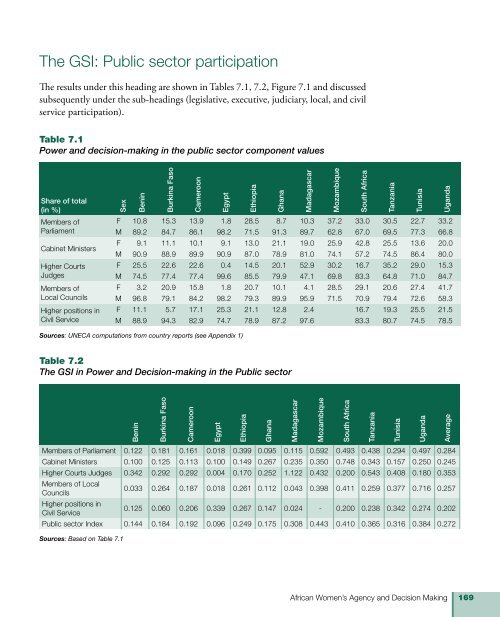
- Page 196 and 197: Figure 7.1The public sector compone
- Page 198 and 199: Higher court appointmentsCountry in
- Page 200 and 201: Table 7.5Decision-making GSI in Civ
- Page 202 and 203: Overview of the AWPS of the politic
- Page 204 and 205: tion addresses the impact of war on
- Page 206 and 207: at inculcating a culture of peace i
- Page 208 and 209: Box 7.4The experience of Ghana’s
- Page 210 and 211: work’. Madagascar has started pay
- Page 212 and 213: Mozambique,South Africa,Tanzania an
- Page 214 and 215: cal party, executive, ministerial,
- Page 216 and 217: the gender disparity in basic human
- Page 218 and 219: Women may notnecessarily bebetter o
- Page 220 and 221: Figure 8.1Comparison of indices for
- Page 222 and 223: Lack of co-operation/capacity of go
- Page 224 and 225: Recommended actions to improve the
- Page 226 and 227: Tremendous progress has been made i
- Page 229 and 230: ReferencesTechnical and Research Pu
- Page 231 and 232: Puechgirbal, N. 2004. Involving Wom
- Page 233 and 234: World Health Organisation WHO. 2008
- Page 235 and 236: Websiteshttp://www.mcc.gov/countrie
- Page 237 and 238: Egypt:1.2.3.4.5.Primary enrolment:
- Page 239 and 240: 4.Primary school completed: UN Offi
- Page 241 and 242: 2.3.4.Wages in civil service and in
- Page 243 and 244: Appendix Two: Graphs on the Child H
- Page 245 and 246:
BeninBurkina FasoCameroonEgyptEthio
- Page 247 and 248:
BeninBurkina FasoCameroonEgyptEthio
- Page 249 and 250:
Table A.3Overall AWPS ScoresBeninBu
- Page 251 and 252:
Appendix Four: The General Status o
- Page 253 and 254:
ate of incidence that they will not
- Page 255 and 256:
government Plans of Action, such as
- Page 257 and 258:
Scoring:0 - no research needs ident
- Page 259 and 260:
Appendix Six: Case Studies of Reser
- Page 262:
The African Women’s Report (2009)