2012 Annual Report - Stone Energy Corporation
2012 Annual Report - Stone Energy Corporation
2012 Annual Report - Stone Energy Corporation

Create successful ePaper yourself
Turn your PDF publications into a flip-book with our unique Google optimized e-Paper software.
<strong>2012</strong> ANNUAL REPORTAccelerating
Summary Financial and Reserve Data(In thousands, except per share and reserve data)Year Ended December 31, <strong>2012</strong> 2011 2010 2009* 2008*Oil, gas and natural gas liquids revenues $ 944,541 $ 864,565 $ 656,107 $ 711,295 $ 797,715Income (loss) from operations 263,965 311,000 165,154 (313,525) (1,513,973)Net income (loss) 149,426 194,332 96,429 (218,298) ** (1,146,932) ***Diluted earnings (loss) per common share $ 3.03 $ 3.97 $ 1.99 $ (4.97) $ (35.89)Weighted average shares outstanding (diluted) 48,361 48,030 47,706 43,953 31,961Net cash provided by operating activities $ 509,749 $ 570,850 $ 424,794 $ 507,787 $ 522,478Net cash used in investing activities (568,688) (679,250) (374,088) (316,079) (1,357,907)Net cash provided by (used in) financing activities 300,014 39,895 (13,043) (190,552) 428,440Total assets $ 2,776,431 $ 2,165,751 $ 1,679,090 $ 1,454,242 $ 2,109,852Long-term debt 914,126 620,000 575,000 575,000 825,000Stockholders’ equity 872,133 667,829 430,357 325,659 577,391Oil and condensate reserves (MBbls) 44,918 45,655 33,203 32,336 36,564Natural gas liquids reserves (MBbls) 18,066 4,405 — — —Gas reserves (MMcf) 395,374 325,479 274,705 216,694 299,554Total estimated proved reserves (MBoe) 128,881 104,307 78,987 68,452 86,489Total estimated proved reserves (MMcfe) 773,285 625,839 473,923 410,711 518,935* Adjusted to correct for immaterial errors that were discovered in 2010.** Includes an after-tax charge of $331 million due to a ceiling test write-down.*** Includes an after-tax charge of $861 million due to a ceiling test write-down and $466 million goodwill impairment.<strong>Stone</strong> <strong>Energy</strong> <strong>Corporation</strong> is an independent oil and natural gas exploration andproduction company headquartered in Lafayette, Louisiana, with additional officesin New Orleans, Houston and Morgantown, West Virginia. Our business strategyis to utilize cash flow generated from our existing conventional shelf Gulf of Mexicoproperties to:SGYProfitably grow oil reserves and production in areas with a materialimpact (Deep Water GOM , Onshore Oil);Profitably grow gas reserves and production in price-advantagedbasins (Appalachia, Gulf Coast Basin); andMaintain relatively stable GOM shelf oil production.
<strong>2012</strong> Significant EventsEstimated proved reserves increased to 129 MMboe, representing anannual increase of 24 percent and a production replacement of 285 percentIncreased average daily production rate for the year by 15 percent over 2011Acquired remaining 25 percent interest in the deep water Pompano fieldand successfully assumed operatorship of the fieldInitiated production from the La Cantera liquids rich deep gas discoveryAwarded 23 Gulf of Mexico blocks at lease sale 216/222 and enteredinto joint venture deal with Conoco on four deep water prospectsDrilled 23 horizontal wells and fractured 24 wells in the Marcellus shalein West Virginia, doubling production from 2011Completed a $300 million 1¾% Senior Convertible Notes offering due2017, issued $300 million 7.50% Senior Notes due 2022 and retiredour $200 million 2014 Senior Subordinated Notes<strong>2012</strong> <strong>Annual</strong> <strong>Report</strong> 1
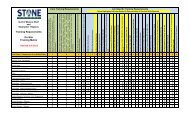
Dear Shareholders,In <strong>2012</strong>, we saw the acceleration of our strategy to shift our focus to the Gulf of Mexico (GOM) deepwater, Gulf Coast liquids rich deep gas and Appalachian Marcellus shale from our legacy GOM shelfoperations. This strategy has yielded over 20 percent compound annual growth rate in oil and gasreserves since 2009. By methodically investing in the Gulf of Mexico deep water, the Gulf Coast liquidsrich deep gas and the Marcellus shale, we have transformed <strong>Stone</strong> from a company in which nearly 80percent of our reserve base was located in our conventional shelf assets to a diversified company withover 80 percent of our reserves in our targeted growth areas.50,00040,00030,000Production Rate BOEPDIn addition to increasing reserves, we also increased annual production by 15 percent.Again, the volume growth was anchored by production from deep water, deep gas and theMarcellus shale. The acquisition of the deep water Pompano field, along with the start-upof our Pyrenees and Wideberth deep water fields, more than doubled our deep waterproduction. The accelerated development of the liquids rich deep gas La Cantera discoveryprovided us with a significant contribution to our <strong>2012</strong> volumes. Finally, in the Marcellusshale we increased production from 22 million cubic feet of gas equivalent (MMcfe) per dayin the fourth quarter of 2011 to 51 MMcfe per day in the fourth quarter of <strong>2012</strong>.20,00010,00002010 2011 <strong>2012</strong>Conventional ShelfMarcellus ShaleDeep WaterDeep GasIn the deep water, we consolidated our position in the strategic Pompano/Amberjackarea of the GOM. Early in the year, we took over full operations of the Pompano platformand then acquired the outstanding 25 percent working interest, giving <strong>Stone</strong> 100 percentworking interest in the platform. We completed several well-work projects on Pompanowells, boosting production during the year while reducing base lease operating costs byover 20 percent. Perhaps most importantly, we have matured development and explorationprojects in the greater Pompano/Amberjack area and now expect to initiate <strong>Stone</strong>-operatedopen water drilling in late 2013, followed by a platform drilling program in 2014. Additionally,we are evaluating other third party prospects that might tie into the Pompano facilities.<strong>Stone</strong> was also aggressive in the <strong>2012</strong> lease sale, adding 21 deep water lease blocks to our portfolio.As part of that effort, we entered into an attractive deep water exploration venture with ConocoPhillipson four prospects in the Mississippi Canyon area. We combined our high working interest lease blockswith newly acquired lease blocks through this partnership. This arrangement allowed <strong>Stone</strong> to leverageits acreage position for exploration capital. We are excited to be partnered with ConocoPhillips, and thepreliminary drilling schedule calls for the initial prospect to be drilled in 2014.2 <strong>Stone</strong> <strong>Energy</strong> <strong>Corporation</strong>
Reserves 2009Reserves <strong>2012</strong>Deep Water21%Deep Water34%Conventional Shelf18%Conventional Shelf79%Marcellus Shale44%Deep Gas4%68 MMBoe129 MMBoeWe enhanced deep water production with a full year’s volume from the Pyrenees field and the start-upof the Wideberth field. Wideberth was brought online in the second quarter via a subsea tie-back at aninitial gross rate of approximately 6,000 barrels of oil equivalent (Boe) per day. The Parmer explorationwell, located in the Green Canyon area, was drilled. It identified two previously undiscovered gas zonesand provided additional information on the original oil zone. A follow-up delineation well is expected to bedrilled after a full evaluation of recently completed seismic acquisition.In our Gulf Coast liquids rich deep gas initiative, we successfully drilled a second well in the La Canterafield in <strong>2012</strong> and are drilling a third well in the first half of 2013. The La Cantera field, one of the largestonshore Louisiana discoveries in the past ten years, is currently producing over 80 MMcfe per day (gross)and <strong>Stone</strong> holds a 35 percent working interest in the field. The production stream contains significantcondensate and natural gas liquids (NGLs) volumes, which serve to significantly enhance the financialresults. In addition, <strong>Stone</strong> acquired interests in two other high potential prospects within the same minibasinwith plans to drill exploratory wells in 2013 and 2014.Appalachia again provided significant reserve additions in <strong>2012</strong> and became a material productioncontributor for the company. By the end of <strong>2012</strong>, <strong>Stone</strong> had drilled a total of 64 horizontal wells yieldingestimated proved reserves in excess of 300 billion cubic feet of gas equivalent and producing over 50MMcfe per day. Our efforts in the Marcellus shale are focused in our Mary and Heather fields in WestVirginia where we receive the benefit of condensate and NGLs in the gas stream. The condensate andNGL volumes increase the overall effective realized gas price in these fields, boosting the economics ofthe play.Drilling efficiencies continued in <strong>2012</strong> as we drilled more wells, with longer horizontal laterals, and morefracture stages at a lower cost per well. Not only do these efficiencies drive the cost of the horizontalwells down, but by extending the length of the horizontal section of the well, they also increasethe expected ultimate recovery. We plan to maintain our focused Marcellus shale pad-drilling in thecondensate rich Mary and Heather fields with over 250 potential gross drilling locations remaining to bedrilled. In addition, <strong>Stone</strong> plans to test the economic viability of the Upper Devonian shale play, whichoverlays much of our existing Marcellus shale position. We expect 2013 to show continued productionand reserve growth in Appalachia.<strong>2012</strong> <strong>Annual</strong> <strong>Report</strong> 3
Our conventional shelf properties continue to provide us with production and cash flow to invest in ourgrowth areas. The focused recompletion and drilling program has helped to offset the natural decline ofthe conventional shelf. We will continue to focus our drilling activities on oil prospects, with emphasis onour Ship Shoal 113 Unit and Main Pass 288 oil field. We have made significant progress on the mandatedabandonment projects utilizing a more efficient liftboat to reduce overall cost. <strong>Stone</strong> was also able tonegotiate a “rigs to reef” program that should provide the win/win situation of creating a thriving naturalhabitat while reducing the expense of removing platforms.In <strong>2012</strong>, we added liquidity and flexibility to our balance sheet. During the year, we issued $300 millionSenior Convertible Notes due 2017 and $300 million Senior Notes due 2022 while retiring our $200million Senior Subordinated Notes due 2014. As a result, we exited the year with over $250 million incash, no bank debt, and the financial liquidity and flexibility to help fund our 2013 capital program.Looking forward, we will continue to accelerate our strategy to grow and diversify into the priceadvantaged and material impact areas of Appalachia, the Gulf Coast deep gas and the GOM deep water.The Marcellus shale provides <strong>Stone</strong> with long-lived reserves, predictable production and a multiyeardrilling program. The liquids rich deep gas program provides us with high impact wells that can bebrought on production quickly. Exploration and exploitation in the deep water provides us with exposureto significant upside potential.We are confident that we have the projects, the prospects and, most importantly, the people toaccelerate growth. This is an exciting time for <strong>Stone</strong> and we appreciate the confidence of you, ourshareholders.Sincerely,David H. WelchChairman, President and Chief Executive OfficerSenior ManagementDavid H. WelchChairman, President andChief Executive OfficerKenneth H. BeerExecutive Vice PresidentChief Financial OfficerAndrew L. Gates IIISenior Vice PresidentGeneral Counsel and SecretaryKevin G. HurstVice President – GOM Shelf/Deep GasE. J. LouviereSenior Vice President – LandJ. Kent PierretSenior Vice PresidentChief Accounting Officer and TreasurerKeith A. SeilhanVice President – Deep WaterRichard L. Toothman, Jr.Senior Vice President – AppalachiaPaul K. WiegVice President –Exploration and Business DevelopmentFlorence M. ZieglerVice President – Human Resources,Communication and Administration4 <strong>Stone</strong> <strong>Energy</strong> <strong>Corporation</strong>
UNITED STATESSECURITIES AND EXCHANGE COMMISSIONWASHINGTON, D.C. 20549FORM 10-K[X] ANNUAL REPORT PURSUANT TO SECTION 13 OR 15(d) OF THE SECURITIES EXCHANGE ACT OF 1934For the fiscal year ended December 31, <strong>2012</strong>or[ ] TRANSITION REPORT PURSUANT TO SECTION 13 OR 15(d) OF THE SECURITIES EXCHANGE ACT OF 1934For the transition period from _______ to _______Commission File Number: 1-12074STONE ENERGY CORPORATION(Exact name of registrant as specified in its charter)Delaware 72-1235413(State or other jurisdiction of(I.R.S. Employerincorporation or organization)Identification No.)625 E. Kaliste Saloom RoadLafayette, Louisiana 70508(Address of principal executive offices)(Zip Code)Registrant's telephone number, including area code: (337) 237-0410Securities registered pursuant to Section 12(b) of the Act:Title of each classCommon Stock, Par Value $.01 Per ShareName of each exchange on which registeredNew York Stock ExchangeSecurities registered pursuant to Section 12(g) of the Act:NoneIndicate by check mark if the registrant is a well-known seasoned issuer, as defined in Rule 405 of the Securities Act.[X] Yes [ ] NoIndicate by check mark if the registrant is not required to file reports pursuant to Section 13 or Section 15(d) of the Act.[ ] Yes [X] NoIndicate by check mark whether the registrant (1) has filed all reports required to be filed by Section 13 or 15(d) of the SecuritiesExchange Act of 1934 during the preceding 12 months (or for such shorter period that the registrant was required to file suchreports), and (2) has been subject to such filing requirements for the past 90 days. [X] Yes [ ] NoIndicate by check mark whether the registrant has submitted electronically and posted on its corporate Web site, if any, everyInteractive Data File required to be submitted and posted pursuant to Rule 405 of Regulation S-T (§232.405 of this chapter) duringthe preceding 12 months (or for such shorter period that the registrant was required to submit and post such files). [X] Yes [ ] NoIndicate by check mark if disclosure of delinquent filers pursuant to Item 405 of Regulation S-K (§229.405 of this chapter) is notcontained herein, and will not be contained, to the best of the registrant's knowledge, in definitive proxy or information statementsincorporated by reference in Part III of this Form 10-K or any amendment to this Form 10-K. [X]1
Indicate by check mark whether the registrant is a large accelerated filer, an accelerated filer, a non-accelerated filer, or a smallerreporting company. See the definitions of “large accelerated filer,” “accelerated filer” and “smaller reporting company” in Rule12b-2 of the Exchange Act.Large accelerated filer [X] Accelerated filer [ ] Non-accelerated filer [ ] Smaller reporting company [ ](Do not check if a smaller reporting company)Indicate by check mark whether the registrant is a shell company (as defined in Rule 12b-2 of the Act).[ ] Yes [X] NoThe aggregate market value of the voting stock held by non-affiliates of the registrant was approximately $1.2 billion as of June30, <strong>2012</strong> (based on the last reported sale price of such stock on the New York Stock Exchange Composite Tape on that day).As of February 21, 2013, the registrant had outstanding 49,259,243 shares of Common Stock, par value $.01 per share.Documents incorporated by reference: Portions of the Definitive Proxy Statement of <strong>Stone</strong> <strong>Energy</strong> <strong>Corporation</strong> relating to the<strong>Annual</strong> Meeting of Stockholders to be held on May 23, 2013 are incorporated by reference into Part III of this Form 10-K.2
TABLE OF CONTENTSPage No.PART IItem 1. Business ...................................................................................................................... 4Item 1A. Risk Factors ................................................................................................................ 10Item 1B. Unresolved Staff Comments ....................................................................................... 20Item 2. Properties .................................................................................................................... 20Item 3. Legal Proceedings ...................................................................................................... 24Item 4. Mine Safety Disclosures ............................................................................................ 25PART IIItem 5. Market for Registrant's Common Equity, Related Stockholder Matters and IssuerPurchases of Equity Securities .............................................................................. 25Item 6. Selected Financial Data .............................................................................................. 28Item 7. Management's Discussion and Analysis of Financial Condition andResults of Operations ............................................................................................ 29Item 7A. Quantitative and Qualitative Disclosures About Market Risk .................................... 38Item 8. Financial Statements and Supplementary Data .......................................................... 39Item 9. Changes in and Disagreements with Accountants on Accounting andFinancial Disclosure .............................................................................................. 40Item 9A. Controls and Procedures ............................................................................................. 40Item 9B. Other Information ....................................................................................................... 42PART IIIItem 10. Directors, Executive Officers and Corporate Governance ......................................... 42Item 11. Executive Compensation ............................................................................................ 43Item 12. Security Ownership of Certain Beneficial Owners and Management and RelatedStockholder Matters .............................................................................................. 43Item 13. Certain Relationships and Related Transactions, and Director Independence ........... 43Item 14. Principal Accounting Fees and Services..................................................................... 43PART IVItem 15. Exhibits, Financial Statement Schedules .................................................................... 44Index to Financial Statements .................................................................................... F-1Glossary of Certain Industry Terms ........................................................................... G-13
PART IThis section highlights information that is discussed in more detail in the remainder of the document. Throughout this document,we make statements that are classified as “forward-looking.” Please refer to the “Forward-Looking Statements” section of thisdocument for an explanation of these types of statements. We use the terms “<strong>Stone</strong>,” “<strong>Stone</strong> <strong>Energy</strong>,” “company,” “we,” “us” and“our” to refer to <strong>Stone</strong> <strong>Energy</strong> <strong>Corporation</strong> and its consolidated subsidiaries. Certain terms relating to the oil and gas industry aredefined in “Glossary of Certain Industry Terms,” which begins on page G-1 of this Form 10-K.ITEM 1. BUSINESSThe Company<strong>Stone</strong> <strong>Energy</strong> is an independent oil and natural gas company engaged in the acquisition, exploration, exploitation, developmentand operation of oil and gas properties. We have been operating in the Gulf Coast Basin since our incorporation in 1993 and haveestablished a technical and operational expertise in this area. We have expanded our reserve base outside of the conventional shelfof the Gulf of Mexico (“GOM”) and into the more prolific reserve basins of the GOM deep water and Gulf Coast deep gas, as wellas onshore oil and gas shale opportunities, including the Marcellus Shale in Appalachia. As of December 31, <strong>2012</strong>, our estimatedproved oil and natural gas reserves were approximately 773 Bcfe. We were incorporated in 1993 as a Delaware corporation. Ourcorporate headquarters are located at 625 E. Kaliste Saloom Road, Lafayette, Louisiana 70508. We have additional offices in NewOrleans, Louisiana, Houston, Texas and Morgantown, West Virginia.Strategy and Operational OverviewOur business strategy is to leverage cash flow generated from existing assets to maintain relatively stable GOM shelfproduction, profitably grow gas reserves and production in price-advantaged basins such as Appalachia and the Gulf Coast Basin,and profitably grow oil reserves and production in the deep water GOM and onshore oil areas.Gulf of Mexico — Deep Water. We believe that the deep water of the GOM is an attractive area to explore and operate, eventhough it involves high risk, high costs and substantial lead time to develop infrastructure. We have made two significantacquisitions that included two deep water platforms, producing reserves and numerous leases. We have also utilized subsea tiebacksin the deep water on new drill wells that require less capital than a deep water facility. We have made a significantinvestment in seismic data and leasehold interests and have assembled a technical team with prior geological, geophysical andengineering experience in the deep water arena to evaluate potential exploration, development and acquisition opportunities. Ourdeep water properties accounted for approximately 34% of our estimated proved oil and natural gas reserves at December 31, <strong>2012</strong>on a volume equivalent basis.Appalachia. During 2006, we began securing leasehold interests in the Appalachia regions of Pennsylvania and West Virginia.As of December 31, <strong>2012</strong>, we had leasehold interests in approximately 93,000 net acres. During <strong>2012</strong>, we drilled a total of 23horizontal Marcellus shale wells and fractured 24 wells. We expect to add leasehold interests and drill additional wells to furtherexpand our interests in Appalachia. Our Appalachian properties accounted for approximately 44% of our estimated proved oil andnatural gas reserves at December 31, <strong>2012</strong> on a volume equivalent basis.South Louisiana Gulf of Mexico — Deep Gas. The deep gas play provides us with high potential exploration opportunitieswith existing infrastructure nearby, which shortens the lead time to production. We have made two onshore south Louisiana deepgas discoveries and have identified other deep gas opportunities in south Louisiana. Additionally, our current property base in theGOM also contains multiple deep shelf exploration opportunities, which are defined as prospects below 15,000 feet. Our deepshelf gas properties accounted for approximately 4% of our estimated proved oil and natural gas reserves at December 31, <strong>2012</strong> ona volume equivalent basis.Gulf of Mexico — Conventional Shelf (Including Onshore Louisiana). We seek to generate cash flow from existing reservesand establish additional proved reserves through the drilling of new wells, workovers and recompletions of existing wells and theapplication of other techniques designed to provide production to help mitigate some of the natural decline of the GOMconventional shelf. Our GOM conventional shelf properties accounted for approximately 18% of our estimated proved oil andnatural gas reserves at December 31, <strong>2012</strong> on a volume equivalent basis.Onshore Oil. We maintain working interests in several undeveloped plays, which totaled approximately 92,000 net acres as ofDecember 31, <strong>2012</strong>. We have budgeted funds in 2013 for new venture opportunities. Our onshore oil properties accounted forless than 1% of our estimated proved oil and natural gas reserves at December 31, <strong>2012</strong> on a volume equivalent basis.4
Oil and Gas MarketingOur oil and natural gas production is sold at current market prices under short-term contracts. Shell Trading (US) Company,Phillips 66 Company and Conoco, Inc. accounted for approximately 41%, 18% and 13%, respectively, of our oil and natural gasrevenue generated during the year ended December 31, <strong>2012</strong>. We do not believe that the loss of any of our major purchaserswould result in a material adverse effect on our ability to market future oil and natural gas production. From time to time, we mayenter into transactions that hedge the price of oil and natural gas. See “Item 7A. Quantitative and Qualitative DisclosuresAbout Market Risk – Commodity Price Risk.”Competition and MarketsCompetition in the Gulf Coast Basin, the deep water and deep shelf GOM, the Gulf Coast onshore, the Appalachia region andother onshore oil plays is intense, particularly with respect to the acquisition of producing properties and undeveloped acreage.We compete with major oil and gas companies and other independent producers of varying sizes, all of which are engaged in theacquisition of properties and the exploration and development of such properties. Many of our competitors have financialresources and exploration and development budgets that are substantially greater than ours, which may adversely affect our abilityto compete. See “Item 1A. Risk Factors – Competition within our industry may adversely affect our operations.”The availability of a ready market for and the price of any hydrocarbons produced will depend on many factors beyond ourcontrol, including but not limited to the amount of domestic production and imports of foreign oil and liquefied natural gas, themarketing of competitive fuels, the proximity and capacity of oil and natural gas pipelines, the availability of transportation andother market facilities, the demand for hydrocarbons, the effect of federal and state regulation of allowable rates of production,taxation and the conduct of drilling operations and federal regulation of oil and natural gas. In addition, the restructuring of thenatural gas pipeline industry eliminated the gas purchasing activity of traditional interstate gas transmission pipeline buyers.Producers of natural gas have therefore been required to develop new markets among gas marketing companies, end users ofnatural gas and local distribution companies. All of these factors, together with economic factors in the marketing arena, generallymay affect the supply of and/or demand for oil and natural gas and thus the prices available for sales of oil and natural gas.RegulationOur oil and gas operations are subject to various U.S. federal, state and local laws and regulations.Various aspects of our oil and natural gas operations are regulated by administrative agencies of the states where we conductoperations and by certain agencies of the federal government for operations on federal leases. All of the jurisdictions in which weown or operate producing oil and natural gas properties have statutory provisions regulating the exploration for and production ofoil and natural gas, including provisions requiring permits for the drilling of wells and maintaining bonding requirements in orderto drill or operate wells, and provisions relating to the location of wells, the method of drilling and casing wells, the surface useand restoration of properties upon which wells are drilled and the abandonment of wells. Our operations are also subject to variousconservation laws and regulations. These include the regulation of the size of drilling and spacing units or proration units, thenumber of wells that may be drilled in an area and the unitization or pooling of oil and natural gas properties. In this regard, somestates can order the pooling or integration of tracts to facilitate exploration while other states rely on voluntary pooling of landsand leases. In addition, state conservation laws establish maximum rates of production from oil and natural gas wells, generallyprohibit the venting or flaring of natural gas and impose certain requirements regarding the ratability or fair apportionment ofproduction from fields and individual wells.Certain operations that we conduct are on federal oil and gas leases, which are administered by the Bureau of LandManagement (“BLM”) and the Bureau of Ocean <strong>Energy</strong> Management (“BOEM”), a successor agency to the MineralsManagement Service. These leases contain relatively standardized terms and require compliance with detailed BLM and BOEMregulations and orders pursuant to various federal laws, including the Outer Continental Shelf Lands Act, which are subject tochange by the applicable agency. Many onshore leases contain stipulations limiting activities that may be conducted on the lease.Some stipulations are unique to particular geographic areas and may limit the times during which activities on the lease may beconducted or the manner in which certain activities may be conducted or, in some cases, may ban any surface activity. For offshoreoperations, lessees must obtain BOEM approval for exploration, development and production plans prior to the commencement ofsuch operations. In addition to permits required from other agencies (such as the U.S. Environmental Protection Agency (“EPA”)),lessees must obtain a permit from the BLM or the BOEM, as applicable, prior to the commencement of drilling, and comply withregulations governing, among other things, engineering and construction specifications for production facilities, safety procedures,plugging and abandonment of wells on the Outer Continental Shelf (“OCS”) of the GOM, calculation of royalty payments and the5
valuation of production for this purpose, and removal of facilities. To cover the various obligations of lessees on the OCS, theBOEM generally requires that lessees post substantial bonds or other acceptable assurances that such obligations will be met,unless the BOEM exempts the lessee from such obligations. The cost of such bonds or other surety can be substantial, and we canprovide no assurance that we can continue to obtain bonds or other surety in all cases. Under certain circumstances, the BLM orthe Bureau of Safety and Environmental Enforcement (“BSEE”), a new federal agency created to enforce compliance with safetyand environmental rules of the OCS, as applicable, may require our operations on federal leases to be suspended or terminated.Any such suspension or termination could materially and adversely affect our financial condition and operations.Natural Gas. In 2005, the United States Congress enacted the <strong>Energy</strong> Policy Act of 2005 (“EPAct 2005”). Among othermatters, EPAct 2005 amends the Natural Gas Act (“NGA”) to make it unlawful for “any entity”, including otherwise nonjurisdictionalproducers such as <strong>Stone</strong> <strong>Energy</strong>, to use any deceptive or manipulative device or contrivance in connection with thepurchase or sale of natural gas or the purchase or sale of transportation services subject to regulation by the Federal <strong>Energy</strong>Regulatory Commission (“FERC”), in contravention of rules prescribed by the FERC. In 2006, the FERC issued rulesimplementing this provision. The rules make it unlawful in connection with the purchase or sale of natural gas subject to thejurisdiction of the FERC, or the purchase or sale of transportation services subject to the jurisdiction of the FERC, for any entity,directly or indirectly, to use or employ any device, scheme or artifice to defraud, to make any untrue statement of material fact oromit to make any such statement necessary to make the statements made not misleading or to engage in any act or practice thatoperates as a fraud or deceit upon any person. EPAct 2005 also gives the FERC authority to impose civil penalties for violationsof the NGA up to $1 million per day per violation. The new anti-manipulation rule does not apply to activities that relate only tointrastate or other non-jurisdictional sales or gathering but does apply to activities of otherwise non-jurisdictional entities to theextent the activities are conducted “in connection with” gas sales, purchases or transportation subject to FERC jurisdiction. Ittherefore reflects a significant expansion of the FERC’s enforcement authority. The U.S. Commodity Futures TradingCommission (“CFTC”) has similar authority with respect to energy futures commodity markets. <strong>Stone</strong> <strong>Energy</strong> does not anticipateit will be affected any differently by these requirements than other producers of natural gas.In 2007, the FERC issued Order No. 704 requiring that any market participant, including a producer such as <strong>Stone</strong> <strong>Energy</strong>, thatengages in sales for resale or purchases for resale of natural gas that equal or exceed 2.2 million MMBtus during a calendar year toannually report such sales or purchases to the FERC, beginning on May 1, 2009. These rules are intended to increase thetransparency of the wholesale natural gas markets and to assist the FERC in monitoring such markets and in detecting marketmanipulation. The monitoring and reporting required by these rules have increased our administrative costs. <strong>Stone</strong> <strong>Energy</strong> doesnot anticipate it will be affected any differently by these requirements than other producers of natural gas.Our sales of natural gas are affected by the availability, terms and cost of transportation. The price and terms for access topipeline transportation are subject to extensive regulation. In recent years, the FERC has undertaken various initiatives to increasecompetition within the natural gas industry. As a result of initiatives such as FERC Order No. 636, issued in April 1992, theinterstate natural gas transportation and marketing system has been substantially restructured to remove various barriers andpractices that historically limited non-pipeline natural gas sellers, including producers, from effectively competing with interstatepipelines for sales to local distribution companies and large industrial and commercial customers. The most significant provisionsof FERC Order No. 636 require that interstate pipelines provide firm and interruptible transportation service on an open accessbasis that is equal for all natural gas supplies. In many instances, the results of FERC Order No. 636 and related initiatives havebeen to substantially reduce or eliminate the interstate pipelines’ traditional role as wholesalers of natural gas in favor of providingonly storage and transportation services. Similarly, the natural gas pipeline industry is also subject to state regulations, which maychange from time to time in ways that affect the availability, terms and cost of transportation. However, we do not believe that anysuch changes would affect our business in a way that would be materially different from the way such changes would affect ourcompetitors.Oil. Effective November 4, 2009, pursuant to the <strong>Energy</strong> Independence and Security Act of 2007, the Federal TradeCommission (“FTC”) issued a rule prohibiting market manipulation in the petroleum industry. The FTC rule prohibits any person,directly or indirectly, in connection with the purchase or sale of crude oil, gasoline or petroleum distillates at wholesale, fromknowingly engaging in any act, practice or course of business, including the making of any untrue statement of material fact, thatoperates or would operate as a fraud or deceit upon any person or intentionally failing to state a material fact that under thecircumstances renders a statement made by such person misleading, provided that such omission distorts or is likely to distortmarket conditions for any such product. A violation of this rule may result in civil penalties of up to $1 million per day perviolation, in addition to any applicable penalty under the FTC Act.Our sales of crude oil, condensate and natural gas liquids are not currently regulated and are transacted at market prices. In anumber of instances, however, the ability to transport and sell such products is dependent on pipelines whose rates, terms andconditions of service are subject to FERC jurisdiction under the Interstate Commerce Act. The price we receive from the sale ofoil and natural gas liquids is affected by the cost of transporting those products to market. Interstate transportation rates for oil,6
natural gas liquids and other products are regulated by the FERC. The FERC has established an indexing system for suchtransportation, which allows such pipelines to take an annual inflation-based rate increase.In other instances, the ability to transport and sell such products is dependent on pipelines whose rates, terms and conditions ofservice are subject to regulation by state regulatory bodies under state statutes. As it relates to intrastate crude oil, condensate andnatural gas liquids pipelines, state regulation is generally less rigorous than the federal regulation of interstate pipelines. Stateagencies have generally not investigated or challenged existing or proposed rates in the absence of shipper complaints or protests,which are infrequent and are usually resolved informally.We do not believe that the regulatory decisions or activities relating to interstate or intrastate crude oil, condensate and naturalgas liquids pipelines will affect us in a way that materially differs from the way it affects other crude oil, condensate and naturalgas liquids producers or marketers.Miscellaneous. Additional proposals and proceedings that might affect the oil and gas industry are regularly considered by theUnited States Congress, state regulatory bodies, the FERC and the courts. We cannot predict when or whether any such proposalsmay become effective. In the past, the oil and natural gas industry has been heavily regulated. We can give no assurance that theregulatory approach currently pursued by the FERC or any other agency will continue indefinitely. We do not anticipate, however,that compliance with existing federal, state and local laws, rules and regulations will have a material or significantly adverse effecton our financial condition, results of operations or competitive position.Environmental RegulationAs a lessee and operator of onshore and offshore oil and gas properties in the United States, we are subject to stringent federal,state and local laws and regulations relating to environmental protection, as well as controlling the manner in which varioussubstances, including wastes generated in connection with oil and gas industry operations, are released into the environment.Compliance with these laws and regulations may require the acquisition of permits authorizing air emissions and wastewaterdischarge from operations and can affect the location or size of wells and facilities, limit or prohibit the extent to which explorationand development may be allowed and require proper closure of wells and restoration of properties that are being abandoned.Failure to comply with these laws and regulations may result in the assessment of administrative, civil or criminal penalties,imposition of remedial obligations, incurrence of capital costs to comply with governmental standards and even injunctions thatlimit or prohibit exploration and production operations or the disposal of substances generated in connection with oil and gasindustry operation.We currently operate or lease, and have in the past operated or leased, a number of properties that for many years have beenused for the exploration and production of oil and gas. Although we have utilized operating and disposal practices that werestandard in the industry at the time, hydrocarbons or wastes may have been disposed of or released on or under the propertiesoperated or leased by us or on or under other locations where such hydrocarbons or wastes have been taken for recycling ordisposal. In addition, many of these properties have been operated by third parties whose treatment and disposal or release ofhydrocarbons or wastes was not under our control. These properties and the hydrocarbons and wastes disposed thereon may besubject to laws and regulations imposing strict, joint and several liability, without regard to fault or the legality of the originalconduct, that could require us to remove or remediate previously disposed wastes or environmental contamination, or to performremedial plugging or pit closure to prevent future contamination.Oil Pollution Act. The Oil Pollution Act of 1990 (“OPA”) and regulations adopted pursuant thereto impose a variety ofrequirements related to the prevention of and response to oil spills into waters of the United States, including the OCS. The OPAsubjects owners of oil handling facilities to strict, joint and several liability for all containment and cleanup costs and certain otherdamages arising from a spill, including, but not limited to, the costs of responding to a release of oil to surface waters and naturalresource damages. Although defenses exist to the liability imposed by the OPA, they are limited. The OPA also requires ownersand operators of offshore oil production facilities to establish and maintain evidence of financial responsibility to cover costs thatcould be incurred in responding to an oil spill. The OPA currently requires a minimum financial responsibility demonstration of$35 million for companies operating on the OCS, although the Secretary of the Interior may increase this amount up to $150million in certain situations. We cannot predict at this time whether the OPA will be amended or whether the level of financialresponsibility required for companies operating on the OCS will be increased. In any event, if there were to occur an oil dischargeor substantial threat of discharge, we may be liable for costs and damages, which costs and damages could be material to ourresults of operations and financial position.Climate Change. In December 2009, the EPA determined that emissions of carbon dioxide, methane and other “greenhousegases” present an endangerment to public health and the environment because emissions of such gases are, according to the EPA,contributing to warming of the Earth’s atmosphere and other climatic changes. Based on these findings, the EPA has begunadopting and implementing regulations to restrict emissions of greenhouse gases under existing provisions of the Clean Air Act7
(“CAA”). The EPA adopted two sets of rules regulating greenhouse gas emissions under the CAA, one of which requires areduction in emissions of greenhouse gases from motor vehicles and the other of which regulates emissions of greenhouse gasesfrom certain large stationary sources, effective as of January 2, 2011. The EPA has also adopted rules requiring the reporting ofgreenhouse gas emissions from specified large greenhouse gas emission sources in the United States, on an annual basis, beginningin 2011 for emissions occurring in 2010, as well as certain onshore oil and natural gas production facilities, on an annual basis,beginning in <strong>2012</strong> for emissions occurring in 2011. We believe that we are in compliance with all greenhouse gas emissionsreporting requirements applicable to our operations.In addition, the United States Congress has from time to time considered adopting legislation to reduce emissions ofgreenhouse gases and almost one-half of the states have already taken legal measures to reduce emissions of greenhouse gasesprimarily through the planned development of greenhouse gas emission inventories and/or regional greenhouse gas cap and tradeprograms. Most of these cap and trade programs work by requiring major sources of emissions, such as electric power plants, ormajor producers of fuels, such as refineries and gas processing plants, to acquire and surrender emission allowances. The numberof allowances available for purchase is reduced each year in an effort to achieve the overall greenhouse gas emission reductiongoal.The adoption of legislation or regulatory programs to reduce emissions of greenhouse gases could require us to incur increasedoperating costs, such as costs to purchase and operate emissions control systems, to acquire emissions allowances or comply withnew regulatory or reporting requirements. Any such legislation or regulatory programs could also increase the cost of consuming,and thereby reduce demand for, the oil and natural gas we produce. Consequently, legislation and regulatory programs to reduceemissions of greenhouse gases could have an adverse effect on our business, financial condition and results of operations. Finally,it should be noted that some scientists have concluded that increasing concentrations of greenhouse gases in the Earth’satmosphere may produce climate changes that have significant physical effects, such as increased frequency and severity ofstorms, droughts, floods and other climatic events. If any such climate changes were to occur, they could have an adverse effect onour financial condition and results of operations.Hydraulic fracturing. Hydraulic fracturing is an important and common practice that is used to stimulate production ofhydrocarbons, particularly natural gas, from tight formations. The process involves the injection of water, sand and chemicalsunder pressure into the formation to fracture the surrounding rock and stimulate production. The process is typically regulated bystate oil and gas commissions. However, the EPA recently asserted federal regulatory authority over hydraulic fracturinginvolving diesel additives under the Safe Drinking Water Act’s (“SDWA”) Underground Injection Control Program. The EPA hasalso commenced a study of the potential environmental impacts of hydraulic fracturing activities on water resources. The EPA’sstudy includes 18 separate research projects addressing topics such as water acquisitions, chemical mining, well injections,flowback and produced water, wastewater treatment and waste disposal. The EPA has indicated that it expects to issue its studyreport in late 2014. In addition, a number of other federal agencies, including the U.S. Department of <strong>Energy</strong>, the U.S. Departmentof the Interior, and the White House Council on Environmental Quality, are studying various aspects of hydraulic fracturing.Legislation has been introduced before the United States Congress to provide for federal regulation of hydraulic fracturing and torequire disclosure of the chemicals used in the fracturing process. In addition, some states have adopted, and other states areconsidering adopting, regulations that could impose more stringent permitting, disclosure and well construction requirements onhydraulic fracturing operations. For example, Pennsylvania, Texas, Colorado and Wyoming have each adopted a variety of wellconstruction, set back and disclosure regulations limiting how fracturing can be performed and requiring various degrees ofchemical disclosure. If new laws or regulations that significantly restrict hydraulic fracturing are adopted, such laws could make itmore difficult or costly for us to perform fracturing to stimulate production from tight formations. In addition, if hydraulicfracturing becomes regulated at the federal level as a result of federal legislation or regulatory initiatives by the EPA, ourfracturing activities could become subject to additional permitting requirements, and also to attendant permitting delays andpotential increases in costs. Restrictions on hydraulic fracturing could impact the timing of production and may also reduce theamount of oil and natural gas that we are ultimately able to produce from our reserves.Air emissions. In August <strong>2012</strong>, the EPA adopted new rules that establish air emission controls for oil and natural gasproduction and natural gas processing operations. Specifically, the EPA established New Source Performance Standards toaddress emissions of sulfur dioxide and volatile organic compounds (“VOCs”) and a separate set of emission standards to addresshazardous air pollutants frequently associated with oil and natural gas production and processing activities. The EPA’s rulesrequire the reduction of VOC emissions from oil and natural gas production facilities by mandating the use of “green completions”for hydraulic fracturing, which requires the operator to recover rather than vent the gas and natural gas liquids that come to thesurface during completion of the fracturing process. The requirement for flaring of gas not sent to a gathering line becameeffective on October 15, <strong>2012</strong>, and all operators are required to use “green completions” drilling equipment beginning January 1,2015. The rules also establish specific requirements regarding emissions from compressors, dehydrators, storage tanks and otherproduction equipment. In addition, the rules establish new leak detection requirements for natural gas processing plants. Theserules may require a number of modifications to our operations including the installation of new equipment. Compliance with such8
ules could result in significant costs, including increased capital expenditures and operating costs, and could adversely impact ourbusiness.We have made, and will continue to make, expenditures in our effort to comply with environmental laws and regulations. Webelieve that we are in substantial compliance with applicable environmental laws and regulations in effect and that continuedcompliance with existing requirements will not have a material adverse impact on us. However, we also believe that it isreasonably likely that the trend in environmental legislation and regulation will continue toward stricter standards and, thus, wecannot give any assurance that we will not be adversely affected in the future.We have established internal guidelines to be followed in order to comply with environmental laws and regulations in theUnited States. We employ a safety department whose responsibilities include providing assurance that our operations are carriedout in accordance with applicable environmental guidelines and safety precautions. Although we maintain pollution insurance tocover a portion of the costs of cleanup operations, public liability and physical damage, there is no assurance that such insurancewill be adequate to cover all such costs or that such insurance will continue to be available in the future. To date, we believe thatcompliance with existing requirements of such governmental bodies has not had a material effect on our operations.EmployeesOn February 21, 2013, we had 386 full-time employees. We believe that our relationships with our employees are satisfactory.None of our employees are covered by a collective bargaining agreement. We utilize the services of independent contractors toperform various daily operational duties.Available InformationWe make available free of charge on our Internet web-site (www.stoneenergy.com) our <strong>Annual</strong> <strong>Report</strong> on Form 10-K,Quarterly <strong>Report</strong>s on Form 10-Q, Current <strong>Report</strong>s on Form 8-K and other filings pursuant to Section 13(a) or 15(d) of theSecurities Exchange Act of 1934, as amended (“Exchange Act”), and amendments to such filings, as soon as reasonablypracticable after each are electronically filed with, or furnished to, the Securities and Exchange Commission (“SEC”). We alsomake available on our Internet web-site our Code of Business Conduct and Ethics, Corporate Governance Guidelines and Audit,Compensation and Nominating and Governance Committee Charters, which have been approved by our board of directors. Wewill make timely disclosure by a Current <strong>Report</strong> on Form 8-K and on our web-site of any change to, or waiver from, the Code ofBusiness Conduct and Ethics for our principal executive and senior financial officers. A copy of our Code of Business Conductand Ethics is also available free of charge by writing us at: Chief Financial Officer, <strong>Stone</strong> <strong>Energy</strong> <strong>Corporation</strong>, P.O. Box 52807,Lafayette, LA 70505. The annual CEO certification required by Section 303A.12 of the New York Stock Exchange ListedCompany Manual was submitted on June 5, <strong>2012</strong>.Forward-Looking StatementsThe information in this Form 10-K includes “forward-looking statements” within the meaning of Section 27A of the SecuritiesAct of 1933, as amended (“Securities Act”), and Section 21E of the Exchange Act. All statements, other than statements ofhistorical or current facts, that address activities, events, outcomes and other matters that we plan, expect, intend, assume, believe,budget, predict, forecast, project, estimate or anticipate (and other similar expressions) will, should or may occur in the future areforward-looking statements. These forward-looking statements are based on management’s current belief, based on currentlyavailable information, as to the outcome and timing of future events. When considering forward-looking statements, you shouldkeep in mind the risk factors and other cautionary statements in this Form 10-K.Forward-looking statements appear in a number of places and include statements with respect to, among other things:any expected results or benefits associated with our acquisitions;expected results from risked weighted drilling success;estimates of our future oil and natural gas production, including estimates of any increases in oil and gas production;planned capital expenditures and the availability of capital resources to fund capital expenditures;our outlook on oil and gas prices;estimates of our oil and gas reserves;any estimates of future earnings growth;the impact of political and regulatory developments;our outlook on the resolution of pending litigation and government inquiry;estimates of the impact of new accounting pronouncements on earnings in future periods;9
our future financial condition or results of operations and our future revenues and expenses;our access to capital and our anticipated liquidity;estimates of future income taxes; andour business strategy and other plans and objectives for future operations.We caution you that these forward-looking statements are subject to all of the risks and uncertainties, many of which arebeyond our control, incident to the exploration for and development, production and marketing of oil and natural gas. These risksinclude, among other things:commodity price volatility;consequences of a catastrophic event like the Deepwater Horizon oil spill;domestic and worldwide economic conditions;the availability of capital on economic terms to fund our capital expenditures and acquisitions;our level of indebtedness;declines in the value of our oil and gas properties resulting in a decrease in our borrowing base under our bank creditfacility and ceiling test write-downs and impairments;our ability to replace and sustain production;the impact of a financial crisis on our business operations, financial condition and ability to raise capital;the ability of financial counterparties to perform or fulfill their obligations under existing agreements;third party interruption of sales to market;inflation;lack of availability and cost of goods and services;regulatory and environmental risks associated with drilling and production activities;drilling and other operating risks;unsuccessful exploration and development drilling activities;hurricanes and other weather conditions;adverse effects of changes in applicable tax, environmental, derivatives and other regulatory legislation, includingchanges affecting our offshore and Appalachian operations;uncertainty inherent in estimating proved oil and natural gas reserves and in projecting future rates of production andtiming of development expenditures; andother risks described in this Form 10-K.Should one or more of the risks or uncertainties described above or elsewhere in this Form 10-K occur, or should underlyingassumptions prove incorrect, our actual results and plans could differ materially from those expressed in any forward-lookingstatements. We specifically disclaim all responsibility to publicly update any information contained in a forward-looking statementor any forward-looking statement in its entirety and therefore disclaim any resulting liability for potentially related damages. Allforward-looking statements attributable to us are expressly qualified in their entirety by this cautionary statement.ITEM 1A. RISK FACTORSOur business is subject to a number of risks including, but not limited to, those described below:New regulatory requirements and permitting procedures imposed by the BOEM could significantly delay our ability toobtain permits to drill new wells in offshore waters.Subsequent to the Deepwater Horizon incident in the GOM in April 2010, the BOEM issued a series of “Notice to Lessees”(“NTLs”) imposing new regulatory requirements and permitting procedures for new wells to be drilled in federal waters of theOCS. These new regulatory requirements include the following:The Environmental NTL, which imposes new and more stringent requirements for documenting theenvironmental impacts potentially associated with the drilling of a new offshore well and significantly increasesoil spill response requirements.The Compliance and Review NTL, which imposes requirements for operators to secure independent reviews ofwell design, construction and flow intervention processes and also requires certifications of compliance fromsenior corporate officers.10
The Drilling Safety Rule, which prescribes tighter cementing and casing practices, imposes standards for the useof drilling fluids to maintain well bore integrity and stiffens oversight requirements relating to blowoutpreventers and their components, including shear and pipe rams.The Workplace Safety Rule, which requires operators to employ a comprehensive safety and environmentalmanagement system (“SEMS”) to reduce human and organizational errors as root causes of work-relatedaccidents and offshore spills and to have their SEMS periodically audited by an independent third party auditorapproved by the BSEE.Since the adoption of these new regulatory requirements, the BOEM has been taking much longer to review and approvepermits for new wells than was common prior to the Deepwater Horizon incident. The new rules also increase the cost ofpreparing each permit application and will increase the cost of each new well, particularly for wells drilled in deeper waters on theOCS. We could become subject to fines, penalties or orders requiring us to modify or suspend our operations in the GOM if wefail to comply with the BOEM’s NTLs or other regulatory requirements.Oil and natural gas prices are volatile. Declines in commodity prices have adversely affected, and in the future mayadversely affect, our financial condition and results of operations, cash flows, access to the capital markets and ability togrow.Our revenues, cash flows, profitability and future rate of growth substantially depend upon the market prices of oil and naturalgas. Prices affect our cash flow available for capital expenditures and our ability to access funds under our bank credit facility andthrough the capital markets. The amount available for borrowing under our bank credit facility is subject to a borrowing base,which is determined by our lenders taking into account our estimated proved reserves, and is subject to periodic redeterminationsbased on pricing models determined by the lenders at such time. If commodity prices decline in the future, the decline could haveadverse effects on our reserves and borrowing base.The prices we receive for our oil and natural gas depend upon factors beyond our control, including, among others:changes in the supply of and demand for oil and natural gas;market uncertainty;level of consumer product demands;hurricanes and other weather conditions;domestic governmental regulations and taxes;price and availability of alternative fuels;political and economic conditions in oil producing countries, particularly those in the Middle East, Russia, SouthAmerica and Africa;actions by the Organization of Petroleum Exporting Countries;foreign supply of oil and natural gas;price of oil and natural gas imports; andoverall domestic and foreign economic conditions.These factors make it very difficult to predict future commodity price movements with any certainty. Substantially all of ouroil and natural gas sales are made in the spot market or pursuant to contracts based on spot market prices and are not long-termfixed price contracts. Further, oil prices and natural gas prices do not necessarily fluctuate in direct relation to each other.We may not be able to replace production with new reserves.In general, the volume of production from oil and gas properties declines as reserves are depleted. The decline rates depend onreservoir characteristics. GOM reservoirs tend to be recovered quickly through production with associated steep declines, whiledeclines in other regions after initial flush production tend to be relatively low. Approximately 18% of our estimated provedreserves at December 31, <strong>2012</strong> (by volume) and 56% of our production during <strong>2012</strong> were associated with our Gulf Coast Basinconventional shelf properties. Our reserves will decline as they are produced unless we acquire properties with proved reserves orconduct successful development and exploration drilling activities. Our future natural gas and oil production is highly dependentupon our level of success in finding or acquiring additional reserves at a unit cost that is sustainable at prevailing commodityprices.11
Exploring for, developing or acquiring reserves is capital intensive and uncertain. We may not be able to economically find,develop, acquire additional reserves or make the necessary capital investments if our cash flows from operations decline orexternal sources of capital become limited or unavailable. We cannot assure you that our future exploitation, exploration,development and acquisition activities will result in additional proved reserves or that we will be able to drill productive wells atacceptable costs.Our actual recovery of reserves may substantially differ from our proved reserve estimates.This Form 10-K contains estimates of our proved oil and natural gas reserves and the estimated future net cash flows from suchreserves. These estimates are based upon various assumptions, including assumptions required by the SEC relating to oil andnatural gas prices, drilling and operating expenses, capital expenditures, taxes and availability of funds. The process of estimatingoil and natural gas reserves is complex. This process requires significant decisions and assumptions in the evaluation of availablegeological, geophysical, engineering and economic data for each reservoir and is therefore inherently imprecise. Additionally, ourinterpretations of the rules governing the estimation of proved reserves could differ from the interpretation of staff members ofregulatory authorities resulting in estimates that could be challenged by these authorities.Actual future production, oil and natural gas prices, revenues, taxes, development expenditures, operating expenses andquantities of recoverable oil and gas reserves will most likely vary from those estimated. Any significant variance could materiallyaffect the estimated quantities and present value of reserves set forth in this Form 10-K and the information incorporated byreference. Our properties may also be susceptible to hydrocarbon drainage from production by other operators on adjacentproperties. In addition, we may adjust estimates of proved reserves to reflect production history, results of exploration anddevelopment, prevailing oil and natural gas prices and other factors, many of which are beyond our control.You should not assume that any present value of future net cash flows from our producing reserves contained in this Form 10-K represents the market value of our estimated oil and natural gas reserves. We base the estimated discounted future net cashflows from our proved reserves at December 31, <strong>2012</strong> on average 12-month prices and costs as of the date of the estimate. Actualfuture prices and costs may be materially higher or lower. Further, actual future net revenues will be affected by factors such asthe amount and timing of actual development expenditures, the rate and timing of production and changes in governmentalregulations or taxes. At December 31, <strong>2012</strong>, approximately 44% of our estimated proved reserves (by volume) wereundeveloped. Recovery of undeveloped reserves generally requires significant capital expenditures and successful drillingoperations. Our reserve estimates include the assumption that we will make significant capital expenditures to develop theseundeveloped reserves and the actual costs, development schedule and results associated with these properties may not be asestimated. In addition, the 10% discount factor that we use to calculate the net present value of future net revenues and cash flowmay not necessarily be the most appropriate discount factor based on our cost of capital in effect from time to time and the risksassociated with our business and the oil and gas industry in general.We require substantial capital expenditures to conduct our operations and replace our production, and we may beunable to obtain needed financing on satisfactory terms necessary to fund our planned capital expenditures.We spend and will continue to spend a substantial amount of capital for the acquisition, exploration, exploitation, developmentand production of oil and gas reserves. If low oil and natural gas prices, operating difficulties or other factors, many of which arebeyond our control, cause our revenues and cash flows from operating activities to decrease, we may be limited in our ability tofund the capital necessary to complete our capital expenditures program. In addition, if our borrowing base under our bank creditfacility is redetermined to a lower amount, this could adversely affect our ability to fund our planned capital expenditures. Afterutilizing our available sources of financing, we may be forced to raise additional debt or equity proceeds to fund such capitalexpenditures. We cannot assure you that additional debt or equity financing will be available or cash flows provided by operationswill be sufficient to meet these requirements.Our estimates of future asset retirement obligations may vary significantly from period to period.We are required to record a liability for the discounted present value of our asset retirement obligations to plug and abandoninactive, non-producing wells, to remove inactive or damaged platforms, facilities and equipment, and to restore the land or seabedat the end of oil and natural gas production operations. These costs are typically considerably more expensive for offshoreoperations as compared to most land-based operations due to increased regulatory scrutiny and the logistical issues associated withworking in waters of various depths. Estimating future restoration and removal costs in the GOM is especially difficult becausemost of the removal obligations may be many years in the future, regulatory requirements are subject to change or more restrictiveinterpretation and asset removal technologies are constantly evolving, which may result in additional or increased costs. As aresult, we may make significant increases or decreases to our estimated asset retirement obligations in future periods. For example,12
ecause we operate in the GOM, platforms, facilities and equipment are subject to damage or destruction as a result of hurricanes.The estimated cost to plug and abandon a well or dismantle a platform can change dramatically if the host platform from which thework was anticipated to be performed is damaged or toppled rather than structurally intact. Accordingly, our estimate of futureasset retirement obligations could differ dramatically from what we may ultimately incur as a result of damage from a hurricane.A financial crisis may impact our business and financial condition. A financial crisis may adversely impact our ability toobtain funding under our current bank credit facility or in the capital markets.The credit crisis and related turmoil in the global financial systems had an impact on our business and our financial condition.An economic crisis could reduce the demand for oil and natural gas and put downward pressure on the prices for oil and naturalgas. Historically, we have used our cash flow from operating activities and borrowings under our bank credit facility to fund ourcapital expenditures and have relied on the capital markets and asset monetization transactions to provide us with additional capitalfor large or exceptional transactions. In the future, we may not be able to access adequate funding under our bank credit facility asa result of (i) a decrease in our borrowing base due to the outcome of a borrowing base redetermination, or (ii) an unwillingness orinability on the part of our lending counterparties to meet their funding obligations. In addition, we may face limitations on ourability to access the debt and equity capital markets and complete asset sales, an increased counterparty credit risk on ourderivatives contracts and the requirement by contractual counterparties of us to post collateral guaranteeing performance.Our debt level and the covenants in the current and any future agreements governing our debt could negatively impactour financial condition, results of operations and business prospects.The terms of the current agreements governing our debt impose significant restrictions on our ability to take a number ofactions that we may otherwise desire to take, including:incurring additional debt;paying dividends on stock, redeeming stock or redeeming subordinated debt;making investments;creating liens on our assets;selling assets;guaranteeing other indebtedness;entering into agreements that restrict dividends from our subsidiary to us;merging, consolidating or transferring all or substantially all of our assets; andentering into transactions with affiliates.Our level of indebtedness, and the covenants contained in current and future agreements governing our debt, could haveimportant consequences on our operations, including:making it more difficult for us to satisfy our obligations under the indentures or other debt and increasing the risk thatwe may default on our debt obligations;requiring us to dedicate a substantial portion of our cash flow from operating activities to required payments on debt,thereby reducing the availability of cash flow for working capital, capital expenditures and other general businessactivities;limiting our ability to obtain additional financing in the future for working capital, capital expenditures, acquisitionsand other general business activities;limiting our flexibility in planning for, or reacting to, changes in our business and the industry in which we operate;detracting from our ability to successfully withstand a downturn in our business or the economy generally;placing us at a competitive disadvantage against other less leveraged competitors; andmaking us vulnerable to increases in interest rates, because debt under our bank credit facility is at variable rates.We may be required to repay all or a portion of our debt on an accelerated basis in certain circumstances. If we fail to complywith the covenants and other restrictions in the agreements governing our debt, it could lead to an event of default and theacceleration of our repayment of outstanding debt. Our ability to comply with these covenants and other restrictions may beaffected by events beyond our control, including prevailing economic and financial conditions. Our borrowing base under ourbank credit facility, which is redetermined semi-annually, is based on an amount established by the bank group after its evaluationof our proved oil and gas reserve values. Our borrowing base is scheduled to be redetermined by May 2013. Upon aredetermination, if borrowings in excess of the revised borrowing capacity were outstanding, we could be forced to repay a portionof our bank debt.13
We may not have sufficient funds to make such repayments. If we are unable to repay our debt out of cash on hand, we couldattempt to refinance such debt, sell assets or repay such debt with the proceeds from an equity offering. We cannot assure you thatwe will be able to generate sufficient cash flow from operating activities to pay the interest on our debt or that future borrowings,equity financings or proceeds from the sale of assets will be available to pay or refinance such debt. The terms of our debt,including our bank credit facility and our indentures, may also prohibit us from taking such actions. Factors that will affect ourability to raise cash through offerings of our capital stock, a refinancing of our debt or a sale of assets include financial marketconditions and our market value and operating performance at the time of such offerings, refinancing or sale of assets. We cannotassure you that any such offerings, refinancing or sale of assets can be successfully completed.We have experienced significant shut-ins and losses of production due to the effects of hurricanes in the GOMApproximately 18% of our estimated proved reserves at December 31, <strong>2012</strong> (by volume) and 56% of our production during<strong>2012</strong> were associated with our Gulf Coast Basin conventional shelf properties. Approximately 38% of our estimated provedreserves at December 31, <strong>2012</strong> (by volume) and 27% of our production during <strong>2012</strong> were associated with our GOM deep waterand deep shelf gas properties. Accordingly, if the level of production from these properties substantially declines, it could have amaterial adverse effect on our overall production level and our revenue. We are particularly vulnerable to significant risk fromhurricanes and tropical storms in the GOM. In past years, we have experienced shut-ins and losses of production due to the effectsof hurricanes in the GOM. We are unable to predict what impact future hurricanes and tropical storms might have on our futureresults of operations and production.Our acreage must be drilled before lease expiration in order to hold the acreage by production. If natural gas pricesremain depressed for an extended period of time, it might not be economical for us to drill sufficient wells in order to holdacreage, which could result in the expiry of a portion of our acreage, which could have an adverse effect on our business.Unless production is established within the spacing units covering the undeveloped acres on which some of the locations areidentified, the leases for such acreage may expire. See “Item 2. Properties – Productive Well and Acreage Data.”The marketability of our production depends mostly upon the availability, proximity and capacity of oil and natural gasgathering systems, pipelines and processing facilities.The marketability of our production depends upon the availability, proximity, operation and capacity of oil and natural gasgathering systems, pipelines and processing facilities. The unavailability or lack of capacity of these gathering systems, pipelinesand processing facilities could result in the shut-in of producing wells or the delay or discontinuance of development plans forproperties. The disruption of these gathering systems, pipelines and processing facilities due to maintenance and/or weather couldnegatively impact our ability to market and deliver our products. Federal, state and local regulation of oil and gas production andtransportation, general economic conditions and changes in supply and demand could adversely affect our ability to produce andmarket our oil and natural gas. If market factors changed dramatically, the financial impact on us could be substantial. Theavailability of markets and the volatility of product prices are beyond our control and represent a significant risk.We may not receive payment for a portion of our future production.We may not receive payment for a portion of our future production. We have attempted to diversify our sales and obtain creditprotections such as parental guarantees from certain of our purchasers. The tightening of credit in the financial markets may makeit more difficult for customers to obtain financing and, depending on the degree to which this occurs, there may be a materialincrease in the nonpayment and nonperformance by customers. We are unable to predict, however, what impact the financialdifficulties of certain purchasers may have on our future results of operations and liquidity.Our actual production could differ materially from our forecasts.From time to time, we provide forecasts of expected quantities of future oil and gas production. These forecasts are based on anumber of estimates, including expectations of production from existing wells. In addition, our forecasts assume that none of therisks associated with our oil and gas operations summarized in this Item 1A occur, such as facility or equipment malfunctions,adverse weather effects, or significant declines in commodity prices or material increases in costs, which could make certainproduction uneconomical.14
Lower oil and gas prices and other factors have resulted, and in the future may result, in ceiling test write-downs and otherimpairments of our asset carrying values.We use the full cost method of accounting for our oil and gas operations. Accordingly, we capitalize the cost to acquire, explorefor and develop oil and gas properties. Under the full cost method of accounting, we compare, at the end of each financialreporting period for each cost center, the present value of estimated future net cash flows from proved reserves (based on a 12-month average hedge adjusted commodity price and excluding cash flows related to estimated abandonment costs), to the netcapitalized costs of proved oil and gas properties, net of related deferred taxes. We refer to this comparison as a “ceiling test.” Ifthe net capitalized costs of proved oil and gas properties exceed the estimated discounted future net cash flows from provedreserves, we are required to write-down the value of our oil and gas properties to the value of the estimated discounted future netcash flows. A write-down of oil and gas properties does not impact cash flow from operating activities, but does reduce netincome. We also assess the carrying amount of goodwill when events occur that may indicate an impairment exists. These eventsinclude, for example, a significant decline in oil and gas prices or a decline in our market capitalization. The risk that we will berequired to write-down the carrying value of oil and gas properties and goodwill increases when oil and natural gas prices are lowor volatile. In addition, write-downs may occur if we experience substantial downward adjustments to our estimated provedreserves or our undeveloped property values, or if estimated future development costs increase. Volatility in commodity prices,poor conditions in the global economic markets and other factors could cause us to record additional write-downs of our oil andnatural gas properties and other assets in the future and incur additional charges against future earnings.There are uncertainties in successfully integrating our acquisitions.Integrating acquired businesses and properties involves a number of special risks. These risks include the possibility thatmanagement may be distracted from regular business concerns by the need to integrate operations and that unforeseen difficultiescan arise in integrating operations and systems and in retaining and assimilating employees. Any of these or other similar riskscould lead to potential adverse short-term or long-term effects on our operating results.Part of our strategy includes drilling in new or emerging plays. As a result, our drilling in these areas is subject togreater risk and uncertainty.We have made initial investments in acreage and wells in the Rocky Mountain region and other regions. These activities aremore uncertain than drilling in areas that are developed and have established production. Our operations in these regions are stillin the early stages. Because emerging plays and new formations have limited or no production history, we are less able to use pastdrilling results to help predict future results. The lack of historical information may result in us not being able to fully execute ourexpected drilling programs in these areas or the return on investment in these areas may turn out not to be as attractive asanticipated. We cannot assure you that our future drilling activities in these emerging plays will be successful, or if successfulwill achieve the resource potential levels that we currently anticipate based on the drilling activities that have been completed orachieve the anticipated economic returns based on our current cost models.Our operations are subject to numerous risks of oil and gas drilling and production activities.Oil and gas drilling and production activities are subject to numerous risks, including the risk that no commercially productiveoil or natural gas reserves will be found. The cost of drilling and completing wells is often uncertain. Oil and gas drilling andproduction activities may be shortened, delayed or canceled as a result of a variety of factors, many of which are beyond ourcontrol. These factors include:unexpected drilling conditions;pressure or irregularities in formations;equipment failures or accidents;hurricanes and other weather conditions;shortages in experienced labor; andshortages or delays in the delivery of equipment.The prevailing prices of oil and natural gas also affect the cost of and the demand for drilling rigs, production equipment andrelated services. We cannot assure you that the new wells we drill will be productive or that we will recover all or any portion ofour investment. Drilling for oil and natural gas may be unprofitable. Drilling activities can result in dry wells and wells that areproductive but do not produce sufficient net revenue after operating and other costs to recoup drilling costs.15
Our industry experiences numerous operating risks.The exploration, development and production of oil and gas properties involves a variety of operating risks including the riskof fire, explosions, blowouts, pipe failure, abnormally pressured formations and environmental hazards. Environmental hazardsinclude oil spills, gas leaks, pipeline ruptures or discharges of toxic gases. We are also involved in drilling operations that utilizehydraulic fracturing, which may potentially present additional operational and environmental risks. Additionally, our offshoreoperations are subject to the additional hazards of marine operations, such as capsizing, collision and adverse weather and seaconditions, including the effects of hurricanes.We have begun to explore for natural gas and oil in the deep waters of the GOM (water depths greater than 2,000 feet) whereoperations are more difficult and more expensive than in shallower waters. Our deep water drilling and operations require theapplication of recently developed technologies that involve a higher risk of mechanical failure. The deep waters of the GOM oftenlack the physical infrastructure and availability of services present in the shallower waters. As a result, deep water operations mayrequire a significant amount of time between a discovery and the time that we can market the oil and gas, increasing the risksinvolved with these operations.If any of these industry-operating risks occur, we could have substantial losses. Substantial losses may be caused by injury orloss of life, severe damage to or destruction of property, natural resources and equipment, pollution or other environmentaldamage, clean-up responsibilities, regulatory investigation and penalties and suspension of operations.We may not be insured against all of the operating risks to which our business is exposed.In accordance with industry practice, we maintain insurance against some, but not all, of the operating risks to which ourbusiness is exposed. We insure some, but not all, of our properties from operational and hurricane related events. We currentlyhave insurance policies that include coverage for general liability, physical damage to our oil and gas properties, operationalcontrol of wells, oil pollution, workers’ compensation and employers’ liability and other coverage. Our insurance coverageincludes deductibles that must be met prior to recovery, as well as sub-limits and/or self-insurance. Additionally, our insurance issubject to exclusions and limitations, and there is no assurance that such coverage will adequately protect us against liability fromall potential consequences and damages and losses.Currently, we have general liability insurance coverage with an annual aggregate limit of up to $375 million on a 100%working interest basis. We currently purchase an offshore property physical damage policy that contains an $80 million annualaggregate named windstorm limit. Our operational control of well coverage provides limits that vary by well location and depthand range from a combined single limit of $20 million to $300 million per occurrence. Exploratory deep water wells have acoverage limit of $600 million per occurrence. Additionally, we maintain $150 million in oil pollution liability coverage. Ourgeneral liability, control of well and oil pollution liability policy limits are scaled proportionately to our working interests, and allof our policies described above are subject to deductibles, sub-limits and/or self-insurance. Under our service agreements,including drilling contracts, generally we are indemnified for injuries and death of the service provider’s employees as well ascontractors and subcontractors hired by the service provider.An operational or hurricane related event may cause damage or liability in excess of our coverage, which might severelyimpact our financial position. We may be liable for damages from an event relating to a project in which we are a non-operator,but have a working interest in such project. Such an event may also cause a significant interruption to our business, which mightalso severely impact our financial position. In past years, we have experienced production interruptions for which we had noproduction interruption insurance.We reevaluate the purchase of insurance, policy limits and terms annually each May. Future insurance coverage for ourindustry could increase in cost and may include higher deductibles or retentions. In addition, some forms of insurance maybecome unavailable in the future or unavailable on terms that we believe are economically acceptable. No assurance can be giventhat we will be able to maintain insurance in the future at rates that we consider reasonable and we may elect to maintain minimalor no insurance coverage. We may not be able to secure additional insurance or bonding that might be required by newgovernmental regulations. This may cause us to restrict our operations in the GOM, which might severely impact our financialposition. The occurrence of a significant event, not fully insured against, could have a material adverse effect on our financialcondition and results of operations.16
Terrorist attacks aimed at our facilities could adversely affect our business.The U.S. government has issued warnings that U.S. energy assets may be the future targets of terrorist organizations. Thesedevelopments have subjected our operations to increased risks. Any future terrorist attack at our facilities, or those of ourpurchasers, could have a material adverse affect on our financial condition and operations.Competition within our industry may adversely affect our operations.Competition within our industry is intense, particularly with respect to the acquisition of producing properties and undevelopedacreage. We compete with major oil and gas companies and other independent producers of varying sizes, all of which are engagedin the acquisition of properties and the exploration and development of such properties. Many of our competitors have financialresources and exploration and development budgets that are substantially greater than ours, which may adversely affect our abilityto compete.Our oil and gas operations are subject to various United States federal, state and local governmental regulations thatmaterially affect our operations.Our oil and gas operations are subject to various United States federal, state and local laws and regulations. These laws andregulations may be changed in response to economic or political conditions. Regulated matters include: permits for exploration,development and production operations; limitations on our drilling activities in environmentally sensitive areas, such as wetlands,and restrictions on the way we can release materials into the environment; bonds or other financial responsibility requirements tocover drilling contingencies and well plugging and abandonment costs; reports concerning operations, the spacing of wells andunitization and pooling of properties; and taxation. Failure to comply with these laws and regulations can result in the assessmentof administrative, civil or criminal penalties, the issuance of remedial obligations and the imposition of injunctions limiting orprohibiting certain of our operations. At various times, regulatory agencies have imposed price controls and limitations on oil andgas production. In order to conserve supplies of oil and gas, these agencies have restricted the rates of flow of oil and gas wellsbelow actual production capacity. In addition, the OPA requires operators of offshore facilities such as us to prove that they havethe financial capability to respond to costs that may be incurred in connection with potential oil spills. Under the OPA and otherenvironmental statutes such as the federal Comprehensive Environmental Response, Compensation, and Liability Act(“CERCLA”) and Resource Conservation and Recovery Act (“RCRA”) and analogous state laws, owners and operators of certaindefined onshore and offshore facilities are strictly liable for spills of oil and other regulated substances, subject to certainlimitations. Consequently, a substantial spill from one of our facilities subject to laws such as the OPA, CERCLA and RCRAcould require the expenditure of additional, and potentially significant, amounts of capital, or could have a material adverse effecton our earnings, results of operations, competitive position or financial condition. Federal, state and local laws regulate production,handling, storage, transportation and disposal of oil and gas, by-products from oil and gas and other substances, and materialsproduced or used in connection with oil and gas operations. We cannot predict the ultimate cost of compliance with theserequirements or their impact on our earnings, operations or competitive position.The loss of key personnel could adversely affect our ability to operate.Our operations are dependent upon key management and technical personnel. We cannot assure you that individuals willremain with us for the immediate or foreseeable future. The unexpected loss of the services of one or more of these individualscould have an adverse effect on us.Hedging transactions may limit our potential gains or become ineffective.In order to manage our exposure to price risks in the marketing of our oil and natural gas, we periodically enter into oil and gasprice hedging arrangements with respect to a portion of our expected production. Our hedging policy provides that, without priorapproval of our board of directors, generally not more than 50% of our estimated production quantities may be hedged. Thesearrangements may include futures contracts on the New York Mercantile Exchange (“NYMEX”) or the Intercontinental Exchange(“ICE”). While intended to reduce the effects of volatile oil and gas prices, such transactions, depending on the hedging instrumentused, may limit our potential gains if oil and gas prices were to rise substantially over the price established by the hedge. Inaddition, such transactions may expose us to the risk of financial loss in certain circumstances, including instances in which:our production is less than expected or is shut-in for extended periods due to hurricanes or other factors;there is a widening of price differentials between delivery points for our production and the delivery point assumed inthe hedge arrangement;the counterparties to our futures contracts fail to perform the contracts;a sudden, unexpected event materially impacts oil or natural gas prices; or17
we are unable to market our production in a manner contemplated when entering into the hedge contract.Currently, some of our outstanding commodity derivative instruments are with certain lenders or affiliates of the lenders underour bank credit facility. Our existing derivative agreements with our lenders are secured by the security documents executed bythe parties under our bank credit facility. Future collateral requirements for our commodity hedging activities are uncertain andwill depend on the arrangements we negotiate with the counterparty and the volatility of oil and natural gas prices and marketconditions.Our Certificate of Incorporation and Bylaws have provisions that discourage corporate takeovers and could preventstockholders from realizing a premium on their investment.Certain provisions of our Certificate of Incorporation and Bylaws and the provisions of the Delaware General <strong>Corporation</strong> Lawmay encourage persons considering unsolicited tender offers or other unilateral takeover proposals to negotiate with our board ofdirectors rather than pursue non-negotiated takeover attempts. Our board of directors is elected by plurality voting. Also, ourCertificate of Incorporation authorizes our board of directors to issue preferred stock without stockholder approval and to set therights, preferences and other designations, including voting rights of those shares, as the board of directors may determine.Additional provisions include restrictions on business combinations and the availability of authorized but unissued common stock.These provisions, alone or in combination with each other, may discourage transactions involving actual or potential changes ofcontrol, including transactions that otherwise could involve payment of a premium over prevailing market prices to stockholdersfor their common stock.Resolution of litigation could materially affect our financial position and results of operations.We have been named as a defendant in certain lawsuits. See Item 3. Legal Proceedings. In some of these suits, our liabilityfor potential loss upon resolution may be mitigated by insurance coverage. To the extent that potential exposure to liability is notcovered by insurance or insurance coverage is inadequate, we could incur losses that could be material to our financial position orresults of operations in future periods.Certain U.S. federal income tax deductions currently available with respect to oil and gas exploration and developmentmay be eliminated as a result of future legislation.Legislation may be proposed that would, if enacted into law, make significant changes to U.S. federal income tax laws,including the elimination of certain key U.S. federal income tax incentives currently available to oil and natural gas explorationand production companies. These changes include, but are not limited to, (i) the repeal of the percentage depletion allowance foroil and gas properties; (ii) the elimination of current deductions for intangible drilling and development costs; (iii) the eliminationof the deduction for certain U.S. production activities; and (iv) an extension of the amortization period for certain geological andgeophysical expenditures. It is unclear whether these or similar changes will be enacted and, if enacted, how soon any suchchanges could become effective. The passage of this legislation or any other similar changes in U.S. federal income tax laws couldeliminate or postpone certain tax deductions that are currently available with respect to oil and natural gas exploration anddevelopment, and any such change could negatively impact the value of an investment in our common stock.Climate change legislation or regulations restricting emissions of “greenhouse gases” could result in increased operatingcosts and reduced demand for the crude oil and natural gas that we produce.In December 2009, the EPA determined that emissions of carbon dioxide, methane and other “greenhouse gases” present anendangerment to public health and the environment because emissions of such gases are, according to the EPA, contributing towarming of the Earth’s atmosphere and other climatic changes. Based on these findings, the EPA has begun adopting andimplementing regulations to restrict emissions of greenhouse gases under existing provisions of the CAA. The EPA adopted twosets of rules regulating greenhouse gas emissions under the CAA, one of which requires a reduction in emissions of greenhousegases from motor vehicles and the other of which regulates emissions of greenhouse gases from certain large stationary sources,effective as of January 2, 2011. The EPA’s rules relating to emissions of greenhouse gases from large stationary sources ofemissions are currently subject to a number of legal challenges, but the federal courts have thus far declined to issue anyinjunctions to prevent the EPA from implementing, or requiring state environmental agencies to implement, the rules. The EPAhas also adopted rules requiring the reporting of greenhouse gas emissions from specified large greenhouse gas emission sources inthe United States, on an annual basis, beginning in 2011 for emissions occurring in 2010, as well as certain onshore oil and naturalgas production facilities, on an annual basis, beginning in <strong>2012</strong> for emissions occurring in 2011.18
In addition, the United States Congress has from time to time considered adopting legislation to reduce emissions ofgreenhouse gases and almost one-half of the states have already taken legal measures to reduce emissions of greenhouse gasesprimarily through the planned development of greenhouse gas emission inventories and/or regional greenhouse gas cap and tradeprograms. Most of these cap and trade programs work by requiring major sources of emissions, such as electric power plants, ormajor producers of fuels, such as refineries and gas processing plants, to acquire and surrender emission allowances. The numberof allowances available for purchase is reduced each year in an effort to achieve the overall greenhouse gas emission reductiongoal.The adoption of legislation or regulatory programs to reduce emissions of greenhouse gases could require us to incur increasedoperating costs, such as costs to purchase and operate emissions control systems, to acquire emissions allowances or to complywith new regulatory or reporting requirements. Any such legislation or regulatory programs could also increase the cost ofconsuming, and thereby reduce demand for, the oil and natural gas we produce. Consequently, legislation and regulatory programsto reduce emissions of greenhouse gases could have an adverse effect on our business, financial condition and results ofoperations. Finally, it should be noted that some scientists have concluded that increasing concentrations of greenhouse gases inthe Earth’s atmosphere may produce climate changes that have significant physical effects, such as increased frequency andseverity of storms, droughts, floods and other climatic events. If any such effects were to occur, they could have an adverse effecton our financial condition and results of operations.The enactment of derivatives legislation could have an adverse effect on our ability to use derivative instruments to reducethe effect of commodity price, interest rate and other risks associated with our business.On July 21, 2010 new comprehensive financial reform legislation, known as the Dodd-Frank Wall Street Reform andConsumer Protection Act (the “Act”), was enacted that establishes federal oversight and regulation of the over-the-counterderivatives market and entities, such as us, that participate in that market. The Act requires the CFTC, the SEC and otherregulators to promulgate rules and regulations implementing the new legislation. In its rulemaking under the Act the CFTC hasissued final regulations to set position limits for certain futures and option contracts in the major energy markets and for swaps thatare their economic equivalents. Certain bona fide hedging transactions would be exempt from these position limits. The positionlimits rule was vacated by the United States District Court for the District of Colombia in September of <strong>2012</strong> although the CFTChas stated that it will appeal the District Court’s decision. The CFTC also has finalized other regulations, including criticalrulemakings on the definition of “swap,” “security-based swap,” “swap dealer” and “major swap participant.” The Act and CFTCRules also will require us in connection with certain derivatives activities to comply with clearing and trade-executionrequirements (or take steps to qualify for an exemption to such requirements). In addition new regulations may require us tocomply with margin requirements although these regulations are not finalized and their application to us is uncertain at this time.Other regulations also remain to be finalized, and the CFTC recently has delayed the compliance dates for various regulationsalready finalized. As a result it is not possible at this time to predict with certainty the full effects of the Act and CFTC rules onus and the timing of such effects. The Act also may require the counterparties to our derivative instruments to spin off some oftheir derivatives activities to a separate entity, which may not be as creditworthy as the current counterparty.The Act and any new regulations could significantly increase the cost of derivative contracts (including from swaprecordkeeping and reporting requirements and through requirements to post collateral which could adversely affect our availableliquidity), materially alter the terms of derivative contracts, reduce the availability of some derivatives to protect against risks weencounter, reduce our ability to monetize or restructure our existing derivative contracts, and potentially increase our exposure toless creditworthy counterparties. If we reduce our use of derivatives as a result of the Act and regulations, our results of operationsmay become more volatile and our cash flows may be less predictable, which could adversely affect our ability to plan for andfund capital expenditures. Finally, the Act was intended, in part, to reduce the volatility of oil and natural gas prices, which somelegislators attributed to speculative trading in derivatives and commodity instruments related to oil and natural gas. Our revenuescould therefore be adversely affected if a consequence of the Act and regulations is to lower commodity prices. Any of theseconsequences could have material adverse effect on our financial condition and our results of operations.Federal and state legislation and regulatory initiatives relating to hydraulic fracturing could cause us to incur increasedcosts and experience additional operating restrictions or delays.Hydraulic fracturing is an important and common practice that is used to stimulate production of hydrocarbons from tightformations. We routinely utilize hydraulic fracturing techniques in many of our drilling and completion programs. The processinvolves the injection of water, sand and chemicals under pressure into the formation to fracture the surrounding rock andstimulate production. The process is typically regulated by state oil and gas commissions. However, the EPA recently assertedfederal regulatory authority over certain hydraulic fracturing activities involving diesel fuel under the SDWA’s UndergroundInjection Control Program. The White House Council on Environmental Quality is coordinating an administration-wide review of19
hydraulic fracturing practices, and a number of federal agencies are analyzing a number of environmental issues associated withhydraulic fracturing. The EPA has commenced a comprehensive study of the potential environmental effects of hydraulicfracturing activities on water resources. The EPA’s study includes 18 separate research projects addressing topics such as wateracquisition, chemical mixing, well injection, flowback and produced water, wastewater treatment and waste disposal. The EPAhas indicated that it expects to issue its study report in late 2014. In addition, the U.S. Department of <strong>Energy</strong> and the U.S.Government Accountability Office are studying various aspects of hydraulic fracturing, and the U.S. Department of the Interior isconsidering adopting new permitting and disclosure requirements for hydraulic fracturing activities performed on federal lands.These studies, depending on their results, could spur initiatives to regulate hydraulic fracturing under the SDWA or other federalprograms. In addition, some states have adopted, and other states are considering adopting, regulations that could impose morestringent permitting, disclosure and well construction requirements on hydraulic fracturing operations, including states in whichwe operate. For example, effective February 1, <strong>2012</strong>, the Railroad Commission of Texas (the entity that regulates oil and naturalgas production in Texas) began requiring all operators to disclose on a public website the chemical ingredients and water volumesused to hydraulically fracture wells in Texas. The disclosure of proprietary information regarding chemicals or formulas used inhydraulic fracturing could diminish the value of such information and could result in competitive harm to us. If new laws orregulations that significantly restrict hydraulic fracturing are adopted, such laws could make it more difficult or costly for us toperform fracturing to stimulate production from tight formations. In addition, if hydraulic fracturing becomes regulated at thefederal level as a result of federal legislation or regulatory initiatives by the EPA, our fracturing activities could become subject toadditional permitting requirements, and also to attendant permitting delays and potential increases in costs. Restrictions onhydraulic fracturing could impact the timing of production and may also reduce the amount of oil and natural gas that we areultimately able to produce from our reserves.ITEM 1B. UNRESOLVED STAFF COMMENTSNone.ITEM 2. PROPERTIESAs of February 21, 2013, our property portfolio consisted of 65 active properties and 129 primary term leases in the Gulf CoastBasin (onshore and offshore), five active properties in the Appalachia region, three active properties in the Rocky Mountain regionand one active property in the Eagle Ford Shale formation. We serve as operator on 71% of our active properties. The propertiesthat we operate accounted for 92% of our year-end <strong>2012</strong> estimated proved reserves. This high operating percentage allows us tobetter control the timing, selection and costs of our drilling and production activities.Oil and Natural Gas ReservesOur Reserves Committee Charter provides that the reserves committee has the sole authority to recommend to the board ofdirectors appointments or replacements of one or more firms of independent reservoir engineers and geoscientists. The reservescommittee reviews annually the arrangements of the independent reservoir engineers and geoscientists with management,including the scope and general extent of the examination of our reserves, the reports to be rendered, the services and fees andconsideration of the independence of such independent reservoir engineers and geoscientists. The reserves committee may consultwith management but may not delegate these responsibilities. The reserves committee provides oversight in regards to the reserveestimation process but not the actual determination of estimated proved reserves. Our Reserves Committee Charter provides that itis the duty of management and not the duty of the reserves committee to plan or conduct reviews or to determine that our reserveestimates are complete and accurate and are in accordance with generally accepted engineering standards and applicable rules andregulations of the SEC. Our Director of Strategic Planning is the in-house person designated as primarily responsible for theprocess of reserve preparation. He is a petroleum engineer with over twenty years of experience in reservoir engineering andanalysis. His duties include oversight of the preparation of non year-end quarterly reserve estimates and coordination with theoutside engineering consultants on the preparation of year-end reserve estimates. The year-end reserve estimates prepared by ouroutside engineering firm are independent of any oversight of the Director of Strategic Planning or the reserves committee.Estimates of our proved reserves at December 31, <strong>2012</strong> were prepared by Netherland, Sewell & Associates, Inc. (“NSA”), anationally recognized engineering firm. NSA provides a complete range of geological, geophysical, petrophysical and engineeringservices and has the technical experience and ability to perform these services in any of the onshore and offshore oil and gasproducing areas of the world. NSA has a technical staff of over 70 professionals who are intimately familiar with recognizedindustry reserve and resource definitions, specifically those set forth by the SEC. NSA’s letter is filed as an exhibit to this Form10-K.The following table sets forth our estimated proved oil and gas reserves (approximately 44% of which are located in theAppalachian region, 34% are located in the GOM deep water and 22% are located in the conventional shelf/deep gas) as of20
December 31, <strong>2012</strong>. The <strong>2012</strong> average 12-month oil and gas prices net of differentials were $101.20 per Bbl of oil, $38.23 per Bblof natural gas liquids (“NGLs”) and $2.68 per Mcf of gas.Summary of Oil, Natural Gas and NGL Reserves as of December 31, <strong>2012</strong>Oil(MBbls)Natural GasLiquids(MBbls)Natural Gas(MMcf)Oil, NaturalGas andNGL’s(MMcfe)Reserves Category:PROVEDDeveloped ........................ 29,005 8,592 210,956 436,540Undeveloped .................... 15,913 9,474 184,418 336,745TOTAL PROVED ......... 44,918 18,066 395,374 773,285At December 31, <strong>2012</strong>, we reported estimated proved undeveloped reserves (“PUDs”) of 336.7 Bcfe, which accounted for 44%of our total estimated proved oil and gas reserves. This figure ties to a projected 88 new wells (311.8 Bcfe) and ten sidetrack wellsfrom existing wellbores (24.9 Bcfe). Our timetable for the ten sidetrack wells is totally dependent on the life of the currentlyproducing zones. After the current zones have been depleted, we would utilize the existing wellbore to sidetrack to the PUDobjective. Regarding the remaining 88 PUD locations, we project 25 wells to be drilled in 2013 (122.2 Bcfe); ten wells in 2014(42.2 Bcfe); 29 wells in 2015 (76.9 Bcfe); fourteen wells in 2016 (41.3 Bcfe), and ten wells in 2017 (29.2 Bcfe). None of these 88PUD wells will have been on our books in excess of five years at the time of their scheduled drilling. The following tablediscloses our progress toward the conversion of PUDs during <strong>2012</strong>.21Oil, NaturalGas andNGLs(MMcfe)FutureDevelopmentCosts($ in thousands)PUDs beginning of year ..................................... 241,656 $607,995Revisions of previous estimates ......................... (47,153) (176,995)Conversions to proved developed reserves ......... (47,505) (33,835)Additional PUDs added ...................................... 189,747 268,071PUDs end of year ............................................... 336,745 $665,236During <strong>2012</strong> we invested approximately $33.8 million to convert 47.5 Bcfe of proved undeveloped reserves to proveddeveloped reserves, mainly in the Appalachian region.The following represents additional information on our significant properties:<strong>2012</strong>Production(MMcfe)December 31,<strong>2012</strong>EstimatedProved Reserves(MMcfe)Nature ofInterestField NameLocationMary .................................................. Appalachia 11,544 281,843 WorkingPompano ............................................. GOM Deep Water 10,310 175,642 WorkingMississippi Canyon Block 109 .......... GOM Deep Water 9,765 75,291 WorkingBayou Hebert ..................................... GOM Deep Gas 3,254 33,317 WorkingHeather .............................................. Appalachia 2,799 33,008 WorkingShip Shoal Block 113 ........................ GOM Shelf 11,745 25,657 WorkingEwing Bank Block 305 ...................... GOM Shelf 3,309 19,942 WorkingMain Pass Block 288 ......................... GOM Shelf 2,756 13,080 WorkingThere are numerous uncertainties inherent in estimating quantities of proved reserves and in projecting future rates ofproduction and the timing of development expenditures, including many factors beyond the control of the producer. The reservedata set forth herein only represents estimates. Reserve engineering is a subjective process of estimating undergroundaccumulations of oil and natural gas that cannot be measured in an exact way. The accuracy of any reserve estimate depends onthe quality of available data and the interpretation of that data by geological engineers. In addition, the results of drilling, testing
and production activities may justify revisions of estimates that were made previously. If significant, these revisions would changethe schedule of any further production and development drilling. Accordingly, reserve estimates are generally different from thequantities of oil and natural gas that are ultimately recovered. Further, the estimated future net revenues from proved reserves andthe present value thereof are based upon certain assumptions, including geological success, prices, future production levels,operating costs, development costs and income taxes that may not prove to be correct. Predictions about prices and futureproduction levels are subject to great uncertainty, and the meaningfulness of these estimates depends on the accuracy of theassumptions upon which they are based.As an operator of domestic oil and gas properties, we have filed U.S. Department of <strong>Energy</strong> Form EIA-23, “<strong>Annual</strong> Survey ofOil and Gas Reserves,” as required by Public Law 93-275. There are differences between the reserves as reported on FormEIA-23 and as reported herein. The differences are attributable to the fact that Form EIA-23 requires that an operator report thetotal reserves attributable to wells that it operates, without regard to percentage ownership (i.e., reserves are reported on a grossoperated basis, rather than on a net interest basis) or non-operated wells in which it owns an interest.Acquisition, Production and Drilling ActivityAcquisition and Development Costs. The following table sets forth certain information regarding the costs incurred in ouracquisition, development and exploratory activities in the United States during the periods indicated.Year Ended December 31,<strong>2012</strong> 2011 2010(In thousands)Acquisition costs, net of sales of unevaluated properties ......................... $102,807 $270,354 $127,069Development costs (1).............................................................................. 395,555 426,355 241,387Exploratory costs ...................................................................................... 81,458 84,199 42,205Subtotal .................................................................................................... 579,820 780,908 410,661Capitalized salaries, general and administrative costs and interest, netof fees and reimbursements ............................................................. 62,664 66,111 51,016Total additions to oil and gas properties, net ............................................ $642,484 $847,019 $461,677(1) Includes capitalized asset retirement costs of $95,293, $96,386 and $56,444 for the years ended December 31, <strong>2012</strong>,2011 and 2010, respectively.Production Volumes, Sales Price and Cost Data. The following table sets forth certain information regarding our productionvolumes, sales prices and average production costs for the periods indicated.Year Ended December 31,<strong>2012</strong> 2011 2010Production:Oil (MBbls) ............................................................... 7,135 6,427 5,714Natural gas (MMcf) .................................................. 42,569 38,466 41,168Natural gas liquids (MBbls) ..................................... 1,163 506 574Oil, natural gas and NGLs (MMcfe) ........................ 92,357 80,064 78,896Average sales prices: (1)Oil (per Bbl) .............................................................. $106.70 $103.31 $73.14Natural gas (per Mcf) ............................................... 3.17 4.44 5.12Natural gas liquids (per Bbl) .................................... 41.70 59.28 47.86Oil, natural gas and NGLs (per Mcfe) ...................... 10.23 10.80 8.32Expenses (per Mcfe):Lease operating expenses (2)..................................... $2.33 $2.20 $1.90(1) Includes the settlement of effective hedging contracts.(2) Includes oil and gas operating costs and major maintenance expense and excludes production and advalorem taxes.22
Production Volumes, Sales Price and Cost Data for Individually Significant Fields. The following table sets forth certaininformation regarding our production volumes, sales prices and average production costs for the periods indicated for any field(s)containing 15% or more of our total estimated proved reserves at December 31, <strong>2012</strong>. We completed the acquisition of ourinterest in the Pompano field on December 28, 2011.FIELD: Mary Year Ended December 31,<strong>2012</strong> 2011 2010Production:Oil (MBbls)............................................................... 340 25 -Natural gas (MMcf) ................................................. 6,815 977 79Natural gas liquids (MBbls) ..................................... 448 - -Oil, natural gas and NGLs (MMcfe) ........................ 11,544 1,125 79Average sales prices:Oil (per Bbl) .............................................................. $54.19 $75.60 $ -Natural gas (per Mcf) ............................................... 3.27 6.08 4.78Natural gas liquids (per Bbl) .................................... 33.94 - -Oil, natural gas and NGLs (per Mcfe) ..................... 4.84 6.94 4.78Expenses (per Mcfe):Lease operating expenses (1) .................................... $1.14 $1.40 $1.51FIELD: Pompano Year Ended December 31,<strong>2012</strong> 2011(a) 2010Production:Oil (MBbls)............................................................... 1,266 - -Natural gas (MMcf) ................................................. 1,980 - -Natural gas liquids (MBbls) ..................................... 122 - -Oil, natural gas and NGLs (MMcfe) ........................ 10,310 - -Average sales prices:Oil (per Bbl) .............................................................. $108.65 $ - $ -Natural gas (per Mcf) ............................................... 2.02 - -Natural gas liquids (per Bbl) .................................... 45.70 - -Oil, natural gas and NGLs (per Mcfe) ..................... 14.28 - -Expenses (per Mcfe):Lease operating expenses (1) .................................... $2.01 $ - $ -(a) Amounts for 2011 are immaterial. We completed the acquisition of the Pompano field on December 28, 2011.(1) Includes oil and gas operating costs and major maintenance expense and excludes production and advalorem taxes.Drilling Activity. The following table sets forth our drilling activity for the periods indicated.Year Ended December 31,<strong>2012</strong> 2011 2010Gross Net Gross Net Gross NetExploratory Wells:Productive ..................... 1.00 0.43 6.00 3.00 6.00 4.10Dry ................................ - - 1.00 0.64 - -Development Wells:Productive ..................... 33.00 23.16 37.00 32.92 20.00 15.75Dry ................................ 3.00 3.00 - - - -During the period beginning January 1, 2013 and ending February 21, 2013, we participated in the drilling of 4.00 gross (3.05net) development wells.23
Productive Well and Acreage Data. The following table sets forth certain statistics regarding the number of productive wellsand developed and undeveloped acreage as of December 31, <strong>2012</strong>.Gross NetProductive Wells:Oil (1):Gulf Coast Basin .......................... 175 129Onshore Oil................................. 10 4Appalachia .................................. - -185 133Gas (2):Gulf Coast Basin .......................... 71 43Onshore Oil.................................. - -Appalachia ................................... 65 44136 87Total .......................................... 321 220Developed Acres:Gulf Coast Basin .............................. 307,868 279,881Onshore Oil ...................................... 30,361 30,361Appalachia ....................................... 27,101 26,247365,330 336,489Undeveloped Acres (3):Gulf Coast Basin .............................. 539,878 535,193Onshore Oil ...................................... 65,771 62,174Appalachia ....................................... 75,794 66,992681,443 664,359Total .......................................... 1,046,773 1,000,848(1) 15 gross wells each have dual completions.(2) 8 gross wells each have dual completions.(3) Leases covering approximately 14% of our undeveloped gross acreage will expire in 2013, 15% in 2014, 4% in 2015,10% in 2016, 6% in 2017, 14% in 2018, 9% in 2019, 2% in 2020 and 26% thereafter.Title to PropertiesWe believe that we have satisfactory title to substantially all of our active properties in accordance with standards generallyaccepted in the oil and gas industry. Our properties are subject to customary royalty interests, liens for current taxes and otherburdens, which we believe do not materially interfere with the use of or affect the value of such properties. Prior to acquiringundeveloped properties, we perform a title investigation that is thorough but less vigorous than that conducted prior to drilling,which is consistent with standard practice in the oil and gas industry. Before we commence drilling operations, we conduct athorough title examination and perform curative work with respect to significant defects before proceeding with operations. Wehave performed a thorough title examination with respect to substantially all of our active properties.ITEM 3. LEGAL PROCEEDINGSOn December 30, 2004, we were served with two petitions (civil action numbers 2004-6227 and 2004-6228) filed by theLouisiana Department of Revenue (“LDR”) in the 15 th Judicial District Court (Parish of Lafayette, Louisiana) claiming additionalfranchise taxes due. In one case, the LDR is seeking additional franchise taxes from <strong>Stone</strong> in the amount of $640,000, plus accruedinterest of $352,000 (calculated through December 15, 2004), for the franchise tax year 2001. In the other case, the LDR is seekingadditional franchise taxes from <strong>Stone</strong> (as successor to Basin Exploration, Inc.) in the amount of $274,000, plus accrued interest of$159,000 (calculated through December 15, 2004), for the franchise tax years 1999, 2000 and 2001. On December 29, 2005, theLDR filed another petition (civil action number 2005-6524) in the 15 th Judicial District Court claiming additional franchise taxesdue for the franchise tax years 2002 and 2003 in the amount of $2.6 million, plus accrued interest of $1.2 million (calculatedthrough December 15, 2005). Also, on January 2, 2008, we were served with a petition (civil action number 2007-6754) claiming$1.5 million of additional franchise taxes due for the 2004 franchise tax year, plus accrued interest of $800,000 (calculated throughNovember 30, 2007). Further, on January 7, 2009, we were served with a petition (civil action number 2008-7193) claiming24
additional franchise taxes due for the franchise tax years 2005 and 2006 in the amount of $4.0 million, plus accrued interest of $1.7million (calculated through October 21, 2008). In addition, we have received proposed assessments from the LDR for additionalfranchise taxes in the amount of $8.1 million resulting from audits of <strong>Stone</strong> and our subsidiaries. These assessments all relate tothe LDR's assertion that sales of crude oil and natural gas from properties located on the OCS, which are transported through theState of Louisiana, should be sourced to the State of Louisiana for purposes of computing the Louisiana franchise taxapportionment ratio. We disagree with these contentions and intend to vigorously defend ourselves against these claims. Thefranchise tax years 2010, 2011 and <strong>2012</strong> for <strong>Stone</strong> remain subject to examination.In October <strong>2012</strong>, we received a notice from BSEE that it was initiating an enforcement proceeding with respect to an Incidentof Non-Compliance observed at our Vermillion Block 255 Platform H in April <strong>2012</strong>. The notice indicates that BSEE may seek toimpose a penalty of up to $25,000 a day for up to as many as eight days of alleged improper venting of gas at the platform. Webelieve that the conditions observed were not actually violations of applicable rules and have initiated discussions with BSEE toresolve the matter. We do not believe that this proceeding will have a material adverse effect on our financial condition or resultsof operations.Litigation is subject to substantial uncertainties concerning the outcome of material factual and legal issues relating to thelitigation. Accordingly, we cannot currently predict the manner and timing of the resolution of these matters and are unable toestimate a range of possible losses or any minimum loss from such matters.ITEM 4. MINE SAFETY DISCLOSURESNot applicable.PART IIITEM 5. MARKET FOR REGISTRANT’S COMMON EQUITY, RELATED STOCKHOLDER MATTERS ANDISSUER PURCHASES OF EQUITY SECURITIESSince July 9, 1993, our common stock has been listed on the New York Stock Exchange under the symbol “SGY.” Thefollowing table sets forth, for the periods indicated, the high and low sales prices per share of our common stock.High Low2011First Quarter ............................................................................ $33.49 $21.28Second Quarter ....................................................................... 35.94 27.44Third Quarter .......................................................................... 34.46 16.19Fourth Quarter ........................................................................ 29.71 14.64<strong>2012</strong>First Quarter ............................................................................ $35.47 $25.61Second Quarter ....................................................................... 29.83 20.80Third Quarter .......................................................................... 27.87 22.07Fourth Quarter ........................................................................ 25.71 19.272013First Quarter (through February 21, 2013) ............................. $23.40 $19.62On February 21, 2013, the last reported sales price on the New York Stock Exchange Composite Tape was $20.62 per share.As of that date, there were 457 holders of record of our common stock.Dividend RestrictionsIn the past, we have not paid cash dividends on our common stock, and we do not intend to pay cash dividends on our commonstock in the foreseeable future. We currently intend to retain earnings, if any, for the future operation and development of ourbusiness. The restrictions on our present or future ability to pay dividends are included in the provisions of the Delaware General<strong>Corporation</strong> Law and in certain restrictive provisions in the indentures executed in connection with our 1¾% Senior ConvertibleNotes due 2017 (the “2017 Convertible Notes”), our 8⅝% Senior Notes due 2017 (the “2017 Notes”) and our 7½% Senior Notesdue 2022 (the “2022 Notes”). In addition, our bank credit facility contains provisions that may have the effect of limiting orprohibiting the payment of dividends.25
Issuer Purchases of Equity SecuritiesOn September 24, 2007, our board of directors authorized a share repurchase program for an aggregate amount of up to $100million. The shares may be repurchased from time to time in the open market or through privately negotiated transactions. Therepurchase program is subject to business and market conditions, and may be suspended or discontinued at any time. Additionally,shares are sometimes withheld from certain employees to pay taxes associated with the employees’ vesting of restricted stock. Thefollowing table sets forth information regarding our repurchases or acquisitions of common stock during the fourth quarter of<strong>2012</strong>:PeriodTotal Numberof Shares (orUnits)PurchasedAveragePrice Paidper Share (orUnit)Total Number ofShares (or Units)Purchased as Partof PubliclyAnnounced Plansor ProgramsMaximum Number (orApproximate DollarValue) of Shares (or Units)that May Yet BePurchased Under thePlans or ProgramsShare Repurchase Program:October <strong>2012</strong> ............................... - - -November <strong>2012</strong> ........................... - - -December <strong>2012</strong> ........................... - - -- - - $92,928,632Other:October <strong>2012</strong> ............................... - - -November <strong>2012</strong> ........................... - - -December <strong>2012</strong> ........................... - - -- - - N/ATotal Fourth Quarter <strong>2012</strong> .......... - $ - -There were no repurchases of common stock under our share repurchase program and no shares withheld from employees topay taxes associated with any vesting of restricted stock during the fourth quarter of <strong>2012</strong>.Equity Compensation Plan InformationPlease refer to Item 12 of this <strong>Annual</strong> <strong>Report</strong> on Form 10-K for information concerning securities authorized under our equitycompensation plan.26
Stock Performance GraphAs required by applicable rules of the SEC, the performance graph shown below was prepared based upon the followingassumptions:1. $100 was invested in the company's common stock, the Standard & Poor’s 500 Stock Index (“S&P 500 Index”) and thePeer Group (as defined below) on December 31, 2007 at $46.91 per share for the company’s common stock and at theclosing price of the stocks comprising the S&P 500 Index and the Peer Group, respectively, on such date.2. Peer Group investment is weighted based upon the market capitalization of each individual company within the PeerGroup at the beginning of the period.3. Dividends are reinvested on the ex-dividend dates.Comparison of Cumulative Five-Year Total Return$150$100$50$0Dec-07 Dec-08 Dec-09 Dec-10 Dec-11 Dec-12<strong>Stone</strong> <strong>Energy</strong> <strong>Corporation</strong>S&P 500 Index<strong>2012</strong> Peer Group 2011 Peer GroupMeasurement Period(Fiscal Year Covered) SGY<strong>2012</strong> PeerGroup2011 PeerGroupS&P 500Index12/31/08 ....................... 23.49 50.58 53.80 63.0012/31/09 ....................... 38.48 80.77 87.30 79.6712/31/10 ....................... 47.52 102.46 105.30 91.6812/31/11 ....................... 56.24 94.89 95.89 93.6112/31/12 ....................... 43.74 93.66 92.18 108.59The companies that comprised our Peer Group in <strong>2012</strong> were: ATP Oil & Gas <strong>Corporation</strong>, Cabot Oil & Gas <strong>Corporation</strong>,Callon Petroleum Company, Carrizo Oil & Gas, Inc., Cimarex <strong>Energy</strong> Company, Comstock Resources, Inc., Denbury ResourcesInc., <strong>Energy</strong> Partners, Ltd., <strong>Energy</strong> XXI (Bermuda) Limited, Exco Resources Inc., McMoRan Exploration Company, NewfieldExploration Company, Petroleum Development <strong>Corporation</strong>, PetroQuest <strong>Energy</strong>, Inc., Plains Exploration & Production Company,Range Resources <strong>Corporation</strong>, SM <strong>Energy</strong> Company, Swift <strong>Energy</strong> Company, W&T Offshore, Inc. and Whiting Petroleum<strong>Corporation</strong>. Plains Exploration & Production Company replaced Petrohawk <strong>Energy</strong> <strong>Corporation</strong> after Petrohawk <strong>Energy</strong><strong>Corporation</strong> was acquired by BHP Billiton in August 2011.The information in this Form 10-K appearing under the heading “Stock Performance Graph” is being “furnished” pursuant toItem 2.01(e) of Regulation S-K under the Securities Act and shall not be deemed to be “soliciting material” or “filed” with theSEC or subject to Regulation 14A or 14C, other than as provided in Item 2.01(e) of Regulation S-K, or to the liabilities of Section18 of the Exchange Act.27
ITEM 6. SELECTED FINANCIAL DATAThe following table sets forth a summary of selected historical financial information for each of the years in the five-yearperiod ended December 31, <strong>2012</strong>. This information is derived from our Consolidated Financial Statements and the notes thereto.See “Item 7. Management’s Discussion and Analysis of Financial Condition and Results of Operations” and “Item 8.Financial Statements and Supplementary Data.” The information included in this table for the years ended December 31, 2009and 2008 includes the effects of corrections on the previously reported financial statements.Year Ended December 31,<strong>2012</strong> 2011 2010 2009 2008Statement of Operations Data:(In thousands, except per share amounts)Operating revenue:Oil production ..................................................................... $761,304 $663,958 $417,948 $438,942 $461,050Gas production .................................................................... 134,739 170,611 210,686 272,353 336,665Natural gas liquids production ............................................ 48,498 29,996 27,473 - -Other operational income.................................................... 3,520 3,938 5,916 4,326 5,989Derivative income, net ........................................................ 3,428 1,418 3,265 3,061 3,327Total operating revenue .................................................. 951,489 869,921 665,288 718,682 807,031Operating expenses:Lease operating expenses .................................................... 215,003 175,881 150,212 156,786 171,107Transportation, processing and gathering expenses ............ 21,782 8,958 7,218 - -Other operational expenses ................................................. 267 2,149 5,579 11,798 -Production taxes ................................................................. 10,015 9,380 5,808 7,920 7,990Depreciation, depletion and amortization ........................... 344,365 280,020 248,201 259,639 288,384Write-down of oil and gas properties .................................. - - - 508,989 1,324,327Goodwill impairment .......................................................... - - - - 465,985Accretion expense ............................................................... 33,331 30,764 34,469 39,306 17,392Salaries, general and administrative expenses .................... 54,648 40,169 42,759 41,367 43,504Incentive compensation expense ......................................... 8,113 11,600 5,888 6,402 2,315Total operating expenses .................................................. 687.524 558,921 500,134 1,032,207 2,321,004Income (loss) from operations .......................................... 263,965 311,000 165,154 (313,525) (1,513,973)Other (income) expenses:Interest expense .................................................................. 30,375 9,289 12,192 21,361 13,243Interest income ................................................................... (600) (420) (1,464) (528) (11,250)Other income ...................................................................... (1,805) (1,942) (776) (36) 189Loss on early extinguishment of debt ................................. 1,972 607 1,820 - -Other expense ..................................................................... - - 671 508 -Total other expenses ......................................................... 29,942 7,534 12,443 21,305 2,182Net income (loss) before income taxes ............................. 234,023 303,466 152,711 (334,830) (1,516,155)Income tax provision (benefit)............................................ 84,597 109,134 56,282 (116,559) (369,146)Net income (loss) ............................................................... 149,426 194,332 96,429 (218,271) (1,147,009)Net income (loss) attributable to non-controllinginterest ............................................................................ - - - 27 (77)Net income (loss) attributable to <strong>Stone</strong> <strong>Energy</strong> Corp. ... $149,426 $194,332 $96,429 ($218,298) ($1,146,932)Earnings and dividends per common share:Basic earnings (loss) per share ............................................ $3.03 $3.97 $1.99 ($4.97) ($35.89)Diluted earnings (loss) per share ......................................... $3.03 $3.97 $1.99 ($4.97) ($35.89)Cash dividends declared per share ...................................... - - - - -Cash Flow Data:Net cash provided by operating activities ........................... $509,749 $570,850 $424,794 $507,787 $522,478Net cash used in investing activities ................................... (568,688) (679,250) (374,088) (316,079) (1,357,907)Net cash provided by (used in) financing activities ............ 300,014 39,895 (13,043) (190,552) 428,440Balance Sheet Data (at end of period):Working capital (deficit)..................................................... $300,348 ($13,282) $30,382 $26,137 $123,339Oil and gas properties, net .................................................. 2,182,095 1,875,048 1,397,809 1,185,709 1,628,170Total assets ......................................................................... 2,776,431 2,165,751 1,679,090 1,454,242 2,109,852Long-term debt, less current potion .................................... 914,126 620,000 575,000 575,000 825,000<strong>Stone</strong> <strong>Energy</strong> <strong>Corporation</strong> stockholders’ equity ................. 872,133 667,829 430,357 325,659 577,39128
ITEM 7. MANAGEMENT'S DISCUSSION AND ANALYSIS OF FINANCIAL CONDITION AND RESULTS OFOPERATIONSThe following discussion is intended to assist in understanding our financial position and results of operations for each of theyears in the three-year period ended December 31, <strong>2012</strong>. Our Consolidated Financial Statements and the notes thereto, which arefound elsewhere in this Form 10-K, contain detailed information that should be referred to in conjunction with the followingdiscussion. See “Item 1A. Risk Factors” and “Item 8. Financial Statements and Supplementary Data – Note 1.” Certain2011 and 2010 amounts have been changed from amounts previously presented to conform to the current presentation.Executive OverviewWe are an independent oil and natural gas company engaged in the acquisition, exploration, exploitation, development andoperation of oil and gas properties. We have been operating in the Gulf Coast Basin since our incorporation in 1993 and haveestablished a technical and operational expertise in this area. We have expanded our reserve base outside of the conventional shelfof the GOM and into the more prolific reserve basins of the GOM deep water and Gulf Coast deep gas as well as onshore oil andgas shale opportunities, including the Marcellus Shale in Appalachia. See “Item 1. Business – Strategy and OperationalOverview.”<strong>2012</strong> Significant Events.Diversification Strategy – In <strong>2012</strong>, we had continued progress in our diversification strategy, resulting in a reserve mix of 44%Appalachia, 34% Deep Water, and 22% Conventional Shelf/Deep Gas on a volume equivalent basis. Additionally, our programsin Appalachia, deep water and deep gas all generated increased reserve volumes in <strong>2012</strong>, resulting in company-wide reservegrowth of over 20% from 2011. Our average reserve life has grown from 5.2 years in 2009 to approximately 8.5 years currently.Issuance of 2017 Convertible Notes – On March 6, <strong>2012</strong>, we issued in a private offering $300 million in aggregate principalamount of 1¾% Senior Convertible Notes due 2017. The net proceeds from the offering after deducting fees and expenses totaled$291.1 million. The notes are convertible into cash, shares of our common stock or a combination of cash and shares of ourcommon stock, at our election, based on an initial conversion rate of 23.4449 shares of our common stock per $1,000 principalamount of 2017 Convertible Notes, which corresponds to an initial conversion price of approximately $42.65 per share of ourcommon stock. In connection with the offering, we entered into convertible note hedge transactions in respect of our commonstock and entered into separate warrant transactions at a higher strike price of $55.91, subject to certain adjustments. The netproceeds from the offering and the proceeds from the warrant transactions were used to fund the cost of the convertible note hedgetransactions, to repay outstanding borrowings under our bank credit facility and to fund capital expenditures. The remainingproceeds will be used for general corporate purposes.Issuance of 2022 Senior Notes – On November 8, <strong>2012</strong>, we completed a public offering of $300 million aggregate principalamount of 7½% Senior Notes due 2022. The net proceeds from the offering after deducting fees and expenses totaled $293.2million. Approximately $204.4 million of the net proceeds from the offering were used to fund the tender offer and consentsolicitation and redemption of our outstanding 6¾% Senior Subordinated Notes due 2014 (the “2014 Notes”). The remainingproceeds will be used for general corporate purposes. As of December 31, 2102, we had approximately $279.5 million of cash onhand.2013 Outlook.Our 2013 capital expenditure budget is approximately $650 million. This figure compares with a $625 million capital budgetfor <strong>2012</strong> and excludes material acquisitions and capitalized salaries, general and administrative expenses and interest. The budgetis spread across our major areas of investment with approximately 29% allocated to the deep water, 8% allocated to deep gasprojects, 27% allocated to the GOM conventional shelf, 33% allocated to the Marcellus Shale and 3% allocated to onshoreexploration projects. The allocation of capital across the various areas is subject to change based on several factors includingpermitting times, rig availability, non-operator decisions, farm-in opportunities and commodity pricing.Known Trends and Uncertainties.Hurricanes – Since the majority of our production originates in the GOM, we are particularly vulnerable to the effects ofhurricanes on production. Additionally, affordable insurance coverage for property damage to our facilities for hurricanes hasbeen difficult to obtain for some time. We have narrowed our insurance coverage to selected properties, increased our deductiblesand are assuming more hurricane related risk in the environment of rising insurance rates. Significant hurricane impacts could29
include reductions and/or deferrals of future oil and natural gas production and revenues, increased lease operating expenses forevacuations and repairs and possible acceleration of plugging and abandonment costs.Louisiana Franchise Taxes – We have been involved in litigation with the State of Louisiana over the proper computation offranchise taxes allocable to the state. This litigation relates to the state’s position that sales of crude oil and natural gas fromproperties located on the OCS, which are transported through the State of Louisiana, should be sourced to Louisiana for purposesof computing franchise taxes. We disagree with the state’s position. However, if the state’s position were to be upheld, we couldincur additional expense for alleged underpaid franchise taxes in prior years and higher franchise tax expense in future years. See“Item 3. Legal Proceedings.”Deep Water Operations – With our acquisition of interests in the Pompano field, we are now operating two significantproperties in the deep water of the GOM. Operations in the deep water can result in increased operational risks as has beendemonstrated by the Deepwater Horizon disaster in 2010. Despite technological advances since this disaster, liabilities forenvironmental losses, personal injury and loss of life and significant regulatory fines in the event of a disaster could be well inexcess of insured amounts and result in significant current losses on our statement of operations as well as going concern issues.Earnings Per Share On March 6, <strong>2012</strong>, we issued $300 million of 2017 Convertible Notes. These notes are convertibleinto cash, shares of our common stock or a combination thereof at our election. Current accounting standards require us to use thetreasury method for determining potential dilution in our diluted earnings per share computation since it is management’s intentionto settle the principal in cash. However, if due to changes in facts and circumstances beyond our control such intention were tochange, or it becomes probable that we will be unable to settle the principal in cash, we could be required to change ourmethodology for determining diluted earnings per share to the if-converted method. The if-converted method would result in asubstantial dilutive effect on diluted earnings per share when compared to the treasury method.Liquidity and Capital ResourcesAt February 21, 2013, we had $379.0 million of availability under our bank credit facility and cash on hand of approximately$315.0 million. Our capital expenditure budget for 2013 has been set at $650 million, which excludes material acquisitions andcapitalized salaries, general and administrative expenses and interest. Based on our outlook of commodity prices and ourestimated production, we expect our 2013 capital expenditures to exceed our cash flow from operating activities. We intend tofinance our capital expenditure budget with cash flow from operating activities and cash on hand.Cash Flow and Working Capital. Net cash flow from operating activities totaled $509.7 million during the year endedDecember 31, <strong>2012</strong> compared to $570.9 million and $424.8 million during the years ended December 31, 2011 and 2010,respectively.Net cash used in investing activities totaled $568.7 million during the year ended December 31, <strong>2012</strong>, which primarilyrepresents our investment in oil and natural gas properties of $555.9 million and our investment in fixed and other assets of $13.4million. Net cash used in investing activities totaled $679.3 million during the year ended December 31, 2011, which primarilyrepresents our investment in oil and natural gas properties of $764.9 million offset by proceeds from the sale of oil and natural gasproperties of $87.9 million. Approximately $270.4 million of the investment in oil and gas properties in 2011 related to leaseholdacquisitions and the acquisition of producing properties. Net cash used in investing activities totaled $374.1 million during theyear ended December 31, 2010, which primarily represents our investment in oil and natural gas properties of $401.8 million offsetby proceeds from the sale of oil and natural gas properties of $31.6 million.Net cash provided by financing activities totaled $300.0 million during the year ended December 31, <strong>2012</strong>. In <strong>2012</strong>, wereceived $291.1 million of net proceeds from the issuance of our 2017 Convertible Notes and $40.1 million of proceeds from theSold Warrants, and used $70.8 million for the cost of the Purchased Call Options (see Notes to Consolidated FinancialStatements – NOTE 11 – Long-Term Debt). Additionally, we received $293.2 million of net proceeds from the issuance of our2022 Notes. During <strong>2012</strong>, we used $200.7 million for the redemption of our 2014 Notes. During the year ended December 31,<strong>2012</strong>, we had $25.0 million of borrowings and $70.0 million of repayments of borrowings under our bank credit facility. Net cashprovided by financing activities totaled $39.9 million for the year ended December 31, 2011, which primarily representsborrowings net of repayments under our bank credit facility of $45.0 million, less $4.0 million of deferred financing costsassociated with our new bank credit facility and $2.6 million of net payments for share based compensation. Net cash used infinancing activities totaled $13.0 million for the year ended December 31, 2010, which primarily represents repayments ofborrowings under our bank credit facility of $175 million, the redemption of our 8¼% Senior Subordinated Notes due 2011 (the“2011 Notes”) of $200.5 million, net of proceeds from the public offering of our 2017 Notes of approximately $375 million less$11.5 million of deferred financing costs.30
We had working capital at December 31, <strong>2012</strong> of $300.3 million. Included in working capital at December 31, <strong>2012</strong> is aportion of the proceeds received from the issuance of the 2017 Convertible Notes and the 2022 Notes.Capital Expenditures. During the year ended December 31, <strong>2012</strong>, additions to oil and gas property costs of $642.5 millionincluded $102.8 million of lease and property acquisition costs, $25.0 million of capitalized salaries, general and administrativeexpenses (inclusive of incentive compensation) and $37.7 million of capitalized interest. These investments were financed withcash flow from operating activities and the net proceeds from the 2017 Convertible Notes.Bank Credit Facility. On April 26, 2011, we entered into an amended and restated revolving credit facility totaling $700million (subject to borrowing base limitations) through a syndicated bank group, replacing our previous facility. Our bank creditfacility matures on April 26, 2015. On October 22, <strong>2012</strong>, our borrowing base under our bank credit facility was reaffirmed at$400 million. As of December 31, <strong>2012</strong> and February 21, 2013, we had no outstanding borrowings under our bank credit facilityand letters of credit totaling $21.0 million had been issued pursuant to the bank credit facility, leaving $379.0 million ofavailability under the facility. Our bank credit facility is guaranteed by our only subsidiary, <strong>Stone</strong> <strong>Energy</strong> Offshore, L.L.C.(“<strong>Stone</strong> Offshore”).The borrowing base under our bank credit facility is redetermined semi-annually, in May and November, by the lenders takinginto consideration the estimated value of our oil and gas properties and those of our direct and indirect material subsidiaries inaccordance with the lenders’ customary practices for oil and gas loans. In addition, we and the lenders each have discretion at anytime, but not more than two additional times in any calendar year, to have the borrowing base redetermined. Our bank creditfacility is collateralized by substantially all of <strong>Stone</strong>’s and <strong>Stone</strong> Offshore’s assets. <strong>Stone</strong> and <strong>Stone</strong> Offshore are required tomortgage, and grant a security interest in, their oil and gas reserves representing at least 80% of the discounted present value of thefuture net cash flows from their oil and gas reserves reviewed in determining the borrowing base. At our option, loans under thebank credit facility will bear interest at a rate based on the adjusted London Interbank Offering Rate plus an applicable margin, ora rate based on the prime rate or Federal funds rate plus an applicable margin.Under the financial covenants of our bank credit facility, we must (i) maintain a ratio of consolidated debt to consolidatedEBITDA, as defined in the credit agreement, for the preceding four quarterly periods of not greater than 3.25 to 1 and (ii) maintaina ratio of consolidated EBITDA to consolidated Net Interest Expense, as defined in the credit agreement, for the preceding fourquarterly periods of not less than 3.0 to 1. As of December 31, <strong>2012</strong>, our debt to EBITDA Ratio was 1.55 to 1 and our EBITDAto consolidated Net Interest Expense Ratio was approximately 21.56 to 1. In addition, the bank credit facility includes certaincustomary restrictions or requirements with respect to disposition of properties, incurrence of additional debt, change of ownershipand reporting responsibilities. These covenants may limit or prohibit us from paying cash dividends but do allow for limited stockrepurchases. These covenants also restrict our ability to prepay other indebtedness under certain circumstances.7½% Senior Notes due 2022. On November 8, <strong>2012</strong>, we completed the public offering of $300 million aggregate principalamount of our 2022 Notes. The net proceeds from the offering after deducting underwriting discounts, commissions, fees andexpenses totaled $293.2 million. Approximately $204.4 million of the net proceeds from the offering were used to fund the tenderoffer and consent solicitation and redemption of our outstanding 2014 Notes. The remaining proceeds will be used for generalcorporate purposes.6¾% Senior Subordinated Notes due 2014. In November <strong>2012</strong>, we used proceeds from the 2022 Notes offering to purchaseour 2014 Notes pursuant to a tender offer and consent solicitation. In December <strong>2012</strong>, the remaining 2014 Notes were redeemedin full. The total cost of the redemption was $204.4 million, which included $200.7 million to redeem the notes plus accrued andunpaid interest of $3.7 million. The transaction resulted in a charge to earnings of $2.0 million in <strong>2012</strong>.1¾% Senior Convertible Notes due 2017. On March 6, <strong>2012</strong>, we issued in a private offering $300 million in aggregateprincipal amount of 2017 Convertible Notes to qualified institutional buyers pursuant to Rule 144A under the Securities Act. Thenet proceeds from the sale of the 2017 Convertible Notes were $291.1 million, after deducting fees and expenses. The 2017Convertible Notes mature on March 1, 2017, unless earlier converted or repurchased. We may not redeem the 2017 ConvertibleNotes at our option prior to the maturity date.The 2017 Convertible Notes are convertible into cash, shares of our common stock or a combination of cash and shares of ourcommon stock, at our election, based on an initial conversion rate of 23.4449 shares of our common stock per $1,000 principalamount of 2017 Convertible Notes, which corresponds to an initial conversion price of approximately $42.65 per share of ourcommon stock. On December 31, <strong>2012</strong>, our closing share price was $20.52. The conversion rate, and thus the conversion price,may be adjusted under certain circumstances as described in the indenture related to the 2017 Convertible Notes. Upon31
conversion, we will be obligated to pay or deliver, as the case may be, cash, shares of our common stock or a combination of cashand shares of our common stock, at our election. Prior to December 1, 2016, the 2017 Convertible Notes will be convertible onlyupon the occurrence of certain events and during certain periods, and thereafter, at any time until the second scheduled trading dayimmediately preceding the maturity date.In connection with the offering, we entered into convertible note hedge transactions in respect of our common stock. Theseconvertible note hedge transactions are expected to reduce the potential dilution upon future conversion of the 2017 ConvertibleNotes. In addition, we entered into separate warrant transactions at a higher strike price. The warrant transactions couldseparately have a dilutive effect to the extent that the market value per share of our common stock exceeds the applicable strikeprice of the warrants.We applied a portion of the net proceeds of $291.1 million from the sale of the 2017 Convertible Notes and the proceeds fromthe warrant transactions of $40.1 million to fund the cost of the convertible note hedge transactions of $70.8 million. We also useda portion of the net proceeds to repay $70 million of outstanding borrowings under our bank credit facility.Share Repurchase Program. On September 24, 2007, our board of directors authorized a share repurchase program for anaggregate amount of up to $100 million. The shares may be repurchased from time to time in the open market or through privatelynegotiated transactions. The repurchase program is subject to business and market conditions, and may be suspended ordiscontinued at any time. Through December 31, <strong>2012</strong>, 300,000 shares had been repurchased under this program at a total cost ofapproximately $7.1 million, or an average price of $23.57 per share. No shares were repurchased during the years endedDecember 31, <strong>2012</strong>, 2011 or 2010.Hedging. See “Item 7A. Quantitative and Qualitative Disclosures About Market Risk – Commodity Price Risk.”Contractual Obligations and Other CommitmentsThe following table summarizes our significant contractual obligations and commitments, other than hedging contracts, bymaturity as of December 31, <strong>2012</strong> (in thousands):Lessthan1 Year 1-3 Years 4-5 YearsMorethan5 YearsTotalContractual Obligations and Commitments:1¾% Senior Convertible Notes due 2017 .............. $300,000 $ - $ - $300,000 $ -8⅝% Senior Notes due 2017 ................................. 375,000 - - 375,000 -7½% Senior Notes due 2022 ................................. 300,000 - - - 300,000Interest and commitment fees (1) ......................... 383,975 62,015 121,546 87,914 112,500Asset retirement obligations including accretion ... 878,551 68,142 233,123 100,054 477,232Rig commitments .................................................. 33,712 33,712 - - -Seismic data commitments (2) .............................. 18,587 11,087 7,500 - -Operating lease obligations ................................... 2,237 612 1,080 463 82Total Contractual Obligations and Commitments ..... $2,292,062 $175,568 $363,249 $863,431 $889,814(1) Includes interest payable on the 2017 Notes, 2022 Notes and 2017 Convertible Notes. Assumes 0.5% fee on unusedcommitments under the bank credit facility.(2) Represents pre-commitments for seismic data purchases.32
Safety PerformanceWe measure our safety performance based on the total recordable incident rate (“TRIR”), which is the number of safetyincidents per 200,000 man-hours worked for employees and certain contractors. All onshore safety incidents are reported to theOccupational Safety and Health Administration (“OSHA”) and are tracked on OSHA Form 301. All offshore safety incidents arereported to the BOEM. Our TRIR is provided to the BOEM as part of a voluntary program for safety monitoring in the GOM.Our TRIR for the last three calendar years was as follows:Year EndedDecember 31,TRIRPerformanceTRIRGoal<strong>2012</strong> 0.45 0.552011 0.33 0.652010 0.51 0.65Our safety initiative includes formal programs for observation and reporting of at-risk and safe behavior in and away from thework place, employee awards for results and observations, employee participation in offsite training programs and internal safetyaudits. We have an annual cash incentive compensation plan that includes a safety component based on our annual TRIR.Results of Operations<strong>2012</strong> Compared to 2011. The following table sets forth certain information with respect to our oil and gas operations andsummary information with respect to our estimated proved oil and gas reserves. See "Item 2. Properties – Oil and Natural GasReserves."Year Ended December 31,<strong>2012</strong> 2011 Variance % ChangeProduction:Oil (MBbls)............................................................. 7,135 6,427 708 11%Natural gas (MMcf) ............................................... 42,569 38,466 4,103 11%Natural gas liquids (MBbls) ................................... 1,163 506 657 130%Oil, natural gas and NGLs (MMcfe) ...................... 92,357 80,064 12,293 15%Average prices: (1)Oil (per Bbl)............................................................ $106.70 $103.31 $3.39 3%Natural gas (per Mcf) ............................................. 3.17 4.44 (1.27) (29%)Natural gas liquids (per Bbl) .................................. 41.70 59.28 (17.58) (30%)Oil, natural gas and NGLs (per Mcfe) ................... 10.23 10.80 (0.57) (5%)Expenses (per Mcfe):Lease operating expenses ....................................... $2.33 $2.20 $0.13 6%Salaries, general and administrative expenses (2) .. 0.59 0.50 0.09 18%DD&A expense on oil and gas properties ............... 3.69 3.45 0.24 7%Estimated Proved Reserves at December 31:Oil (MBbls)............................................................. 44,918 45,655 (737) (2%)Natural gas (MMcf) ................................................ 395,374 325,479 69,895 22%Natural gas liquids (MBbls).................................... 18,066 4,405 13,661 310%Oil, natural gas and NGLs (MMcfe)....................... 773,285 625,839 147,446 24%(1) Includes the settlement of effective hedging contracts.(2) Exclusive of incentive compensation expense.Net Income. For the year ended December 31, <strong>2012</strong>, we reported net income totaling $149.4 million, or $3.03 per share,compared to net income for the year ended December 31, 2011 of $194.3 million, or $3.97 per share. All per share amounts are ona diluted basis.In the first quarter of <strong>2012</strong>, we began reporting NGL volumes and revenues separately from gas volumes. Historically, wereported “wet” gas volumes, which included entrained liquids. We now report NGLs and “dry” gas (shrunk for removal of liquids)volumes. Production volumes, revenues and prices for the year ended December 31, 2011 have been reclassified to conform to thecurrent presentation.33
The variance in annual results was due to the following components:Production. During the year ended December 31, <strong>2012</strong>, total production volumes increased to 92.4 Bcfe compared to 80.1Bcfe produced during the comparable 2011 period, representing a 15% increase. Oil production during the year ended December31, <strong>2012</strong> totaled approximately 7,135,000 Bbls compared to 6,427,000 Bbls produced during the year ended December 31, 2011;natural gas production totaled 42.6 Bcf during the year ended December 31, <strong>2012</strong> compared to 38.5 Bcf produced during thecomparable period of 2011; and NGL production during the year ended December 31, <strong>2012</strong> totaled approximately 1,163,000 Bblscompared to 506,000 Bbls produced during the comparable period of 2011. The increase in NGL production resulted from ourliquids rich Pompano and Appalachia gas streams coming on line. Production commenced from our deep water Pyrenees well atGarden Banks 293 during the first quarter of <strong>2012</strong>. Included in production for the year ended December 31, <strong>2012</strong> is productionfrom our Pompano field, which was acquired in December 2011.Prices. Prices realized during the year ended December 31, <strong>2012</strong> averaged $106.70 per Bbl of oil, $3.17 per Mcf of naturalgas and $41.70 per Bbl of NGLs, or 5% lower, on an Mcfe basis, than 2011 average realized prices of $103.31 per Bbl of oil,$4.44 per Mcf of natural gas and $59.28 per Bbl of NGLs. All unit pricing amounts include the settlement of effective hedgingcontracts.We enter into various hedging contracts in order to reduce our exposure to the possibility of declining oil and gas prices.During the year ended December 31, <strong>2012</strong>, effective hedging transactions increased our average realized natural gas price by $0.52per Mcf and increased our average realized oil price by $1.20 per Bbl. During the year ended December 31, 2011, effectivehedging transactions increased our average realized natural gas price by $0.51 per Mcf and decreased our average realized oil priceby $5.09 per Bbl.Revenue. Oil, natural gas and NGL revenue increased 9% to $944.5 million during the year ended December 31, <strong>2012</strong> from$864.6 million during the year ended December 31, 2011. The increase was attributable to a 15% increase in production quantitieson a gas equivalent basis, partially offset by a 5% decrease in average realized prices.Expenses. Lease operating expenses for the years ended December 31, <strong>2012</strong> and 2011 totaled $215.0 million and $175.9million, respectively. The increase in lease operating expenses in <strong>2012</strong> was primarily attributable to the impact of expenses at ourPompano field, which was acquired in December 2011, as well as seasonal major maintenance projects.Transportation, processing and gathering expenses during the years ended December 31, <strong>2012</strong> and 2011 totaled $21.8 millionand $9.0 million, respectively. The increase resulted from our liquids rich Pompano and Appalachia gas streams coming on line inearly <strong>2012</strong>.For the year ended December 31, 2011, other operational expenses of $2.1 million included $0.7 million for the settlement oflitigation associated with an expensed operation in the first quarter of 2011, a $0.3 million loss on the sale of non-dedicated tubularinventory and $1.1 million of miscellaneous inventory charges.Depreciation, depletion and amortization (“DD&A”) expense on oil and gas properties for the year ended December 31, <strong>2012</strong>totaled $341.1 million, or $3.69 per Mcfe, compared to DD&A expense of $276.5 million, or $3.45 per Mcfe, for the year endedDecember 31, 2011. The increase in DD&A expense on a unit basis in <strong>2012</strong> was attributable to the unit cost of current year netreserve additions (including future development costs) exceeding the per unit amortizable base as of the beginning of the year.For the years ended December 31, <strong>2012</strong> and 2011, salaries, general and administrative (“SG&A”) expenses (exclusive ofincentive compensation) totaled $54.6 million and $40.2 million, respectively. The increase in SG&A expenses in <strong>2012</strong> wasprimarily the result of increased staffing and compensation adjustments (including stock based compensation) and a managementfee of $1.0 million for transition services related to our Pompano acquisition. In 2011, there was a $3.9 million credit to SG&Aexpenses, including previously unaccrued insurance proceeds.For the years ended December 31, <strong>2012</strong> and 2011, incentive compensation expense totaled $8.1 million and $11.6 million,respectively. These amounts related to incentive compensation bonuses calculated based on the achievement of certain strategicobjectives for each fiscal year.Interest expense for the year ended December 31, <strong>2012</strong> totaled $30.4 million, net of $37.7 million of capitalized interest,compared to interest expense of $9.3 million, net of $42.0 million of capitalized interest, during the year ended December 31,2011. The increase in interest expense is primarily the result of interest associated with the 2017 Convertible Notes issued onMarch 6, <strong>2012</strong>.34
2011 Compared to 2010. The following table sets forth certain information with respect to our oil and gas operations andsummary information with respect to our estimated proved oil and gas reserves. See "Item 2. Properties – Oil and Natural GasReserves."Year Ended December 31,2011 2010 Variance % ChangeProduction:Oil (MBbls)............................................................. 6,427 5,714 713 12%Natural gas (MMcf) ............................................... 38,466 41,168 (2,702) (7%)Natural gas liquids (MBbls) ................................... 506 574 (68) (12%)Oil, natural gas and NGLs (MMcfe) ...................... 80,064 78,896 1,168 1%Average prices: (1)Oil (per Bbl)............................................................ $103.31 $73.14 $30.17 41%Natural gas (per Mcf) ............................................. 4.44 5.12 (0.68) (13%)Natural gas liquids (per Bbl) .................................. 59.28 47.86 11.42 24%Oil, natural gas and NGLs (per Mcfe) ................... 10.80 8.32 2.48 30%Expenses (per Mcfe):Lease operating expenses ....................................... $2.20 $1.90 $0.30 16%Salaries, general and administrative expenses (2) .. 0.50 0.54 (0.04) (7%)DD&A expense on oil and gas properties ............... 3.45 3.08 0.37 12%Estimated Proved Reserves at December 31:Oil (MBbls)............................................................. 45,655 33,203 12,452 38%Natural gas (MMcf) ................................................ 325,479 274,705 50,774 18%Natural gas liquids (MBbls).................................... 4,405 - 4,405 N/AOil, natural gas and NGLs (MMcfe)....................... 625,839 473,923 151,916 32%(1) Includes the settlement of effective hedging contracts.(2) Exclusive of incentive compensation expense.Net Income. For the year ended December 31, 2011, we reported net income totaling $194.3 million, or $3.97 per share,compared to net income for the year ended December 31, 2010 of $96.4 million, or $1.99 per share. All per share amounts are ona diluted basis.In the first quarter of <strong>2012</strong>, we began reporting NGL volumes and revenues separately from gas volumes. Historically, wereported “wet” gas volumes, which included entrained liquids. We now report NGLs and “dry” gas (shrunk for removal of liquids)volumes. Production volumes, revenues and prices for the years ended December 31, 2011 and 2010 have been reclassified toconform to the current presentation.The variance in annual results was due to the following components:Production. During the year ended December 31, 2011, total production volumes increased to 80.1 Bcfe compared to 78.9Bcfe produced during the comparable 2010 period. Oil production during the year ended December 31, 2011 totaledapproximately 6,427,000 Bbls compared to 5,714,000 Bbls produced during the year ended December 31, 2010; natural gasproduction totaled 38.5 Bcf during the year ended December 31, 2011 compared to 41.2 Bcf produced during the comparableperiod of 2010; and NGL production during the year ended December 31, 2011 totaled approximately 506,000 Bbls compared to574,000 Bbls produced during the comparable period of 2010. The increase in oil production volumes was primarily due toincreases in production at our Mississippi Canyon Block 109 and Ship Shoal Block 113 fields where we had developmentoperations. The decrease in gas production volumes was primarily due to natural production declines.Prices. Prices realized during the year ended December 31, 2011 averaged $103.31 per Bbl of oil, $4.44 per Mcf of natural gasand $59.28 per Bbl of NGLs, or 30% higher, on an Mcfe basis, than 2010 average realized prices of $73.14 per Bbl of oil, $5.12per Mcf of natural gas and $47.86 per Bbl of NGLs. All unit pricing amounts include the settlement of effective hedgingcontracts.We enter into various hedging contracts in order to reduce our exposure to the possibility of declining oil and gas prices.During the year ended December 31, 2011, effective hedging transactions increased our average realized natural gas price by $0.51per Mcf and decreased our average realized oil price by $5.09 per Bbl. During the year ended December 31, 2010, effective35
hedging transactions increased our average realized natural gas price by $0.94 per Mcf and decreased our average realized oil priceby $5.09 per Bbl.Revenue. Oil, natural gas and NGL revenue increased 32% to $864.6 million during the year ended December 31, 2011 from$656.1 million during the year ended December 31, 2010. The increase was primarily due to a 41% increase in average realizedoil prices along with a 12% increase in oil production volumes, partially offset by a decline in average realized gas prices and gasproduction volumes.Expenses. Lease operating expenses for the years ended December 31, 2011 and 2010 totaled $175.9 million and $150.2million, respectively. On a unit of production basis, lease operating expenses were $2.20 per Mcfe and $1.90 per Mcfe for theyears ended December 31, 2011 and 2010, respectively. The increase in lease operating expenses in 2011 was primarilyattributable to increased platform and well maintenance.For the year ended December 31, 2011, other operational expenses of $2.1 million included $0.7 million for the settlement oflitigation associated with an expensed operation in the first quarter of 2011, a $0.3 million loss on the sale of non-dedicated tubularinventory and $1.1 million of miscellaneous inventory charges. For the year ended December 31, 2010, other operationalexpenses of $5.6 million included a $2.2 million loss on the sale of non-dedicated tubular inventory and a total of $3.3 million ofcharges related to a delay in the drilling of the second well in our Amberjack drilling program as a result of the deep water drillingmoratorium.DD&A expense on oil and gas properties for the year ended December 31, 2011 totaled $276.5 million, or $3.45 per Mcfe,compared to DD&A expense of $242.7 million, or $3.08 per Mcfe, for the year ended December 31, 2010. The increase in DD&Aexpense in 2011 on a unit basis was primarily attributable to the unit cost of current year net reserve additions (including futuredevelopment costs) exceeding the per unit amortizable base as of the beginning of the year. The average unit cost of the Pompanofield deep water assets had a minimal impact on the DD&A rate because the acquisition occurred late in the year.For the years ended December 31, 2011 and 2010, incentive compensation expense totaled $11.6 million and $5.9 million,respectively. These amounts related to incentive compensation bonuses calculated based on the achievement of certain strategicobjectives for each fiscal year.Interest expense for the year ended December 31, 2011 totaled $9.3 million, net of $42.0 million of capitalized interest,compared to interest expense of $12.2 million, net of $30.8 million of capitalized interest, during the year ended December 31,2010. The decrease in interest expense is primarily the result of an increase in the amount of interest capitalized as a part of thecost of oil and gas properties.Off-Balance Sheet ArrangementsWe have no off-balance sheet arrangements.Forward-Looking StatementsCertain of the statements set forth under this item and elsewhere in this Form 10-K are forward-looking and are based uponassumptions and anticipated results that are subject to numerous risks and uncertainties. See “Item 1. Business — Forward-Looking Statements” and “Item 1A. Risk Factors.”Accounting Matters and Critical Accounting EstimatesFair Value Measurements. U.S. Generally Accepted Accounting Principles (“GAAP”), as codified, establish a framework formeasuring fair value and require certain disclosures about fair value measurements. There is an established fair value hierarchythat has three levels based on the reliability of the inputs used to determine the fair value. These levels include: Level 1, defined asinputs such as unadjusted quoted prices in active markets for identical assets or liabilities; Level 2, defined as inputs other thanquoted prices in active markets that are either directly or indirectly observable; and Level 3, defined as unobservable inputs for usewhen little or no market data exists, therefore requiring an entity to develop its own assumptions.As of December 31, <strong>2012</strong>, we held certain financial assets and liabilities that are required to be measured at fair value on arecurring basis, including our commodity derivative instruments and our investments in marketable securities. Additionally, fairvalue concepts were applied in recording the acquisition of various deep water assets in <strong>2012</strong> and 2011 and the acquisition of anoffice building in <strong>2012</strong>.36
Business Combinations. Our acquisitions in <strong>2012</strong> and 2011 of various deep water assets were accounted for according to theguidance provided in Accounting Standards Codification (“ASC”) 805, Business Combinations, which requires application of theacquisition method. This methodology requires the recordation of net assets acquired and consideration transferred at fair value.Differences between the net fair value of assets acquired and consideration transferred are recorded as goodwill or a bargainpurchase gain.Asset Retirement Obligations. We are required to record our estimate of the fair value of liabilities related to future assetretirement obligations in the period the obligation is incurred. Asset retirement obligations relate to the removal of facilities andtangible equipment at the end of an oil and gas property’s useful life. The guidance regarding asset retirement obligations requiresthe use of management’s estimates with respect to future abandonment costs, inflation, market risk premiums, useful life and cost ofcapital. Our estimate of our asset retirement obligations does not give consideration to the value the related assets could have toother parties.Full Cost Method. We follow the full cost method of accounting for our oil and gas properties. Under this method, allacquisition, exploration, development and estimated abandonment costs, including certain related employee and general andadministrative costs (less any reimbursements for such costs) and interest incurred for the purpose of acquiring and finding oil andgas are capitalized. Unevaluated property costs are excluded from the amortization base until we have made a determination as tothe existence of proved reserves on the respective property or impairment. We review our unevaluated properties at the end ofeach quarter to determine whether the costs should be reclassified to evaluated properties and thereby subject to amortization.Sales of oil and gas properties are accounted for as adjustments to the net full cost pool with no gain or loss recognized, unless theadjustment would significantly alter the relationship between capitalized costs and proved reserves.We amortize our investment in oil and gas properties through DD&A expense using the units of production (“UOP”) method.Under the UOP method, the quarterly provision for DD&A expense is computed by dividing production volumes for the period bythe total proved reserves as of the beginning of the period (beginning of the period reserves being determined by adding backproduction to end of the period reserves), and applying the respective rate to the net cost of proved oil and gas properties, includingfuture development costs.We capitalize a portion of the interest costs incurred on our debt based upon the balance of our unevaluated property costs andour weighted-average borrowing rate. We also capitalize the portion of salaries, general and administrative expenses that areattributable to our acquisition, exploration and development activities.U.S. GAAP allows the option of two acceptable methods for accounting for oil and gas properties. The successful effortsmethod is the allowable alternative to the full cost method. The primary differences between the two methods are in the treatmentof exploration costs and in the computation of DD&A expense. Under the full cost method, all exploratory costs are capitalizedwhile under the successful efforts method exploratory costs associated with unsuccessful exploratory wells and all geological andgeophysical costs are expensed. Under the full cost method, DD&A expense is computed on cost centers represented by entirecountries while under the successful efforts method cost centers are represented by properties, or some reasonable aggregation ofproperties with common geological structural features or stratigraphic condition, such as fields or reservoirs.Under the full cost method, we compare, at the end of each financial reporting period, the present value of estimated future netcash flows from proved reserves (excluding cash flows related to estimated abandonment costs), to the net capitalized costs ofproved oil and gas properties net of related deferred taxes. We refer to this comparison as a “ceiling test.” If the net capitalizedcosts of proved oil and gas properties exceed the estimated discounted future net cash flows from proved reserves, we are requiredto write-down the value of our oil and gas properties to the value of the discounted cash flows. Estimated future net cash flowsfrom proved reserves are calculated based on a 12-month average pricing assumption.Derivative Instruments and Hedging Activities. The nature of a derivative instrument must be evaluated to determine if itqualifies for hedge accounting treatment. We do not use derivative instruments for trading purposes. Instruments qualifying forhedge accounting treatment are recorded as an asset or liability measured at fair value and subsequent changes in fair value arerecognized in equity through other comprehensive income, net of related taxes, to the extent the hedge is effective. Instrumentsnot qualifying for hedge accounting treatment are recorded in the balance sheet and changes in fair value are recognized inearnings.Use of Estimates. The preparation of financial statements in conformity with U.S. GAAP requires us to make estimates andassumptions that affect the reported amounts of assets and liabilities, the disclosure of contingent assets and liabilities at the date ofthe financial statements and the reported amounts of revenue and expenses during the reporting period. Actual results could differfrom those estimates. Our most significant estimates are:37
emaining proved oil and gas reserve volumes and the timing of their production;estimated costs to develop and produce proved oil and gas reserves;accruals of exploration costs, development costs, operating costs and production revenue;timing and future costs to abandon our oil and gas properties;the effectiveness and estimated fair value of derivative positions;classification of unevaluated property costs;capitalized general and administrative costs and interest;insurance recoveries;estimates of fair value in business combinations;current and deferred income taxes; andcontingencies.For a more complete discussion of our accounting policies and procedures see our “Notes to Consolidated FinancialStatements” beginning on page F-8.Recent Accounting DevelopmentsNone.ITEM 7A. QUANTITATIVE AND QUALITATIVE DISCLOSURES ABOUT MARKET RISKCommodity Price Risk. Our major market risk exposure continues to be the pricing applicable to our oil and natural gasproduction. Our revenues, profitability and future rate of growth depend substantially upon the market prices of oil and naturalgas, which fluctuate widely. Oil and natural gas price declines and volatility could adversely affect our revenues, cash flows andprofitability. Price volatility is expected to continue. Assuming a 10% decline in realized oil and natural gas prices, including theeffects of hedging contracts, we estimate our diluted net income per share for <strong>2012</strong> would have decreased approximately $1.22 pershare. In order to manage our exposure to oil and natural gas price declines, we occasionally enter into oil and natural gas pricehedging arrangements to secure a price for a portion of our expected future production. Our hedging policy provides that not morethan 50% of our estimated production quantities can be hedged without the consent of the board of directors.We have entered into fixed-price swaps with various counterparties for a portion of our expected 2013, 2014 and 2015 oil andnatural gas production from the Gulf Coast Basin. Some of our fixed-price oil swap settlements are based on an average of theNYMEX closing price for West Texas Intermediate during the entire calendar month, and some are based on the average of theICE closing price for Brent crude oil during the entire calendar month. Our fixed-price gas swap settlements are based on theNYMEX price for the last day of a respective contract month. Swaps typically provide for monthly payments by us if prices riseabove the swap price or to us if prices fall below the swap price. Our fixed-price swap contracts are with The Toronto-DominionBank, Barclays Bank PLC, BNP Paribas, The Bank of Nova Scotia, Bank of America and Natixis.38
The following table illustrates our hedging positions for calendar years 2013, 2014 and 2015 as of February 21, 2013:Fixed-Price SwapsNYMEX (except where noted)Natural GasOilDaily Volume(MMBtus/d)SwapPrice ($)Daily Volume(Bbls/d)SwapPrice ($)2013 ............. 10,000 4.000 1,000 92.802013 ............. 10,000 5.270 2,000* 94.052013 ............. 10,000 5.320 1,000 94.452013 ............. 1,000 94.602013 ............. 1,000 97.152013 ............. 1,000 101.532013 ............. 1,000 103.002013 ............. 1,000 103.152013 ............. 1,000 104.252013 ............. 1,000 104.472013 ............. 1,000 104.502013 ............. 1,000 † 107.302014 ............. 10,000 4.000 1,000 90.062014 ............. 10,000 4.040 1,000 93.552014 ............. 10,000 4.105 1,000 94.002014 ............. 10,000 4.250 1,000 98.002014 ............. 1,000 98.302014 ............. 1,000 99.652014 ............. 1,000 † 103.302015 ............. 10,000 4.005 1,000 90.002015 ............. 10,000 4.2202015 ............. 10,000 4.255† Brent oil contract* January through JuneWe believe these positions have hedged approximately 39% of our estimated 2013 production from estimated proved reserves,34% of our estimated 2014 production from estimated proved reserves and 18% of our estimated 2015 production from estimatedproved reserves.Interest Rate Risk. We had total debt outstanding of $914.1 million at December 31, <strong>2012</strong>, all of which bears interest at fixedrates. The $914.1 million of fixed-rate debt is comprised of $239.1 million ($300 million face value) of 2017 Convertible Notes,$375 million of 2017 Notes and $300 million of 2022 Notes.ITEM 8. FINANCIAL STATEMENTS AND SUPPLEMENTARY DATAInformation concerning this Item begins on Page F-1.39
ITEM 9. CHANGES IN AND DISAGREEMENTS WITH ACCOUNTANTS ON ACCOUNTING AND FINANCIALDISCLOSUREThere have been no disagreements with our independent registered public accounting firm on our accounting or financialreporting that would require our independent registered public accounting firm to qualify or disclaim its report on our financialstatements, or otherwise require disclosure in this <strong>Annual</strong> <strong>Report</strong> on Form 10-K.ITEM 9A. CONTROLS AND PROCEDURESEvaluation of Disclosure Controls and ProceduresAs required by Rule 13a-15(b) of the Exchange Act, we have evaluated, under the supervision and with the participation of ourmanagement, including our principal executive officer and principal financial officer, the effectiveness of the design and operationof our disclosure controls and procedures (as defined in Rules 13a-15(e) and 15d-15(e) of the Exchange Act) as of the end of theperiod covered by this <strong>Annual</strong> <strong>Report</strong> on Form 10-K. Our disclosure controls and procedures are designed to provide reasonableassurance that the information required to be disclosed by us in reports that we file or submit under the Exchange Act isaccumulated and communicated to our management, including our principal executive officer and principal financial officer, asappropriate, to allow timely decisions regarding required disclosure and is recorded, processed, summarized and reported withinthe time periods specified in the rules and forms of the SEC. Based upon the evaluation, our principal executive officer andprincipal financial officer have concluded that our disclosure controls and procedures were effective as of December 31, <strong>2012</strong> atthe reasonable assurance level.Changes in Internal Controls Over Financial <strong>Report</strong>ingThere has not been any change in our internal control over financial reporting that occurred during the quarter ended December31, <strong>2012</strong> that has materially affected, or is reasonably likely to materially affect, our internal control over financial reporting.Management’s <strong>Report</strong> on Internal Control over Financial <strong>Report</strong>ingOur management is responsible for establishing and maintaining adequate internal control over financial reporting, as such termis defined by the Exchange Act. Under the supervision and with the participation of our management, including the principalexecutive officer and principal financial officer, we conducted an evaluation of the effectiveness of our internal control overfinancial reporting as of December 31, <strong>2012</strong>. In making this assessment, we used the criteria established in Internal Control-Integrated Framework issued by the Committee of Sponsoring Organizations of the Treadway Commission (COSO). Based on ourevaluation, we have concluded that our internal controls over financial reporting were effective as of December 31, <strong>2012</strong>. Ernstand Young LLP, an independent public accounting firm, has issued its report on the company’s internal control over financialreporting as of December 31, <strong>2012</strong>.40
The Stockholders and Board of Directors<strong>Stone</strong> <strong>Energy</strong> <strong>Corporation</strong>REPORT OF INDEPENDENT REGISTERED PUBLIC ACCOUNTING FIRMWe have audited <strong>Stone</strong> <strong>Energy</strong> <strong>Corporation</strong>’s internal control over financial reporting as of December 31, <strong>2012</strong>, based on criteriaestablished in Internal Control—Integrated Framework issued by the Committee of Sponsoring Organizations of the TreadwayCommission (the COSO criteria). <strong>Stone</strong> <strong>Energy</strong> <strong>Corporation</strong>’s management is responsible for maintaining effective internalcontrol over financial reporting, and for its assessment of the effectiveness of internal control over financial reporting included inthe accompanying Management’s <strong>Report</strong> on Internal Control Over Financial <strong>Report</strong>ing. Our responsibility is to express an opinionon the Company’s internal control over financial reporting based on our audit.We conducted our audit in accordance with the standards of the Public Company Accounting Oversight Board (United States).Those standards require that we plan and perform the audit to obtain reasonable assurance about whether effective internal controlover financial reporting was maintained in all material respects. Our audit included obtaining an understanding of internal controlover financial reporting, assessing the risk that a material weakness exists, testing and evaluating the design and operatingeffectiveness of internal control based on the assessed risk, and performing such other procedures as we considered necessary inthe circumstances. We believe that our audit provides a reasonable basis for our opinion.A company’s internal control over financial reporting is a process designed to provide reasonable assurance regarding thereliability of financial reporting and the preparation of financial statements for external purposes in accordance with generallyaccepted accounting principles. A company’s internal control over financial reporting includes those policies and procedures that(1) pertain to the maintenance of records that, in reasonable detail, accurately and fairly reflect the transactions and dispositions ofthe assets of the company; (2) provide reasonable assurance that transactions are recorded as necessary to permit preparation offinancial statements in accordance with generally accepted accounting principles, and that receipts and expenditures of thecompany are being made only in accordance with authorizations of management and directors of the company; and (3) providereasonable assurance regarding prevention or timely detection of unauthorized acquisition, use, or disposition of the company’sassets that could have a material effect on the financial statements.Because of its inherent limitations, internal control over financial reporting may not prevent or detect misstatements. Also,projections of any evaluation of effectiveness to future periods are subject to the risk that controls may become inadequate becauseof changes in conditions, or that the degree of compliance with the policies or procedures may deteriorate.In our opinion, <strong>Stone</strong> <strong>Energy</strong> <strong>Corporation</strong> maintained, in all material respects, effective internal control over financial reporting asof December 31, <strong>2012</strong>, based on the COSO criteria.We also have audited, in accordance with the standards of the Public Company Accounting Oversight Board (United States), theconsolidated balance sheets of <strong>Stone</strong> <strong>Energy</strong> <strong>Corporation</strong> as of December 31, <strong>2012</strong> and 2011, and the related consolidatedstatements of operations, comprehensive income, cash flows and changes in stockholders’ equity for each of the three years in theperiod ended December 31, <strong>2012</strong> and our report dated February 27, 2013 expressed an unqualified opinion thereon.New Orleans, LouisianaFebruary 27, 2013/s/Ernst & Young LLP41
ITEM 9B. OTHER INFORMATIONNone.PART IIIITEM 10. DIRECTORS, EXECUTIVE OFFICERS AND CORPORATE GOVERNANCEThe following table sets forth information regarding the names, ages (as of February 21, 2013) and positions held by each ofour executive officers, followed by biographies describing the business experience of our executive officers for at least the pastfive years. Our executive officers serve at the discretion of the board of directors.Name Age PositionDavid H. Welch ..................................... 64 President, Chief Executive Officer and DirectorKenneth H. Beer .................................... 55 Executive Vice President and Chief Financial OfficerAndrew L. Gates, III .............................. 65 Senior Vice President, General Counsel and SecretaryKevin G. Hurst ....................................... 53 Vice President – GOM Shelf/Deep GasE. J. Louviere ......................................... 64 Senior Vice President – LandJ. Kent Pierret ........................................ 57 Senior Vice President, Chief Accounting Officer and TreasurerKeith A. Seilhan .................................... 46 Vice President – Deep WaterRichard L. Toothman, Jr. ....................... 48 Vice President – AppalachiaPaul K. Wieg ......................................... 54 Vice President – Exploration and Business DevelopmentFlorence M. Ziegler ............................... 52 Vice President – Human Resources and AdministrationDavid H. Welch was appointed President, Chief Executive Officer and a director of the Company effective April 1, 2004. Priorto joining <strong>Stone</strong>, Mr. Welch served as Senior Vice President of BP America, Inc. since 2003, and Vice President of BP, Inc. since1999.Kenneth H. Beer was named Executive Vice President and Chief Financial Officer in January 2011. Previously, he served asSenior Vice President and Chief Financial Officer since August 2005. Prior to joining <strong>Stone</strong>, he served as a director of researchand a senior energy analyst at the investment banking firm of Johnson Rice & Company. Prior to joining Johnson Rice &Company in 1992, he was an energy analyst and investment banker at Howard Weil Incorporated.Andrew L. Gates, III was named Senior Vice President, General Counsel and Secretary in April 2004. He previously servedas Vice President, General Counsel and Secretary since August 1995.Kevin G. Hurst was named Vice President – GOM Shelf/Deep Gas on February 1, 2013. He previously served as GeneralManager of Operations/GOM Production from January <strong>2012</strong> through February 1, 2013. He served as Operations Manager – GOMProduction from January 2011 through January <strong>2012</strong> and Production Manager from December 2007 through January 2011. Priorto joining <strong>Stone</strong> in 2007, he worked for MODEC, LLC as the General Manager for FPSO/FSO Operations. Mr. Hurst has alsoworked for Southern Natural Gas Company/El Paso <strong>Energy</strong> Company and worked for 16 years for Arco serving in variouscapacities.E. J. Louviere was named Senior Vice President – Land in April 2004. Previously, he served as Vice President – Land sinceJune 1995. He has been employed by <strong>Stone</strong> since its inception in 1993.J. Kent Pierret was named Senior Vice President, Chief Accounting Officer and Treasurer in April 2004. Mr. Pierretpreviously served as Vice President and Chief Accounting Officer since June 1999 and Treasurer since February 2004.Keith S. Seilhan was named Vice President – Deep Water on February 1, 2013. He previously served as Deep Water ProjectsManager since joining <strong>Stone</strong> in July <strong>2012</strong>. Prior to joining <strong>Stone</strong>, Mr. Seilhan filled various senior leadership roles for Amoco andBP over his 21 year career. In his final year with BP, he filled the role as BP’s Incident Commander on the Deepwater HorizonIncident in 2010 and also worked as an Emergency Response Consultant with The Response Group for 1-1/2 years. He has beenan Asset Manager and Operations Manager for Deep Water Assets, Operations Director for Gulf of Mexico and the OrganizationalCapability Manager. Mr. Seilhan received a “Wells Notice,” dated January 25, 2013, from the Staff of the SEC indicating its intentto recommend to the SEC that it bring a civil injunctive action against Mr. Seilhan alleging that he violated Section 17(a) of the42
Securities Act, Section 10(b) of the Exchange Act and Rule 10b-5 thereunder. We have also been advised that Mr. Seilhan is atarget of an investigation by the Department of Justice (“DOJ”). The SEC’s inquiry and the DOJ’s investigation relate to activitiesprior to Mr. Seilhan’s employment with the Company and are not directed at, and do not concern, the Company or any othermember of management or any member of the board.Richard L. Toothman, Jr. was named Vice President – Appalachia in May 2010. Prior to joining <strong>Stone</strong> in May 2010, he wasemployed by CNX Gas Company in Bluefield, Virginia since August 2005 where he held two executive positions, VP Engineeringand Technical Services and VP International Business. He also worked for Consol <strong>Energy</strong> and Conoco in prior years.Paul K. Wieg was named Vice President – Exploration and Business Development on February 1, 2013. He previously servedas Director of Geosciences/Deepwater Exploration Manager of <strong>Stone</strong> from January <strong>2012</strong> through February 1, 2013. He served asDirector, Exploration and Geoscience Technology from January 2011 through January <strong>2012</strong> and Deepwater Exploration Managerfrom July 2010 through January 2011. Prior to joining <strong>Stone</strong> in 2010, Mr. Wieg was Deepwater Exploration Manager for EniPetroleum’s Gulf of Mexico business unit. He also served in various capacities for Dominion E&P, CNG, Shell Offshore, Inc.Pecten International and Exxon USA.Florence M. Ziegler was named Vice President – Human Resources and Administration in September 2005. She has beenemployed by <strong>Stone</strong> since its inception in 1993 and served as the Director of Human Resources from 1997 to 2004.Additional information required by Item 10, including information regarding our audit committee financial experts, isincorporated herein by reference to such information as set forth in our definitive Proxy Statement for our 2013 <strong>Annual</strong> Meeting ofStockholders to be held on May 23, 2013. The Company has made available free of charge on its Internet web-site(www.stoneenergy.com) the Code of Business Conduct and Ethics applicable to all employees of the Company including the ChiefExecutive Officer, Chief Financial Officer and Principal Accounting Officer.ITEM 11. EXECUTIVE COMPENSATIONThe information required by Item 11 is incorporated herein by reference to such information as set forth in our definitive ProxyStatement for our 2013 <strong>Annual</strong> Meeting of Stockholders to be held on May 23, 2013.ITEM 12. SECURITY OWNERSHIP OF CERTAIN BENEFICIAL OWNERS AND MANAGEMENT AND RELATEDSTOCKHOLDER MATTERSThe information required by Item 12 is incorporated herein by reference to such information as set forth in our definitive ProxyStatement for our 2013 <strong>Annual</strong> Meeting of Stockholders to be held on May 23, 2013.ITEM 13. CERTAIN RELATIONSHIPS AND RELATED TRANSACTIONS, AND DIRECTOR INDEPENDENCEThe information required by Item 13 is incorporated herein by reference to such information as set forth in our definitive ProxyStatement for our 2013 <strong>Annual</strong> Meeting of Stockholders to be held on May 23, 2013.ITEM 14. PRINCIPAL ACCOUNTING FEES AND SERVICESThe information required by Item 14 is incorporated herein by reference to such information as set forth in our definitive ProxyStatement for our 2013 <strong>Annual</strong> Meeting of Stockholders to be held on May 23, 2013.43
PART IVITEM 15. EXHIBITS, FINANCIAL STATEMENT SCHEDULES(a) 1. Financial Statements:The following Consolidated Financial Statements, notes to the Consolidated Financial Statements and the <strong>Report</strong> ofIndependent Registered Public Accounting Firm thereon are included beginning on page F-1 of this Form 10-K:<strong>Report</strong> of Independent Registered Public Accounting FirmConsolidated Balance Sheet as of December 31, <strong>2012</strong> and 2011Consolidated Statement of Operations for the three years in the period ended December 31, <strong>2012</strong>Consolidated Statement of Comprehensive Income for the three years in the period ended December 31, <strong>2012</strong>Consolidated Statement of Cash Flows for the three years in the period ended December 31, <strong>2012</strong>Consolidated Statement of Changes in Stockholders’ Equity for the three years in the period ended December 31, <strong>2012</strong>Notes to the Consolidated Financial Statements2. Financial Statement Schedules:All schedules are omitted because the required information is inapplicable or the information is presented in the ConsolidatedFinancial Statements or the notes thereto.3. Exhibits:3.1 Certificate of Incorporation of the Registrant, as amended on June 4, 1993, February 1, 2001 andFebruary 19, 2002 (incorporated by reference to Exhibit 3.1 to the Registrant's Quarterly <strong>Report</strong> onForm 10-Q filed August 7, <strong>2012</strong> (File No.001-12074)).3.2 Amended & Restated Bylaws of <strong>Stone</strong> <strong>Energy</strong> <strong>Corporation</strong>, dated May 15, 2008 (incorporated byreference to Exhibit 3.1 to the Registrant’s Current <strong>Report</strong> on Form 8-K filed May 21, 2008 (File No.001-12074)).4.1 Indenture between <strong>Stone</strong> <strong>Energy</strong> <strong>Corporation</strong> and JPMorgan Chase Bank, National Association, astrustee, dated December 15, 2004 (incorporated by reference to Exhibit 4.1 to the Registrant’s Current<strong>Report</strong> on Form 8-K filed December 17, 2004 (File No. 001-12074)).4.2 First Supplemental Indenture, dated August 28, 2008, to the Indenture between <strong>Stone</strong> <strong>Energy</strong><strong>Corporation</strong> and JPMorgan Chase Bank, National Association, as trustee, dated December 15, 2004(incorporated by reference to Exhibit 4.2 to the Registrant’s Current <strong>Report</strong> on Form 8-K filed August29, 2008 (File No. 001-12074)).4.3 Second Supplemental Indenture, dated January 26, 2010, among <strong>Stone</strong> <strong>Energy</strong> <strong>Corporation</strong>, <strong>Stone</strong><strong>Energy</strong> Offshore, L.L.C., and The Bank of New York Mellon Trust Company, N.A., successor toJPMorgan Chase Bank, as trustee (incorporated by reference to Exhibit 4.1 to the Registrant’s Current<strong>Report</strong> on Form 8-K filed January 29, 2010 (File No. 001-12074)).4.4 Indenture, dated January 26, 2010, among <strong>Stone</strong> <strong>Energy</strong> <strong>Corporation</strong>, <strong>Stone</strong> <strong>Energy</strong> Offshore, L.L.C.,and The Bank of New York Mellon Trust Company, N.A., as trustee (incorporated by reference toExhibit 4.2 to the Registrant’s Current <strong>Report</strong> on Form 8-K filed January 29, 2010 (File No. 001-12074)).4.5 First Supplemental Indenture, dated January 26, 2010, among <strong>Stone</strong> <strong>Energy</strong> <strong>Corporation</strong>, <strong>Stone</strong><strong>Energy</strong> Offshore, L.L.C., and The Bank of New York Mellon Trust Company, N.A., as trustee(incorporated by reference to Exhibit 4.3 to the Registrant’s Current <strong>Report</strong> on Form 8-K filed January29, 2010 (File No. 001-12074)).44
4.6 Indenture related to the 1¾% Senior Convertible Notes due 2017, dated as of March 6, <strong>2012</strong>, among<strong>Stone</strong> <strong>Energy</strong> <strong>Corporation</strong>, <strong>Stone</strong> <strong>Energy</strong> Offshore, L.L.C. and The Bank of New York Mellon TrustCompany, N.A., as trustee (including form of 1¾% Senior Convertible Senior Note due 2017)(incorporated by reference to Exhibit 4.1 to the Registrant’s Current <strong>Report</strong> on Form 8-K filed March 6,<strong>2012</strong> (File No. 001-12074)).4.7 Second Supplemental Indenture, dated as of November 6, <strong>2012</strong>, to the Indenture, dated as ofDecember 15, 2004, among <strong>Stone</strong> <strong>Energy</strong> <strong>Corporation</strong>, <strong>Stone</strong> <strong>Energy</strong> Offshore, L.L.C., and The Bank ofNew York Mellon Trust Company, N.A, as trustee (incorporated by reference to Exhibit 4.1 to theRegistrant’s Current <strong>Report</strong> on Form 8-K filed November 8, <strong>2012</strong> (File No. 001-12074)).4.8 Second Supplemental Indenture, dated as of November 8, <strong>2012</strong>, to the Indenture, dated as of January 26,2010, among <strong>Stone</strong> <strong>Energy</strong> <strong>Corporation</strong>, <strong>Stone</strong> <strong>Energy</strong> Offshore, L.L.C., and The Bank of New YorkMellon Trust Company, N.A., as trustee (incorporated by reference to Exhibit 4.2 to the Registrant’sCurrent <strong>Report</strong> on Form 8-K filed November 8, <strong>2012</strong> (File No. 001-12074)).†10.1 Deferred Compensation and Disability Agreement between TSPC and E. J. Louviere dated July 16,1981 (incorporated by reference to Exhibit 10.10 to the Registrant’s <strong>Annual</strong> <strong>Report</strong> on Form 10-K forthe year ended December 31, 1995 (File No. 001-12074)).†10.2 <strong>Stone</strong> <strong>Energy</strong> <strong>Corporation</strong> 2009 Amended and Restated Stock Incentive Plan (incorporated byreference to Appendix A to the Registrant’s Definitive Proxy Statement on Schedule 14A for <strong>Stone</strong>’s2009 <strong>Annual</strong> Meeting of Stockholders (File No. 001-12074)).†10.3 First Amendment to <strong>Stone</strong> <strong>Energy</strong> <strong>Corporation</strong> 2009 Amended and Restated Stock Incentive Plan(incorporated by reference to Exhibit 4.6 to the Registrant’s Quarterly <strong>Report</strong> on Form 10-Q for thequarter ended June 30, 2011 (File No. 001-12074)).†10.4 <strong>Stone</strong> <strong>Energy</strong> <strong>Corporation</strong> Revised (2005) <strong>Annual</strong> Incentive Compensation Plan (incorporated byreference to Exhibit 10.11 to the Registrant’s <strong>Annual</strong> <strong>Report</strong> on Form 10-K for the year endedDecember 31, 2004 (File No. 001-12074)).†10.5 <strong>Stone</strong> <strong>Energy</strong> <strong>Corporation</strong> Amended and Restated Revised <strong>Annual</strong> Incentive Compensation Plan,dated November 14, 2007 (incorporated by reference to Exhibit 10.10 to the Registrant’s <strong>Annual</strong><strong>Report</strong> on Form 10-K for the year ended December 31, 2007 (File No. 001-12074)).†10.6 <strong>Stone</strong> <strong>Energy</strong> <strong>Corporation</strong> Deferred Compensation Plan (incorporated by reference to Exhibit 4.5 tothe Registrant’s <strong>Annual</strong> <strong>Report</strong> on Form 10-K for the year ended December 31, 2004 (File No. 001-12074)).†10.7 Adoption Agreement between Fidelity Management Trust Company and <strong>Stone</strong> <strong>Energy</strong> <strong>Corporation</strong>for the <strong>Stone</strong> <strong>Energy</strong> <strong>Corporation</strong> Deferred Compensation Plan dated December 1, 2004 (incorporatedby reference to Exhibit 4.6 to the Registrant’s <strong>Annual</strong> <strong>Report</strong> on Form 10-K for the year endedDecember 31, 2004 (File No. 001-12074)).†10.8 Letter Agreement dated May 19, 2005 between <strong>Stone</strong> <strong>Energy</strong> <strong>Corporation</strong> and Kenneth H. Beer(incorporated by reference to Exhibit 10.1 to the Registrant’s Current <strong>Report</strong> on Form 8-K, filed May24, 2005 (File No. 001-12074)).†10.9 Letter Agreement dated December 2, 2008 between <strong>Stone</strong> <strong>Energy</strong> <strong>Corporation</strong> and David H. Welch(incorporated by reference to Exhibit 10.8 to the Registrant’s <strong>Annual</strong> <strong>Report</strong> on Form 10-K for theyear ended December 31, 2008 (File No. 001-12074)).†10.10 <strong>Stone</strong> <strong>Energy</strong> <strong>Corporation</strong> Executive Change of Control and Severance Plan (as amended and restatedeffective December 31, 2008) (incorporated by reference to Exhibit 10.1 to the Registrant’s Current<strong>Report</strong> on Form 8-K, filed April 8, 2009 (File No. 001-12074)).45
†10.11 <strong>Stone</strong> <strong>Energy</strong> <strong>Corporation</strong> Employee Change of Control Severance Plan (as amended and restated)dated December 7, 2007 (incorporated by reference to Exhibit 10.3 to the Registrant’s Current <strong>Report</strong>on Form 8-K, filed December 12, 2007 (File No. 001-12074)).10.12 Form of Indemnification Agreement between <strong>Stone</strong> <strong>Energy</strong> <strong>Corporation</strong> and each of its directors andexecutive officers (incorporated by reference to Exhibit 10.1 to the Registrant’s Current <strong>Report</strong> onForm 8-K, filed March 27, 2009 (File No. 001-12074)).10.13 $700,000,000 Third Amended and Restated Credit Agreement among <strong>Stone</strong> <strong>Energy</strong> <strong>Corporation</strong> asBorrower, Bank of America, N.A. as Administrative Agent and Issuing Bank, and the financialinstitutions named therein, dated April 26, 2011 (incorporated by reference to Exhibit 10.1 to theRegistrant’s Quarterly <strong>Report</strong> on Form 10-Q for the quarter ended March 31, 2011 (File No. 001-12074)).10.14 Amendment No. 1 and Consent dated as of February 28, <strong>2012</strong> to the Third Amended and RestatedCredit Agreement (incorporated by reference to Exhibit 10.1 to the Registrant’s Current <strong>Report</strong> onForm 8-K filed March 5, <strong>2012</strong> (File No. 001-12074)).10.15 Amendment No. 2 and Consent dated as of October 22, <strong>2012</strong> to the Third Amended and RestatedCredit Agreement (incorporated by reference to Exhibit 10.1 to the Registrant’s Current <strong>Report</strong> onForm 8-K filed October 22, <strong>2012</strong> (File No. 001-12074)).10.16 Amended and Restated Security Agreement, dated as of August 28, 2008, among <strong>Stone</strong> <strong>Energy</strong><strong>Corporation</strong> and the other Debtors parties hereto in favor of Bank of America, N.A., as AdministrativeAgent (incorporated by reference to Exhibit 4.5 to the Registrant’s Quarterly <strong>Report</strong> on Form 10-Q forthe quarter ended September 30, 2008 (File No. 001-12074)).10.17 Base Bond Hedge Confirmation dated as of February 29, <strong>2012</strong>, by and between <strong>Stone</strong> <strong>Energy</strong><strong>Corporation</strong> and Barclays Capital Inc., acting as agent for Barclays Bank PLC (incorporated by referenceto Exhibit 10.1 to the Registrant’s Current <strong>Report</strong> on Form 8-K filed March 6, <strong>2012</strong> (File No. 001-12074)).10.18 Base Bond Hedge Confirmation dated as of February 29, <strong>2012</strong>, by and between <strong>Stone</strong> <strong>Energy</strong><strong>Corporation</strong> and Bank of America N.A. (incorporated by reference to Exhibit 10.2 to the Registrant’sCurrent <strong>Report</strong> on Form 8-K filed March 6, <strong>2012</strong> (File No. 001-12074)).10.19 Additional Bond Hedge Confirmation dated as of March 2, <strong>2012</strong>, by and between <strong>Stone</strong> <strong>Energy</strong><strong>Corporation</strong> and Barclays Capital Inc., acting as agent for Barclays Bank PLC (incorporated by referenceto Exhibit 10.3 to the Registrant’s Current <strong>Report</strong> on Form 8-K filed March 6, <strong>2012</strong> (File No. 001-12074)).10.20 Additional Bond Hedge Confirmation dated as of March 2, <strong>2012</strong>, by and between <strong>Stone</strong> <strong>Energy</strong><strong>Corporation</strong> and Bank of America N.A. (incorporated by reference to Exhibit 10.4 to the Registrant’sCurrent <strong>Report</strong> on Form 8-K filed March 6, <strong>2012</strong> (File No. 001-12074)).10.21 Base Warrant Confirmation dated as of February 29, <strong>2012</strong>, by and between <strong>Stone</strong> <strong>Energy</strong> <strong>Corporation</strong>and Barclays Capital Inc., acting as agent for Barclays Bank PLC (incorporated by reference to Exhibit10.5 to the Registrant’s Current <strong>Report</strong> on Form 8-K filed March 6, <strong>2012</strong> (File No. 001-12074)).10.22 Base Warrant Confirmation dated as of February 29, <strong>2012</strong>, by and between <strong>Stone</strong> <strong>Energy</strong> <strong>Corporation</strong>and Bank of America N.A. (incorporated by reference to Exhibit 10.6 to the Registrant’s Current <strong>Report</strong>on Form 8-K filed March 6, <strong>2012</strong> (File No. 001-12074)).10.23 Additional Warrant Confirmation dated as of March 2, <strong>2012</strong>, by and between <strong>Stone</strong> <strong>Energy</strong> <strong>Corporation</strong>and Barclays Capital Inc., acting as agent for Barclays Bank PLC (incorporated by reference to Exhibit10.7 to the Registrant’s Current <strong>Report</strong> on Form 8-K filed March 6, <strong>2012</strong> (File No. 001-12074)).46
10.24 Additional Warrant Confirmation dated as of March 2, <strong>2012</strong>, by and between <strong>Stone</strong> <strong>Energy</strong> <strong>Corporation</strong>and Bank of America N.A. (incorporated by reference to Exhibit 10.8 to the Registrant’s Current <strong>Report</strong>on Form 8-K filed March 6, <strong>2012</strong> (File No. 001-12074)).10.25 Amendment to Base Warrant Confirmation and Additional Warrant Confirmation dated March 5, <strong>2012</strong>,by and between <strong>Stone</strong> <strong>Energy</strong> <strong>Corporation</strong> and Barclays Capital Inc., acting as agent for Barclays BankPLC (incorporated by reference to Exhibit 10.9 to the Registrant’s Current <strong>Report</strong> on Form 8-K filedMarch 6, <strong>2012</strong> (File No. 001-12074)).10.26 Amendment to Base Warrant Confirmation and Additional Warrant Confirmation dated March 5, <strong>2012</strong>,by and between <strong>Stone</strong> <strong>Energy</strong> <strong>Corporation</strong> and Bank of America N.A. (incorporated by reference toExhibit 10.10 to the Registrant’s Current <strong>Report</strong> on Form 8-K filed March 6, <strong>2012</strong> (File No. 001-12074)).*21.1 Subsidiaries of the Registrant.*23.1 Consent of Independent Registered Public Accounting Firm.*23.2 Consent of Netherland, Sewell & Associates, Inc.*31.1 Certification of Principal Executive Officer of <strong>Stone</strong> <strong>Energy</strong> <strong>Corporation</strong> as required by Rule 13a-14(a) of the Securities Exchange Act of 1934.*31.2 Certification of Principal Financial Officer of <strong>Stone</strong> <strong>Energy</strong> <strong>Corporation</strong> as required by Rule 13a-14(a)of the Securities Exchange Act of 1934.*#32.1 Certification of Chief Executive Officer and Chief Financial Officer of <strong>Stone</strong> <strong>Energy</strong> <strong>Corporation</strong>pursuant to 18 U.S.C. § 1350.**101.INS**101.SCH**101.CAL**101.DEF**101.LAB**101.PREXBRL Instance DocumentXBRL Schema DocumentXBRL Calculation Linkbase DocumentXBRL Definition Linkbase DocumentXBRL Label Linkbase DocumentXBRL Presentation Linkbase Document*99.1 <strong>Report</strong> of Netherland, Sewell & Associates, Inc.____________* Filed or furnished herewith.** Furnished, not filed. Users of this data submitted electronically herewith are advised pursuant to Rule 406T of RegulationS-T that this interactive data file is deemed not filed or part of a registration statement or prospectus for purposes ofSections 11 or 12 of the Securities Act of 1933, is deemed not filed for purposes of Section 18 of the Securities ExchangeAct of 1934, and otherwise is not subject to liability under these sections.# Not considered to be “filed” for the purposes of Section 18 of the Securities Exchange Act of 1934 or otherwise subject tothe liabilities of that section.† Identifies management contracts and compensatory plans or arrangements.47
SIGNATURESPursuant to the requirements of Section 13 or 15(d) of the Securities Exchange Act of 1934, the registrant has duly caused thisreport to be signed on its behalf by the undersigned, thereunto duly authorized.STONE ENERGY CORPORATIONDate: February 27, 2013By: /s/ David H. WelchDavid H. WelchPresident andChief Executive OfficerPursuant to the requirements of the Securities Exchange Act of 1934, this report has been signed below by the followingpersons on behalf of the registrant and in the capacities and on the dates indicated.Signature Title Date/s/ David H. Welch President, Chief Executive Officer February 27, 2013David H. Welchand Director(principal executive officer)/s/ Kenneth H. Beer Executive Vice President and February 27, 2013Kenneth H. BeerChief Financial Officer(principal financial officer)/s/ J. Kent Pierret Senior Vice President, Chief February 27, 2013J. Kent Pierret Accounting Officer and Treasurer(principal accounting officer)/s/ George R. Christmas Director February 27, 2013George R. Christmas/s/ B.J. Duplantis Director February 27, 2013B.J. Duplantis/s/ Peter D. Kinnear Director February 27, 2013Peter D. Kinnear/s/ John P. Laborde Director February 27, 2013John P. Laborde/s/ Robert S. Murley Director February 27, 2013Robert S. Murley/s/ Richard A. Pattarozzi Director February 27, 2013Richard A. Pattarozzi/s/ Donald E. Powell Director February 27, 2013Donald E. Powell/s/ Kay G. Priestly Director February 27, 2013Kay G. Priestly/s/ Phyllis M. Taylor Director February 27, 2013Phyllis M. Taylor48
INDEX TO FINANCIAL STATEMENTS<strong>Report</strong> of Independent Registered Public Accounting Firm .............................................................................. F-2Consolidated Balance Sheet as of December 31, <strong>2012</strong> and 2011 ...................................................................... F-3Consolidated Statement of Operations for the years ended December 31, <strong>2012</strong>, 2011 and 2010 ...................... F-4Consolidated Statement of Comprehensive Incomefor the years ended December 31, <strong>2012</strong>, 2011 and 2010 ............................................................................... F-5Consolidated Statement of Cash Flows for the years ended December 31, <strong>2012</strong>, 2011 and 2010 ..................... F-6Consolidated Statement of Changes in Stockholders’ Equityfor the years ended December 31, <strong>2012</strong>, 2011 and 2010 ............................................................................... F-7Notes to Consolidated Financial Statements ...................................................................................................... F-8F-1
REPORT OF INDEPENDENT REGISTERED PUBLIC ACCOUNTING FIRMThe Stockholders and Board of Directors<strong>Stone</strong> <strong>Energy</strong> <strong>Corporation</strong>We have audited the accompanying consolidated balance sheets of <strong>Stone</strong> <strong>Energy</strong> <strong>Corporation</strong> as of December 31, <strong>2012</strong> and 2011,and the related consolidated statements of operations, comprehensive income, cash flows, and changes in stockholders’ equity foreach of the three years in the period ended December 31, <strong>2012</strong>. These financial statements are the responsibility of the Company'smanagement. Our responsibility is to express an opinion on these financial statements based on our audits.We conducted our audits in accordance with the standards of the Public Company Accounting Oversight Board (United States).Those standards require that we plan and perform the audit to obtain reasonable assurance about whether the financial statementsare free of material misstatement. An audit includes examining, on a test basis, evidence supporting the amounts and disclosuresin the financial statements. An audit also includes assessing the accounting principles used and significant estimates made bymanagement, as well as evaluating the overall financial statement presentation. We believe that our audits provide a reasonablebasis for our opinion.In our opinion, the financial statements referred to above present fairly, in all material respects, the consolidated financial positionof <strong>Stone</strong> <strong>Energy</strong> <strong>Corporation</strong> as of December 31, <strong>2012</strong> and 2011, and the consolidated results of its operations and its cash flowsfor each of the three years in the period ended December 31, <strong>2012</strong>, in conformity with U.S. generally accepted accountingprinciples.We also have audited, in accordance with the standards of the Public Company Accounting Oversight Board (United States), <strong>Stone</strong><strong>Energy</strong> <strong>Corporation</strong>’s internal control over financial reporting as of December 31, <strong>2012</strong>, based on criteria established in InternalControl—Integrated Framework issued by the Committee of Sponsoring Organizations of the Treadway Commission and ourreport dated February 27, 2013 expressed an unqualified opinion thereon.New Orleans, LouisianaFebruary 27, 2013/s/ Ernst & Young LLPF-2
STONE ENERGY CORPORATIONCONSOLIDATED BALANCE SHEET(Amounts in thousands of dollars, except per share amounts)December 31,Assets <strong>2012</strong> 2011Current assets:Cash and cash equivalents .................................................................... $279,526 $38,451Accounts receivable ............................................................................. 167,288 118,139Fair value of hedging contracts ............................................................ 39,655 25,177Current income tax receivable ............................................................. 10,027 19,946Deferred taxes ...................................................................................... 15,514 26,072Inventory ............................................................................................. 4,207 4,643Other current assets .............................................................................. 3,626 791Total current assets ............................................................................ 519,843 233,219Oil and gas properties, full cost method of accounting:Proved ............................................................................................ 7,244,466 6,648,168Less: accumulated depreciation, depletion and amortization ......... (5,510,166) (5,174,729)Net proved oil and gas properties ................................................... 1,734,300 1,473,439Unevaluated .................................................................................... 447,795 401,609Other property and equipment, net of accumulated depreciation of$26,429 and $24,263, respectively .......................................... 22,115 11,172Fair value of hedging contracts ............................................................ 9,199 22,543Other assets, net of accumulated depreciation and amortizationof $6,438 and $5,911, respectively ......................................... 43,179 23,769Total assets ......................................................................................... $2,776,431 $2,165,751Liabilities and Stockholders’ EquityCurrent liabilities:Accounts payable to vendors ............................................................... $94,361 $102,946Undistributed oil and gas proceeds ...................................................... 23,414 27,328Accrued interest ................................................................................... 18,546 14,059Fair value of hedging contracts ............................................................ 149 11,122Asset retirement obligations ................................................................. 66,260 62,676Other current liabilities ........................................................................ 16,765 28,370Total current liabilities ...................................................................... 219,495 246,501Long-term debt .................................................................................... 914,126 620,000Deferred taxes ...................................................................................... 310,830 247,835Asset retirement obligations ................................................................. 422,042 363,103Fair value of hedging contracts ............................................................ 1,530 815Other long-term liabilities .................................................................... 36,275 19,668Total liabilities .................................................................................... 1,904,298 1,497,922Commitments and contingenciesStockholders’ equity:Common stock, $.01 par value; authorized 100,000,000 shares;issued 48,392,552 and 48,076,860 shares, respectively ................ 484 481Treasury stock (16,582 shares, at cost) ................................................ (860) (860)Additional paid-in capital ..................................................................... 1,386,475 1,338,565Accumulated deficit ............................................................................. (542,799) (692,225)Accumulated other comprehensive income ......................................... 28,833 21,868Total stockholders’ equity ................................................................. 872,133 667,829Total liabilities and stockholders’ equity ......................................... $2,776,431 $2,165,751The accompanying notes are an integral part of this balance sheet.F-3
STONE ENERGY CORPORATIONCONSOLIDATED STATEMENT OF OPERATIONS(Amounts in thousands, except per share amounts)Year Ended December 31,<strong>2012</strong> 2011 2010Operating revenue:Oil production ............................................................................... $761,304 $663,958 $417,948Gas production .............................................................................. 134,739 170,611 210,686Natural gas liquids production ...................................................... 48,498 29,996 27,473Other operational income .............................................................. 3,520 3,938 5,916Derivative income, net .................................................................. 3,428 1,418 3,265Total operating revenue ............................................................. 951,489 869,921 665,288Operating expenses:Lease operating expenses .............................................................. 215,003 175,881 150,212Transportation, processing and gathering expenses ...................... 21,782 8,958 7,218Production taxes............................................................................ 10,015 9,380 5,808Depreciation, depletion and amortization ..................................... 344,365 280,020 248,201Accretion expense ......................................................................... 33,331 30,764 34,469Salaries, general and administrative expenses .............................. 54,648 40,169 42,759Incentive compensation expense ................................................... 8,113 11,600 5,888Other operational expenses ........................................................... 267 2,149 5,579Total operating expenses ............................................................ 687,524 558,921 500,134Income from operations ............................................................. 263,965 311,000 165,154Other (income) expenses:Interest expense ............................................................................ 30,375 9,289 12,192Interest income ............................................................................. (600) (420) (1,464)Other income ................................................................................ (1,805) (1,942) (776)Other expense ............................................................................... - - 671Loss on early extinguishment of debt ........................................... 1,972 607 1,820Total other expenses ................................................................... 29,942 7,534 12,443Net income before income taxes ................................................. 234,023 303,466 152,711Provision (benefit) for income taxes:Current .......................................................................................... 15,022 (20,386) 5,808Deferred ........................................................................................ 69,575 129,520 50,474Total income taxes ...................................................................... 84,597 109,134 56,282Net income .................................................................................... $149,426 $194,332 $96,429Basic earnings per share ............................................................. $3.03 $3.97 $1.99Diluted earnings per share ......................................................... $3.03 $3.97 $1.99Average shares outstanding .......................................................... 48,319 47,988 47,681Average shares outstanding assuming dilution ............................. 48,361 48,030 47,706The accompanying notes are an integral part of this statementF-4
STONE ENERGY CORPORATIONCONSOLIDATED STATEMENT OF COMPREHENSIVE INCOME(Amounts in thousands of dollars)Year Ended December 31,<strong>2012</strong> 2011 2010Net income .................................................................................................. $149,426 $194,332 $96,429Other comprehensive income net of tax effect:Adjustment for fair value accounting of derivatives .................................... 6,965 36,072 1,176Comprehensive income ............................................................................. $156,391 $230,404 $97,605The accompanying notes are an integral part of this statement.F-5
STONE ENERGY CORPORATIONCONSOLIDATED STATEMENT OF CASH FLOWS(Amounts in thousands of dollars)Year Ended December 31,<strong>2012</strong> 2011 2010Cash flows from operating activities:Net income ................................................................................................ $149,426 $194,332 $96,429Adjustments to reconcile net income to net cash providedby operating activities:Depreciation, depletion and amortization ................................................. 344,365 280,020 248,201Accretion expense ..................................................................................... 33,331 30,764 34,469Deferred income tax provision .................................................................. 69,575 129,520 50,474Settlement of asset retirement obligations ................................................ (65,567) (63,391) (36,901)Non-cash stock compensation expense ..................................................... 8,699 5,905 5,692Excess tax benefits .................................................................................... (949) (1,493) (299)Non-cash derivative income ..................................................................... (509) (2,216) (324)Loss on early extinguishment of debt ....................................................... 1,972 607 1,820Non-cash interest expense......................................................................... 13,085 1,908 858Other non-cash (income) expense ............................................................. - (1,602) 979Change in current income taxes ................................................................ 10,618 (19,451) (10,871)(Increase) decrease in accounts receivable ................................................ (55,871) (19,600) 49,633(Increase) decrease in other current assets ................................................ (2,836) (66) 74Decrease in inventory ............................................................................... 436 1,619 2,123Increase (decrease) in accounts payable ................................................... 5,101 6,039 (773)Increase (decrease) in other current liabilities ........................................... (10,426) 29,583 (18,088)Other ......................................................................................................... 9,299 (1,628) 1,298Net cash provided by operating activities ............................................. 509,749 570,850 424,794Cash flows from investing activities:Investment in oil and gas properties ......................................................... (555,855) (764,933) (401,767)Proceeds from sale of oil and gas properties, net of expenses .................. 403 87,930 31,635Sale of fixed assets .................................................................................... 134 - -Investment in fixed and other assets ........................................................ (13,370) (2,247) (2,949)Acquisition of non-controlling interest in subsidiary ............................... - - (1,007)Net cash used in investing activities ....................................................... (568,688) (679,250) (374,088)Cash flows from financing activities:Proceeds from bank borrowings ............................................................... 25,000 75,000 -Repayments of bank borrowings ............................................................... (70,000) (30,000) (175,000)Proceeds from issuance of senior convertible notes .................................. 300,000 - -Deferred financing costs of senior convertible notes ................................ (8,855) - -Proceeds from sold warrants ..................................................................... 40,170 - -Payments for purchased call options ......................................................... (70,830) - -Proceeds from issuance of senior notes .................................................... 300,000 - 375,000Deferred financing costs ........................................................................... (11,966) (4,017) (11,474)Redemption of senior subordinated notes ................................................. (200,681) - (200,503)Excess tax benefits .................................................................................... 949 1,493 299Net payments for share based compensation ............................................ (3,773) (2,581) (1,365)Net cash provided by (used in) financing activities .............................. 300,014 39,895 (13,043)Net change in cash and cash equivalents ............................................... 241,075 (68,505) 37,663Cash and cash equivalents, beginning of year ...................................... 38,451 106,956 69,293Cash and cash equivalents, end of year ................................................. $279,526 $38,451 $106,956Supplemental cash flow information:Cash (paid) refunded during the year for:Interest, net of amount capitalized ............................................................ ($20,150) ($9,808) ($8,760)Income taxes ............................................................................................. (4,405) 935 (26,525)The accompanying notes are an integral part of this statement.F-6
STONE ENERGY CORPORATIONCONSOLIDATED STATEMENT OF CHANGES IN STOCKHOLDERS’ EQUITY(Amounts in thousands of dollars)CommonStockTreasuryStockAdditionalPaid-InCapitalRetainedEarningsAccumulatedOtherComprehensiveIncome (Loss)TotalStockholders’EquityBalance, December 31, 2009 ................. $475 ($860) $1,324,410 ($982,986) ($15,380) $325,659Net income .............................................. - - - 96,429 - 96,429Adjustment for fair value accountingof derivatives, net of tax ...................... - - - - 1,176 1,176Exercise of stock options and vestingof restricted stock ................................ 3 - (1,370) - - (1,367)Amortization of stock compensationexpense ................................................ - - 8,462 - - 8,462Net tax deficit from stock optionexercises and restricted stockvesting ................................................. - - (2) - - (2)Balance, December 31, 2010 ................. 478 (860) 1,331,500 (886,557) (14,204) 430,357Net income ............................................. - - - 194,332 - 194,332Adjustment for fair value accountingof derivatives, net of tax ...................... - - - - 36,072 36,072Exercise of stock options and vestingof restricted stock ................................ 3 - (2,584) - - (2,581)Amortization of stock compensationexpense ................................................ - - 8,914 - - 8,914Net tax benefit from stock optionexercises and restricted stockvesting ................................................. - - 735 - - 735Balance, December 31, 2011 ................. 481 (860) 1,338,565 (692,225) 21,868 667,829Net income ............................................. - - - 149,426 - 149,426Adjustment for fair value accountingof derivatives, net of tax ...................... - - - - 6,965 6,965Exercise of stock options and vestingof restricted stock ................................ 3 - (3,776) - - (3,773)Amortization of stock compensationexpense ................................................ - - 12,792 - - 12,792Net tax benefit from stock optionexercises and restricted stockvesting ................................................. - - 814 - - 814Convertible notes offering ....................... - - 38,080 - - 38,080Balance, December 31, <strong>2012</strong> ................. $484 ($860) $1,386,475 ($542,799) $28,833 $872,133The accompanying notes are an integral part of this statement.F-7
STONE ENERGY CORPORATIONNOTES TO CONSOLIDATED FINANCIAL STATEMENTS(Amounts in thousands of dollars, except per share and price amounts)NOTE 1 — ORGANIZATION AND SUMMARY OF SIGNIFICANT ACCOUNTING POLICIES:<strong>Stone</strong> <strong>Energy</strong> <strong>Corporation</strong> (“<strong>Stone</strong>”) is an independent oil and natural gas company engaged in the acquisition, exploration,exploitation, development and operation of oil and gas properties. We have been operating in the Gulf Coast Basin since ourincorporation in 1993 and have established a technical and operational expertise in this area. We have expanded our reserve baseoutside of the conventional shelf of the Gulf of Mexico (“GOM”) and into the more prolific reserve basins of the GOM deep waterand Gulf Coast deep gas, as well as onshore oil and gas shale opportunities, including the Marcellus Shale in Appalachia. Wewere incorporated in 1993 as a Delaware corporation. Our corporate headquarters are located at 625 E. Kaliste Saloom Road,Lafayette, Louisiana 70508. We have additional offices in New Orleans, Louisiana, Houston, Texas and Morgantown, WestVirginia.A summary of significant accounting policies followed in the preparation of the accompanying consolidated financialstatements is set forth below.Basis of Presentation:The financial statements include our accounts and the accounts of our wholly owned subsidiaries, <strong>Stone</strong> <strong>Energy</strong> Offshore,L.L.C. (“<strong>Stone</strong> Offshore”), <strong>Stone</strong> <strong>Energy</strong>, L.L.C. and Caillou Boca Gathering, LLC (“Caillou Boca”). On September 6, <strong>2012</strong>,Caillou Boca was merged into <strong>Stone</strong> Offshore. On December 31, 2010, <strong>Stone</strong> <strong>Energy</strong>, L.L.C. was merged into <strong>Stone</strong> Offshore.All intercompany balances have been eliminated. Certain prior year amounts have been reclassified to conform to current yearpresentation.Use of Estimates:The preparation of financial statements in conformity with U.S. Generally Accepted Accounting Principles (“GAAP”) requiresour management to make estimates and assumptions that affect the reported amounts of assets and liabilities, the disclosure ofcontingent assets and liabilities at the date of the financial statements and the reported amounts of revenues and expenses duringthe reporting period. Actual results could differ from those estimates. Estimates are used primarily when accounting fordepreciation, depletion and amortization (“DD&A”) expense, unevaluated property costs, estimated future net cash flows fromproved reserves, cost to abandon oil and gas properties, taxes, accruals of capitalized costs, operating costs and productionrevenue, capitalized general and administrative costs and interest, insurance recoveries, effectiveness and estimated fair value ofderivative positions, the purchase price allocation on properties acquired, estimates of fair value in business combinations andcontingencies.Fair Value Measurements:U.S. GAAP establishes a framework for measuring fair value and requires certain disclosures about fair value measurements.As of December 31, <strong>2012</strong> and 2011, we held certain financial assets and liabilities that are required to be measured at fair value ona recurring basis, including our commodity derivative instruments and our investments in marketable securities. Additionally, fairvalue concepts were applied in recording the acquisition of various deep water assets in December 2011 and June <strong>2012</strong> and theacquisition of an office building in December <strong>2012</strong>.Hybrid Debt Instruments:In <strong>2012</strong>, we issued $300,000 in aggregate principal amount of 1¾% Senior Convertible Notes due 2017 (the “2017 ConvertibleNotes”). See Note 11 – Long-Term Debt. On that same day we entered into convertible note hedging transactions which areexpected to reduce the potential dilution to our common stock upon conversion of the notes. In accordance with AccountingStandards Codification (“ASC”) 480-20 and ASC 470, we accounted for the debt and equity portions of the notes in a manner thatwill reflect our nonconvertible borrowing rate when interest is recognized in subsequent periods. This results in the separation ofthe debt component, classification of the remaining component in equity, and accretion of the resulting discount as part of interestexpense. Additionally, the hedging transactions meet the criteria for classification as equity transactions and were recorded assuch.F-8
ASC 260 provides that for contracts that may be settled in common stock or in cash at the election of the entity or the holder,the determination of whether the contract shall be reflected in the computation of diluted earnings per share should be made basedon the facts available each period. It is presumed that the contract will be settled in common stock and therefore potential dilutionbe determined using the if-converted method. However, this presumption may be overcome if past experience or a stated policyprovides a reasonable basis to believe that the contract will be settled partially or wholly in cash. Because it is management’sstated intent to redeem the principal amount of the notes in cash, we have used the treasury stock method for determining potentialdilution of the notes in our diluted earnings per share computation in accordance with ASC 260.Business Combinations:Our acquisitions in <strong>2012</strong> and 2011 of various deep water assets were accounted for according to the guidance provided in ASC805, Business Combinations, which requires application of the acquisition method. This methodology requires the recordation ofnet assets acquired and consideration transferred at fair value. Differences between the net fair value of assets acquired andconsideration transferred are recorded as goodwill or a bargain purchase gain.Cash and Cash Equivalents:We consider all money market funds and highly liquid investments in overnight securities through our commercial bankaccounts, which result in available funds on the next business day, to be cash and cash equivalents.Oil and Gas Properties:We follow the full cost method of accounting for oil and gas properties. Under this method, all acquisition, exploration,development and estimated abandonment costs, including certain related employee and general and administrative costs (less anyreimbursements for such costs) and interest incurred for the purpose of finding oil and gas are capitalized. Such amounts includethe cost of drilling and equipping productive wells, dry hole costs, lease acquisition costs, delay rentals and other costs related tosuch activities. Employee, general and administrative costs that are capitalized include salaries and all related fringe benefits paidto employees directly engaged in the acquisition, exploration and development of oil and gas properties, as well as all otherdirectly identifiable general and administrative costs associated with such activities, such as rentals, utilities and insurance. Wecapitalize a portion of the interest costs incurred on our debt based upon the balance of our unevaluated property costs and ourweighted-average borrowing rate. Employee, general and administrative costs associated with production operations and generalcorporate activities are expensed in the period incurred. Additionally, workover and maintenance costs incurred solely to maintainor increase levels of production from an existing completion interval are charged to lease operating expense in the period incurred.U.S. GAAP allows the option of two acceptable methods for accounting for oil and gas properties. The successful effortsmethod is the allowable alternative to the full cost method. The primary differences between the two methods are in the treatmentof exploration costs and in the computation of DD&A expense. Under the full cost method, all exploratory costs are capitalizedwhile under the successful efforts method exploratory costs associated with unsuccessful exploratory wells and all geological andgeophysical costs are expensed. Under the full cost method, DD&A expense is computed on cost centers represented by entirecountries while under the successful efforts method cost centers are represented by properties, or some reasonable aggregation ofproperties with common geological structural features or stratigraphic condition, such as fields or reservoirs.We amortize our investment in oil and gas properties through DD&A expense using the units of production (“UOP”) method.Under the UOP method, the quarterly provision for DD&A expense is computed by dividing production volumes for the period bythe total proved reserves as of the beginning of the period (beginning of the period reserves being determined by adding backproduction to end of the period reserves), and applying the respective rate to the net cost of proved oil and gas properties, includingfuture development costs.Under the full cost method, we compare, at the end of each financial reporting period, the present value of estimated future netcash flows from proved reserves (excluding cash flows related to estimated abandonment costs), to the net capitalized costs ofproved oil and gas properties net of related deferred taxes. We refer to this comparison as a “ceiling test.” If the net capitalizedcosts of proved oil and gas properties exceed the estimated discounted future net cash flows from proved reserves, we are requiredto write-down the value of our oil and gas properties to the value of the discounted cash flows.Sales of oil and gas properties are accounted for as adjustments to the net full cost pool with no gain or loss recognized, unlessthe adjustment would significantly alter the relationship between capitalized costs and proved reserves.F-9
Asset Retirement Obligations:U.S. GAAP requires us to record our estimate of the fair value of liabilities related to future asset retirement obligations in theperiod the obligation is incurred. Asset retirement obligations relate to the removal of facilities and tangible equipment at the end ofan oil and gas property’s useful life. The application of this rule requires the use of management’s estimates with respect to futureabandonment costs, inflation, market risk premiums, useful life and cost of capital. U.S. GAAP requires that our estimate of ourasset retirement obligations does not give consideration to the value the related assets could have to other parties.Other Property and Equipment:Our office buildings in Lafayette, Louisiana are being depreciated on the straight-line method over their estimated useful life of39 years.Inventory:We maintain an inventory of tubular goods. Items remain in inventory until dedicated to specific projects, at which time theyare transferred to oil and gas properties. Items are carried at the lower of cost or market.Earnings Per Common Share:Under U.S. GAAP, certain instruments granted in share based payment transactions are participating securities prior to vestingand are therefore required to be included in the earnings allocation in calculating earnings per share under the two-class method.Companies are required to treat unvested share based payment awards with a right to receive non-forfeitable dividends as aseparate class of securities in calculating earnings per share.Production Revenue:We recognize production revenue under the entitlement method of accounting. Under this method, revenue is deferred fordeliveries in excess of our net revenue interest, while revenue is accrued for undelivered volumes. Production imbalances aregenerally recorded at the estimated sales price in effect at the time of production.Income Taxes:Provisions for income taxes include deferred taxes resulting primarily from temporary differences due to different reportingmethods for oil and gas properties for financial reporting purposes and income tax purposes. For financial reporting purposes, allexploratory and development expenditures, including future abandonment costs, related to evaluated projects are capitalized anddepreciated, depleted and amortized on the UOP method. For income tax purposes, only the equipment and leasehold costsrelative to successful wells are capitalized and recovered through depreciation or depletion, although for 2011 and <strong>2012</strong>, specialprovisions allowed for current deductions for the cost of certain equipment. Generally, most other exploratory and developmentcosts are charged to expense as incurred; however, we follow certain provisions of the Internal Revenue Code that allowcapitalization of intangible drilling costs where management deems appropriate. Other financial and income tax reportingdifferences occur as a result of statutory depletion, different reporting methods for sales of oil and gas reserves in place, differentreporting methods used in the capitalization of employee, general and administrative and interest expense, and different reportingmethods for employee compensation.Derivative Instruments and Hedging Activities:The nature of a derivative instrument must be evaluated to determine if it qualifies for hedge accounting treatment. Instrumentsthat qualify for cash flow hedge accounting treatment with contemporaneous documentation are recorded as an asset or liabilitymeasured at fair value and subsequent changes in fair value are recognized in equity through other comprehensive income (loss),net of related taxes, to the extent the hedge is considered effective. Additionally, monthly settlements of effective hedges arereflected in revenue from oil and gas production and cash flow from operating activities. Instruments not qualifying for hedgeaccounting treatment are recorded in the balance sheet at fair value and changes in fair value are recognized in earnings throughderivative expense (income).F-10
Stock-Based Compensation:We record stock-based compensation based on the grant date fair value of issued stock options and restricted stock over thevesting period of the instrument. We utilize the Black-Scholes option pricing model to measure the fair value of stock options.The fair value of restricted shares is typically determined based on the average of our high and low stock prices on the grant date.NOTE 2 — EARNINGS PER SHARE:The following table sets forth the calculation of basic and diluted weighted average shares outstanding and earnings per sharefor the indicated periods.Year Ended December 31,<strong>2012</strong> 2011 2010Income (numerator):Basic:Net income ..................................................................................... $149,426 $194,332 $96,429Net income attributable to participating securities ......................... (2,984) (3,670) (1,559)Net income attributable to common stock – basic .......................... $146,442 $190,662 $94,870Diluted:Net income ..................................................................................... $149,426 $194,332 $96,429Net income attributable to participating securities ......................... (2,982) (3,667) (1,558)Net income attributable to common stock – diluted ....................... $146,444 $190,665 $94,871Weighted average shares (denominator):Weighted average shares – basic .................................................... 48,319 47,988 47,681Diluted effect of stock options........................................................ 42 42 25Weighted average shares - diluted .................................................. 48,361 48,030 47,706Basic income per common share ................................................. $3.03 $3.97 $1.99Diluted income per common share .............................................. $3.03 $3.97 $1.99Stock options that were considered antidilutive because the exercise price of the options exceeded the average price of ourcommon stock for the applicable period totaled approximately 347,000, 374,000 and 420,000 shares during the years endedDecember 31, <strong>2012</strong>, 2011 and 2010, respectively.During the years ended December 31, <strong>2012</strong>, 2011 and 2010, approximately 316,000, 312,000 and 255,000 shares of commonstock, respectively, were issued from authorized shares upon the vesting (lapse of forfeiture restrictions) of restricted stock byemployees and nonemployee directors.Because it is management’s stated intention to redeem the principal amount of our 2017 Convertible Notes (see Note 11 –Long-Term Debt) in cash, we have used the treasury method for determining potential dilution in the diluted earnings per sharecomputation. Since the average price of our common stock was less than the effective conversion price for such notes during thereporting period, the 2017 Convertible Notes were not dilutive for such period. Additionally, since the average price of ourcommon stock was less than the strike price of the Sold Warrants (as defined in Note 11 – Long-Term Debt) for the reportingperiod, such warrants were also not dilutive for such period.F-11
NOTE 3 — ACCOUNTS RECEIVABLE:In our capacity as operator for our co-venturers, we incur drilling and other costs that we bill to the respective parties based ontheir working interests. We also receive payments for these billings and, in some cases, for billings in advance of incurring costs.Our accounts receivable are comprised of the following amounts:As of December 31,<strong>2012</strong> 2011Other co-venturers ....................................................... $16,735 $8,890Trade ........................................................................... 130,448 91,959Insurance receivable ................................................... - 4,236Unbilled accounts receivable ...................................... 20,053 13,009Other .......................................................................... 52 45$167,288 $118,139We have accrued insurance receivables to the extent we have concluded the insurance recovery is probable. The accrual onlyrelates to costs previously recorded in our financial statements, including asset retirement obligations and repair expenses includedin lease operating expenses.NOTE 4 — CONCENTRATIONS:Sales to Major CustomersOur production is sold on month-to-month contracts at prevailing prices. We obtain credit protections such as parentalguarantees from certain of our purchasers. The following table identifies customers from whom we derived 10% or more of ourtotal oil and gas revenue during the years ended:December 31,<strong>2012</strong> 2011 2010Conoco, Inc. .................................................... 13% 28% 26%Hess <strong>Corporation</strong> ............................................ (a) (a) 11%Phillips 66 Company ....................................... 18% (a) (a)Sequent <strong>Energy</strong> Management LP .................... (a) (a) 10%Shell Trading (US) Company ......................... 41% 46% 40%(a)Less than 10 percent.The maximum amount of credit risk exposure at December 31, <strong>2012</strong> relating to these customers amounted to $83,432.We believe that the loss of any of these purchasers would not result in a material adverse effect on our ability to market futureoil and gas production.Production and Reserve VolumesApproximately18% of our estimated proved reserves (unaudited) at December 31, <strong>2012</strong> and 56% of our production during<strong>2012</strong> were associated with our Gulf Coast Basin conventional shelf properties. Approximately 38% of our estimated provedreserves (unaudited) at December 31, <strong>2012</strong> and 27% of our production during <strong>2012</strong> were associated with our GOM deep water anddeep shelf gas properties.Cash and Cash EquivalentsA substantial portion of our cash balances are not federally insured.F-12
NOTE 5ACQUISITIONS AND DIVESTITURES:AcquisitionsIn December <strong>2012</strong>, we closed on the acquisition of an office building. The acquisition was accounted for according to theguidance provided in ASC 805, Business Combinations, which requires application of the acquisition method. This methodologyrequires the recordation of net assets acquired and consideration transferred at fair value. See Note 8 – Fair ValueMeasurements. Differences between the net fair value of assets acquired and consideration transferred are recorded as goodwillor a bargain purchase gain. The building and land were recorded at fair value of $8,539. Consideration transferred in thetransaction was $8,539 in cash, resulting in no goodwill or bargain purchase gain.On June 18, <strong>2012</strong>, we completed the acquisition of a 25% working interest in the five block deep water Pompano field inMississippi Canyon, an approximate 14% working interest in Mississippi Canyon Block 29 and a 10% working interest in certainaliquots of Mississippi Canyon Block 72. The acquisition was also accounted for according to the guidance provided in ASC 805,Business Combinations. Consideration transferred in the transaction was $26,398 in cash, resulting in no goodwill or bargainpurchase gain. The following represents the allocation of the recorded value of net assets acquired in the transaction.Proved oil and gas properties. ......................... $39,221Unevaluated oil and gas properties. ................ 1,637Asset retirement obligations. ........................... (14,460)Total fair value of net assets. .......................... $26,398On December 28, 2011, we completed the acquisition of BP Exploration & Production Inc.’s (“BP”) 75% operated workinginterest in the five block deep water Pompano field in Mississippi Canyon, a 51% operated working interest in the adjacentMississippi Canyon Block 29, a 50% non-operated working interest in the Mica field, which ties back to the Pompano platformand a 75% interest in 23 deep water exploration leases located in the vicinity of the Pompano field. The acquisition was alsoaccounted for according to the guidance provided in ASC 805, Business Combinations. Consideration transferred in thetransaction was $167,631 in cash, resulting in no goodwill or bargain purchase gain. The following represents the allocation of therecorded value of net assets acquired in the transaction.Proved oil and gas properties. ......................... $208,680Unevaluated oil and gas properties. ................ 17,314Asset retirement obligations. ........................... (58,363)Total fair value of net assets. .......................... $167,631The following unaudited summary pro forma combined statement of operations data of <strong>Stone</strong> for the year ended December 31,2011 has been prepared to give effect to the acquisition of the deep water assets from BP as if it had occurred on January 1, 2010.The pro forma financial information is not necessarily indicative of the results that might have occurred had the transaction takenplace on January 1, 2010 and is not intended to be a projection of future results. Future results may vary significantly from theresults reflected in the following pro forma financial information because of normal production declines, changes in commodityprices, future acquisitions and divestitures, future development and exploration activities and other factors.Year EndedDecember 31, 2011(Unaudited)Revenues ....................................... $1,007,376Income from operations ............... 392,054Net income ................................... 242,118Basic earnings per share ................ $4.95Diluted earnings per share ............. $4.95In January 2011, we completed the acquisition of an additional 15% working interest in the Pyrenees project at a cost ofapproximately $14,974, bringing our ownership up to a 30% working interest. In December 2011, we completed the acquisition ofa 25% non-operated working interest in the deep water Wideberth development project at a cost of approximately $31,000 and theassumption of approximately $1,078 of asset retirement obligations. During the second half of 2011, we added approximately10,000 net acres to our West Virginia leasehold position, including the acquisition of over 6,700 net acres from a single entity at acost of approximately $19,000.F-13
DivestituresIn the fourth quarter of 2011, we completed the sale of our non-operated interest in the Main Pass Block 296 and 311 fields totwo separate parties for total cash consideration of approximately $80,381 and the assumption by the third parties of the associatedasset retirement obligation of approximately $10,900. The sale was accounted for as an adjustment to the full cost pool with nogain or loss recognized.NOTE 6 — INVESTMENT IN OIL AND GAS PROPERTIES:The following table discloses certain financial data relative to our oil and gas producing activities located onshore and offshorein the continental United States:Year Ended December 31,<strong>2012</strong> 2011 2010Oil and gas properties, proved and unevaluated:Balance, beginning of year ................................................................. $7,049,777 $6,202,758 $5,741,081Costs incurred during the year (capitalized):Acquisition costs, net of sales of unevaluated properties ............... 102,807 270,354 127,069Exploratory costs ........................................................................... 81,458 84,199 42,205Development costs (1) ................................................................... 395,555 426,355 241,387Salaries, general and administrative costs ...................................... 25,318 24,430 20,521Interest ........................................................................................... 37,656 42,033 30,783Less: overhead reimbursements .................................................... (310) (352) (288)Total costs incurred during the year, net of divestitures ..................... 642,484 847,019 461,677Balance, end of year ............................................................................ $7,692,261 $7,049,777 $6,202,758Accumulated depreciation, depletion and amortization (DD&A):Balance, beginning of year ............................................................ ($5,174,729) ($4,804,949) ($4,555,372)Provision for DD&A ...................................................................... (341,096) (276,480) (242,745)Sale of proved properties ............................................................... 5,659 (93,300) (6,832)Balance, end of year ............................................................................ ($5,510,166) ($5,174,729) ($4,804,949)Net capitalized costs, proved and unevaluated.................................... $2,182,095 $1,875,048 $1,397,809DD&A per Mcfe ................................................................................. $3.69 $3.45 $3.08(1) Includes capitalized asset retirement costs of $95,293, $96,386 and $56,444, respectively.Costs incurred during the year (expensed):Lease operating expenses ............................................................... $215,003 $175,881 $150,212Transportation, processing and gathering expenses ....................... 21,782 8,958 7,218Production taxes ............................................................................. 10,015 9,380 5,808Accretion expense .......................................................................... 33,331 30,764 34,469Expensed costs .................................................................................... $280,131 $224,983 $197,707The following table discloses net costs incurred (evaluated) on our unevaluated properties:Year Ended December 31,Unevaluated oil and gas properties: <strong>2012</strong> 2011 2010Net costs incurred (evaluated) during year:Acquisition costs .................................................... $9,739 ($2,397) $42,664Exploration costs .................................................... (1,209) (51,207) 10,491Capitalized interest ................................................. 37,656 42,033 30,783$46,186 ($11,571) $83,938F-14
The following table discloses financial data associated with unevaluated costs at December 31, <strong>2012</strong>:Balance as ofDecember 31,<strong>2012</strong>Net Costs Incurred During theYear Ended December 31,<strong>2012</strong> 2011 20102009and priorAcquisition costs .............. $258,580 $43,544 $39,984 $104,154 $70,898Exploration costs .............. 108,248 81,246 2,335 5,151 19,516Capitalized interest ........... 80,967 30,989 27,818 13,762 8,398Total unevaluated costs .... $447,795 $155,779 $70,137 $123,067 $98,812Approximately 124 specifically identified drilling projects are included in unevaluated costs at December 31, <strong>2012</strong> and areexpected to be evaluated in the next four years. The excluded costs will be included in the amortization base as the properties areevaluated and proved reserves are established or impairment is determined. Interest costs capitalized on unevaluated propertiesduring the years ended December 31, <strong>2012</strong>, 2011 and 2010 totaled $37,656, $42,033 and $30,783, respectively.NOTE 7 — DERIVATIVE INSTRUMENTS AND HEDGING ACTIVITIES:Our hedging strategy is designed to protect our near and intermediate term cash flow from future declines in oil and natural gasprices. This protection is essential to capital budget planning, which is sensitive to expenditures that must be committed to inadvance such as rig contracts and the purchase of tubular goods. We enter into hedging transactions to secure a commodity pricefor a portion of future production that is acceptable at the time of the transaction. These hedges are designated as cash flow hedgesupon entering into the contract. We do not enter into hedging transactions for trading purposes. We have no fair value hedges.The nature of a derivative instrument must be evaluated to determine if it qualifies for hedge accounting treatment. If theinstrument qualifies for hedge accounting treatment, it is recorded as either an asset or liability measured at fair value andsubsequent changes in the derivative’s fair value are recognized in equity through other comprehensive income (loss), net ofrelated taxes, to the extent the hedge is considered effective. Additionally, monthly settlements of effective hedges are reflected inrevenue from oil and gas production and cash flows from operations. Instruments not qualifying for hedge accounting arerecorded in the balance sheet at fair value and changes in fair value are recognized in earnings through derivative expense(income). Typically, a small portion of our derivative contracts are determined to be ineffective. This is because oil and naturalgas price changes in the markets in which we sell our products are not 100% correlative to changes in the underlying price basisindicative in the derivative contract. Monthly settlements of ineffective hedges are recognized in earnings through derivativeexpense (income) and cash flows from operations.We have entered into fixed-price swaps with various counterparties for a portion of our expected 2013, 2014 and 2015 oil andnatural gas production from the Gulf Coast Basin. Some of our fixed-price oil swap settlements are based on an average of theNew York Mercantile Exchange (“NYMEX”) closing price for West Texas Intermediate during the entire calendar month, andsome are based on the average of the Intercontinental Exchange closing price for Brent crude oil during the entire calendar month.Our fixed-price gas swap settlements are based on the NYMEX price for the last day of a respective contract month. Swapstypically provide for monthly payments by us if prices rise above the swap price or to us if prices fall below the swap price. Ourfixed-price swap contracts are with The Toronto-Dominion Bank, Barclays Bank PLC, BNP Paribas, The Bank of Nova Scotia,Bank of America and Natixis.All of our derivative instruments at December 31, <strong>2012</strong>, 2011 and 2010 were designated as effective cash flow hedges;however, during the years ended December 31, <strong>2012</strong>, 2011 and 2010, certain of our derivative contracts were determined to bepartially ineffective. The following tables disclose the location and fair value amounts of derivative instruments reported in ourbalance sheet at December 31, <strong>2012</strong> and December 31, 2011.F-15
Fair Value of Derivative Instruments at December 31, <strong>2012</strong>Asset DerivativesLiability DerivativesDescription Balance Sheet Location Fair Value Balance Sheet Location Fair ValueCommodity contractsCurrent assets: Fair value ofhedging contracts $39,655Current liabilities: Fairvalue of hedging contracts ($149)Long-term assets: Fairvalue of hedging contracts 9,199Long-term liabilities: Fairvalue of hedging contracts (1,530)$48,854 ($1,679)Fair Value of Derivative Instruments at December 31, 2011Asset DerivativesLiability DerivativesDescription Balance Sheet Location Fair Value Balance Sheet Location Fair ValueCommodity contractsCurrent assets: Fair value ofhedging contracts $25,177Current liabilities: Fairvalue of hedging contracts ($11,122)Long-term assets: Fairvalue of hedging contracts 22,543Long-term liabilities: Fairvalue of hedging contracts (815)$47,720 ($11,937)The following table discloses the effect of derivative instruments in the statement of operations for the years ended December31, <strong>2012</strong>, 2011 and 2010.The Effect of Derivative Instruments on the Statement of Operations for the Years Ended December 31, <strong>2012</strong>, 2011 and 2010Amount of GainDerivatives in CashFlow HedgingRelationshipsRecognized inOCI onDerivative (a)Gain (Loss) Reclassified fromAccumulated OCI into Income(Effective Portion) (b)Gain Recognized in Income on Derivative(Ineffective Portion)LocationLocation<strong>2012</strong> <strong>2012</strong> <strong>2012</strong>Commodity contracts $6,965Operating revenue -oil/gas production $30,326 Derivative income, net $3,428Total $6,965 $30,326 $3,4282011 2011 2011Commodity contracts $36,072Operating revenue -oil/gas production ($13,274) Derivative income, net $1,418Total $36,072 ($13,274) $1,4182010 2010 2010Commodity contracts $1,176Operating revenue -oil/gas production $9,631 Derivative income, net $3,265Total $1,176 $9,631 $3,265(a) Net of related tax effect of $3,918, $20,290 and $292 for the years ended December 31, <strong>2012</strong>, 2011 and 2010, respectively.(b) For the year ended December 31, <strong>2012</strong>, effective hedging contracts increased oil revenue by $8,546 and increased gas revenue by$21,780. For the year ended December 31, 2011, effective hedging contracts decreased oil revenue by $32,706 and increased gasrevenue by $19,432. For the year ended December 31, 2010, effective hedging contracts decreased oil revenue by $29,047 andincreased gas revenue by $38,678.At December 31, <strong>2012</strong>, we had accumulated other comprehensive income of $28,833 net of tax, which related to the fair valueof our swap contracts that were outstanding as of December 31, <strong>2012</strong>. We believe that approximately $24,033 of the accumulatedother comprehensive income will be reclassified into earnings in the next 12 months.F-16
The following table illustrates our hedging positions for calendar years 2013, 2014 and 2015 as of February 21, 2013:Fixed-Price SwapsNYMEX (except where noted)Natural GasOilDaily Volume(MMBtus/d)SwapPrice ($)Daily Volume(Bbls/d)SwapPrice ($)2013 ............. 10,000 4.000 1,000 92.802013 ............. 10,000 5.270 2,000* 94.052013 ............. 10,000 5.320 1,000 94.452013 ............. 1,000 94.602013 ............. 1,000 97.152013 ............. 1,000 101.532013 ............. 1,000 103.002013 ............. 1,000 103.152013 ............. 1,000 104.252013 ............. 1,000 104.472013 ............. 1,000 104.502013 ............. 1,000 † 107.302014 ............. 10,000 4.000 1,000 90.062014 ............. 10,000 4.040 1,000 93.552014 ............. 10,000 4.105 1,000 94.002014 ............. 10,000 4.250 1,000 98.002014 ............. 1,000 98.302014 ............. 1,000 99.652014 ............. 1,000 † 103.302015 ............. 10,000 4.005 1,000 90.002015 ............. 10,000 4.2202015 ............. 10,000 4.255† Brent oil contract* January through JuneNOTE 8 – FAIR VALUE MEASUREMENTS:U.S. GAAP establishes a fair value hierarchy that has three levels based on the reliability of the inputs used to determine thefair value. These levels include: Level 1, defined as inputs such as unadjusted quoted prices in active markets for identical assetsor liabilities; Level 2, defined as inputs other than quoted prices in active markets that are either directly or indirectly observable;and Level 3, defined as unobservable inputs for use when little or no market data exists, therefore requiring an entity to develop itsown assumptions.As of December 31, <strong>2012</strong> and December 31, 2011, we held certain financial assets and liabilities that are required to bemeasured at fair value on a recurring basis, including our commodity derivative instruments and our investments in marketablesecurities. We utilize the services of an independent third party to assist us in valuing our derivative instruments. We used theincome approach in determining the fair value of our derivative instruments utilizing a proprietary pricing model. The modelaccounts for our credit risk and the credit risk of our counterparties in the discount rate applied to estimated future cash inflowsand outflows. Our swap contracts are included within the Level 2 fair value hierarchy. For a more detailed description of ourderivative instruments, see Note 7 - Derivative Instruments and Hedging Activities. We used the market approach indetermining the fair value of our investments in marketable securities, which are included within the Level 1 fair value hierarchy.F-17
The following tables present our assets and liabilities that are measured at fair value on a recurring basis at December 31, <strong>2012</strong>:Fair Value Measurements at December 31, <strong>2012</strong>Quoted Prices in Significant OtherActive Markets for ObservableIdentical AssetsInputs(Level 1)(Level 2)SignificantUnobservableInputs(Level 3)AssetsTotalMarketable securities .................. $13,492 $13,492 $ - $ -Hedging contracts ....................... 48,854 - 48,854 -Total ....................................... $62,346 $13,492 $48,854 $ -Fair Value Measurements at December 31, <strong>2012</strong>Quoted Prices in Significant OtherActive Markets for ObservableIdentical LiabilitiesInputs(Level 1)(Level 2)SignificantUnobservableInputs(Level 3)LiabilitiesTotalHedging contracts ....................... ($1,679) $ - ($1,679) $ -Total ....................................... ($1,679) $ - ($1,679) $ -The following tables present our assets and liabilities that are measured at fair value on a recurring basis at December 31, 2011:Fair Value Measurements at December 31, 2011Quoted Prices in Significant OtherActive Markets for ObservableIdentical AssetsInputs(Level 1)(Level 2)SignificantUnobservableInputs(Level 3)AssetsTotalMarketable securities .................. $11,961 $11,961 $ - $ -Hedging contracts ....................... 47,720 - 47,720 -Total ....................................... $59,681 $11,961 $47,720 $ -Fair Value Measurements at December 31, 2011Quoted Prices in Significant OtherActive Markets for ObservableIdentical LiabilitiesInputs(Level 1)(Level 2)SignificantUnobservableInputs(Level 3)LiabilitiesTotalHedging contracts ....................... ($11,937) $ - ($11,937) $ -Total ....................................... ($11,937) $ - ($11,937) $ -The fair value of cash and cash equivalents and our variable-rate bank debt approximated book value at December 31, <strong>2012</strong>and 2011. As of December 31, <strong>2012</strong> and 2011, the fair value of our 8⅝% Senior Notes due 2017 (the “2017 Notes”) wasapproximately $401,250 and $386,250, respectively. As of December 31, 2011, the fair value of our 6¾% Senior SubordinatedNotes due 2014 (the “2014 Notes”) was approximately $199,000. On December 17, <strong>2012</strong>, our 2014 Notes were fully redeemed.As of December 31, <strong>2012</strong>, the fair value of the liability component of our 2017 Convertible Notes was approximately $249,601.As of December 31, <strong>2012</strong>, the fair value of our 7½% Senior Notes due 2022 (the “2022 Notes”) was approximately $314,250. Thefair value of our outstanding notes was determined based upon quotes obtained from brokers, which represent Level 2 inputs.We applied fair value concepts in determining the liability component of our 2017 Convertible Notes (see Note 11 – Long-Term Debt) at inception and at December 31, <strong>2012</strong>. The fair value of the liability was estimated using an income approach. Thesignificant inputs in these determinations were market interest rates based on quotes obtained from brokers and represent Level 2inputs.We applied fair value concepts in the recording of various deep water assets acquired in 2011 and <strong>2012</strong>. See Note 5 –Acquisitions and Divestitures. The fair value of proved and unevaluated oil and gas properties was estimated using a marketapproach. Significant inputs were market value comparisons for similar transactions within a one-year period. These inputs wereconsidered Level 3 inputs. Asset retirement obligations were determined in accordance with applicable accounting standards.We applied fair value concepts in recording the acquisition of an office building in <strong>2012</strong>. See Note 5 – Acquisitions andDivestitures. The fair value of the building was estimated using an income approach. Significant inputs used in this approachwere anticipated future earnings (Level 2) and an expected rate of return (Level 3).F-18
NOTE 9 — ASSET RETIREMENT OBLIGATIONS:The change in our asset retirement obligations during <strong>2012</strong>, 2011 and 2010 is set forth below:Year Ended December 31,<strong>2012</strong> 2011 2010Asset retirement obligations as of the beginning of the year,including current portion ....................................................... $425,779 $373,920 $320,599Liabilities incurred ....................................................................... 3,869 7,993 1,528Liabilities settled .......................................................................... (67,641) (63,226) (36,392)Liabilities assumed ....................................................................... 15,263 59,441 -Divestment of properties .............................................................. (7,563) (10,900) (692)Accretion expense ........................................................................ 33,331 30,764 34,469Revision of estimates ................................................................... 85,264 27,787 54,408Asset retirement obligations as of the end of the year, includingcurrent portion ....................................................................... $488,302 $425,779 $373,920NOTE 10 — INCOME TAXES:An analysis of our deferred taxes follows:As of December 31,<strong>2012</strong> 2011Tax effect of temporary differences:Oil and gas properties – full cost.................................. ($465,862) ($381,413)Asset retirement obligations ......................................... 175,788 153,281Stock compensation ..................................................... 5,588 4,962Hedges ......................................................................... (16,983) (12,882)Alternative minimum tax credit carryforward ............. - 5,358Other ............................................................................ 6,153 8,931($295,316) ($221,763)We estimate that we have approximately $15,022, ($20,386) and $5,808 of current federal income tax expense (benefit) for theyears ended December 31, <strong>2012</strong>, 2011 and 2010, respectively. We have a $10,027 and $19,946 current income tax receivable atDecember 31, <strong>2012</strong> and 2011, respectively.A reconciliation between the statutory federal income tax rate and our effective income tax rate as a percentage of incomebefore income taxes follows:Year Ended December 31,<strong>2012</strong> 2011 2010Income tax expense computed at the statutoryfederal income tax rate ......................................................... 35.0% 35.0% 35.0%State taxes ...................................................................................... 1.0 1.0 1.0IRC Sec. 162(m) limitation ............................................................ 0.6 0.3 -Other ........................................................................................... (0.5) (0.3) 0.9Effective income tax rate ............................................................... 36.1% 36.0% 36.9%In <strong>2012</strong> and 2010, we recognized a tax deduction for domestic production activities pursuant to Internal Revenue Code Section199.Income taxes allocated to accumulated other comprehensive income related to oil and gas hedges amounted to $3,918, $20,290and $292 for the years ended December 31, <strong>2012</strong>, 2011 and 2010, respectively.F-19
As of December 31, <strong>2012</strong> and 2011, we had unrecognized tax benefits of $385. If recognized, all of our unrecognized taxbenefits as of December 31, <strong>2012</strong> would impact our effective tax rate. A reconciliation of the total amounts of unrecognized taxbenefits follows:Total unrecognized tax benefits as of December 31, 2011 ..................... $385Increases (decreases) in unrecognized tax benefits as a result of: -Tax positions taken during a prior period ..................................... -Tax positions taken during the current period .............................. -Settlements with taxing authorities ............................................... -Lapse of applicable statute of limitations ..................................... -Total unrecognized tax benefits as of December 31, <strong>2012</strong> ..................... $385Our unrecognized tax benefits pertain to proposed state income tax audit adjustments. We believe that our unrecognized taxbenefits may be reduced to zero within the next 12 months upon completion and ultimate settlement of the state exams orlitigation.It is our policy to classify interest and penalties associated with underpayment of income taxes as interest expense and generaland administrative expenses, respectively. We have recognized $27, $25 and ($1,157) of interest expense related to uncertain taxpositions for the years ended December 31, <strong>2012</strong>, 2011 and 2010, respectively. We have not recognized any penalties inconnection with our uncertain tax positions. The liabilities for unrecognized tax benefits and accrued interest payable arecomponents of other current liabilities on our balance sheet.The tax years 2008 through 2011 remain subject to examination by major tax jurisdictions.NOTE 11 — LONG-TERM DEBT:Long-term debt consisted of the following:As of December 31,<strong>2012</strong> 20116¾% Senior Subordinated Notes due 2014 ................................................. $ - $200,0008⅝% Senior Notes due 2017 ....................................................................... 375,000 375,0001¾% Senior Convertible Notes due 2017 ................................................... 239,126 -7½% Senior Notes due 2022 ....................................................................... 300,000 -Bank debt .................................................................................................... - 45,000Total long-term debt ........................................................................... $914,126 $620,000Bank DebtOn April 26, 2011, we entered into an amended and restated revolving credit facility with commitments totaling $700,000(subject to borrowing base limitations) through a syndicated bank group, replacing our previous facility. Our bank credit facilitymatures on April 26, 2015. On October 22, <strong>2012</strong>, the bank group reaffirmed our existing borrowing base at $400,000. As ofDecember 31, <strong>2012</strong> and February 21, 2013, we had no outstanding borrowings under our bank credit facility and letters of credittotaling $20,954 had been issued pursuant to the facility, leaving $379,046 of availability under the facility.The borrowing base under our bank credit facility is redetermined semi-annually, in May and November, by the lenders takinginto consideration the estimated value of our oil and gas properties and those of our direct and indirect material subsidiaries inaccordance with the lenders’ customary practices for oil and gas loans. In addition, we and the lenders each have discretion at anytime, but not more than two additional times in any calendar year, to have the borrowing base redetermined. If a reduction in ourborrowing base were to fall below any outstanding balances under the bank credit facility plus any outstanding letters of credit, ouragreement with the banks allows us one or more of three options to cure the borrowing base deficiency: (1) repay amountsoutstanding sufficient to cure the deficiency within 10 days after our written election to do so; (2) add additional oil and gasproperties acceptable to the banks to the borrowing base and take such actions necessary to grant the banks a mortgage in theproperties within 30 days after our written election to do so or (3) arrange to pay the deficiency in five equal monthly installments.F-20
Our bank credit facility is guaranteed by our only subsidiary, <strong>Stone</strong> Offshore. Our bank credit facility is collateralized bysubstantially all of <strong>Stone</strong>’s and <strong>Stone</strong> Offshore’s assets. <strong>Stone</strong> and <strong>Stone</strong> Offshore are required to mortgage, and grant a securityinterest in, their oil and gas reserves representing at least 80% of the discounted present value of the future net cash flows fromtheir oil and gas reserves reviewed in determining the borrowing base. At <strong>Stone</strong>’s option, loans under our bank credit facility willbear interest at a rate based on the adjusted London Interbank Offering Rate plus an applicable margin, or a rate based on the primerate or federal funds rate plus an applicable margin.Under the financial covenants of our bank credit facility, we must (i) maintain a ratio of consolidated debt to consolidatedEBITDA, as defined in the credit agreement, for the preceding four quarterly periods of not greater than 3.25 to 1 and (ii) maintaina ratio of consolidated EBITDA to consolidated Net Interest Expense, as defined in the credit agreement, for the preceding fourquarterly periods of not less than 3.0 to 1. As of December 31, <strong>2012</strong>, our debt to EBITDA Ratio was 1.55 to 1 and our EBITDAto consolidated Net Interest Expense Ratio was approximately 21.56 to 1. In addition, our bank credit facility includes certaincustomary restrictions or requirements with respect to disposition of properties, incurrence of additional debt, change of ownershipand reporting responsibilities. These covenants may limit or prohibit us from paying cash dividends but do allow for limited stockrepurchases. These covenants also restrict our ability to prepay other indebtedness under certain circumstances.Senior Convertible NotesOn March 6, <strong>2012</strong>, we issued in a private offering $300,000 in aggregate principal amount of 1¾% Senior Convertible Notesdue 2017 to qualified institutional buyers pursuant to Rule 144A under the Securities Act of 1933, as amended (the “SecuritiesAct”). The 2017 Convertible Notes are fully and unconditionally guaranteed on a senior unsecured basis by <strong>Stone</strong> Offshore and bycertain future restricted subsidiaries of <strong>Stone</strong>. The net proceeds from the sale of the 2017 Convertible Notes were approximately$291,145, after deducting fees and expenses. The 2017 Convertible Notes rank equally in right of payment with all of our existingand future senior unsecured indebtedness. The 2017 Convertible Notes are effectively subordinated to our secured indebtedness tothe extent of the value of the related collateral. The 2017 Convertible Notes bear interest at a rate of 1.75% per year, payable onMarch 1 and September 1 of each year, beginning on September 1, <strong>2012</strong>. The 2017 Convertible Notes mature on March 1, 2017,unless earlier converted or repurchased. We may not redeem the 2017 Convertible Notes at our option prior to the maturity date.The 2017 Convertible Notes are convertible into cash, shares of our common stock or a combination of cash and shares of ourcommon stock, at our election, based on an initial conversion rate of 23.4449 shares of our common stock per $1 principal amountof 2017 Convertible Notes, which corresponds to an initial conversion price of approximately $42.65 per share of our commonstock. On December 31, <strong>2012</strong>, our closing share price was $20.52. The conversion rate, and thus the conversion price, may beadjusted under certain circumstances as described in the indenture related to the 2017 Convertible Notes.The 2017 Convertible Notes may be converted by the holder, in multiples of $1 principal amount, only under the followingcircumstances:prior to December 1, 2016, on any date during any calendar quarter beginning after June 30, <strong>2012</strong> (and only duringsuch calendar quarter) if the closing sale price of our common stock was more than 130% of the then currentconversion price for at least 20 trading days in the period of the 30 consecutive trading days ending on the last tradingday of the previous calendar quarter;prior to December 1, 2016, if we distribute to all or substantially all holders of our common stock rights, options orwarrants entitling them to purchase, for a period of 45 calendar days or less from the declaration date for suchdistribution, shares of our common stock at a price per share less than the average closing sale price of our commonstock for the 10 consecutive trading days immediately preceding, but excluding, the declaration date for suchdistribution;prior to December 1, 2016, if we distribute to all or substantially all holders of our common stock cash, other assets,securities or rights to purchase our securities, which distribution has a per share value exceeding 10% of the closingsale price of our common stock on the trading day immediately preceding the declaration date for such distribution, orif we engage in certain corporate transactions described in the indenture related to the 2017 Convertible Notes;prior to December 1, 2016, during the five consecutive business-day period following any five consecutive tradingdayperiod in which the trading price per $1 principal amount of 2017 Convertible Notes for each trading day duringF-21
such five trading-day period was less than 98% of the closing sale price of our common stock for each trading dayduring such five trading-day period multiplied by the then current conversion rate; oron or after December 1, 2016, and prior to the close of business on the second scheduled trading day immediatelypreceding the maturity date of the 2017 Convertible Notes, which is March 1, 2017, without regard to the foregoingconditions.Upon conversion, we will be obligated to pay or deliver, as the case may be, cash, shares of our common stock or acombination of cash and shares of our common stock, at our election. If we satisfy our conversion obligation solely in cash orthrough payment and delivery, as the case may be, of a combination of cash and shares of our common stock, the amount of cashand shares of common stock, if any, due upon conversion will be based on a daily conversion value (as described in the indenturerelated to the 2017 Convertible Notes) calculated on a proportionate basis for each trading day in a 25 consecutive trading-dayconversion period (as described in the indenture related to the 2017 Convertible Notes). Upon any conversion, subject to certainexceptions, holders of the 2017 Convertible Notes will not receive any cash payment representing accrued and unpaid interest.Instead, interest will be deemed to be paid by the cash, shares of our common stock or a combination of cash and shares of ourcommon stock paid or delivered, as the case may be, upon conversion of a 2017 Convertible Note.If we undergo a fundamental change (as defined in the indenture related to the 2017 Convertible Notes) prior to maturity,holders of the 2017 Convertible Notes will have the right, at their option, to require us to repurchase for cash some or all of their2017 Convertible Notes at a repurchase price equal to 100% of the principal amount of the 2017 Convertible Notes beingrepurchased, plus accrued and unpaid interest (including additional interest, if any) to, but excluding, the fundamental changerepurchase date.If holders elect to convert the 2017 Convertible Notes in connection with certain fundamental change transactions described inthe indenture related to the 2017 Convertible Notes, we will increase the conversion rate by a number of additional sharesdetermined by reference to the provisions contained in the indenture related to the 2017 Convertible Notes based on the effectivedate of, and the price paid (or deemed paid) per share of our common stock in, such make-whole fundamental change. If holders ofour common stock receive only cash in connection with certain make-whole fundamental changes, the price paid (or deemed paid)per share will be the cash amount paid per share. Otherwise, the price paid (or deemed paid) per share will be equal to the averageof the closing sale prices of our common stock on the five trading days prior to, but excluding, the effective date of such makewholefundamental change.In connection with the sale of the 2017 Convertible Notes, we entered into convertible note hedge transactions with respect toour common stock (the “Purchased Call Options”) with Barclays Capital Inc., acting as agent for Barclays Bank PLC, and Bank ofAmerica, N.A. (the “Dealers”). We paid an aggregate amount of approximately $70,830 to the Dealers for the Purchased CallOptions. The Purchased Call Options cover, subject to customary antidilution adjustments, approximately 7,033,470 shares of ourcommon stock at a strike price that corresponds to the initial conversion price of the 2017 Convertible Notes, also subject toadjustment, and are exercisable upon conversion of the 2017 Convertible Notes.We also entered into separate warrant transactions whereby, in reliance upon the exemption from registration provided bySection 4(2) of the Securities Act, we sold to the Dealers warrants to acquire, subject to customary antidilution adjustments,approximately 7,033,470 shares of our common stock (the “Sold Warrants”) at a strike price of $55.91 per share of common stock.We received aggregate proceeds of approximately $40,170 from the sale of the Sold Warrants to the Dealers. If, upon expiration ofthe Sold Warrants, the price per share of our common stock, as measured under the Sold Warrants, is greater than the strike priceof the Sold Warrants, we will be required to issue, without further consideration, under each Sold Warrant a number of shares ofour common stock with a value equal to the amount of such difference.The Purchased Call Options and Sold Warrants are separate contracts entered into by <strong>Stone</strong> and each of the Dealers, are notpart of the terms of the 2017 Convertible Notes and will not affect the holders' rights under the 2017 Convertible Notes. ThePurchased Call Options are expected generally to reduce the potential dilution upon conversion of the 2017 Convertible Notes inthe event that the market value per share of our common stock at the time of exercise is greater than the strike price of thePurchased Call Options. The Sold Warrants could separately have a dilutive effect to the extent that the market value per share ofour common stock exceeds the applicable strike price of the Sold Warrants.F-22
The estimated liability and equity components of this offering were recorded in accordance with ASC 470-20. The initialcarrying amount of the liability component of $229,170 was determined by measuring the fair value of a similar liability that doesnot have an associated equity component. An effective market interest rate of 7.51% was used in the fair value determination.The carrying amount of the equity component of $70,830 was determined by deducting the fair value of the liability componentfrom the initial proceeds from the 2017 Convertible Notes. Transaction costs of approximately $8,855 were allocated to theliability and equity components in proportion to the allocation of proceeds and accounted for as debt issuance and equity issuancecosts, respectively. The cost of the convertible note hedge of $70,830 and proceeds from the warrant transaction of $40,170 wererecorded as adjustments to equity. A summary of the entries to record the proceeds from the 2017 Convertible Notes, the cost ofthe Purchased Call Options and the proceeds from the Sold Warrants is as follows:Cash ........................................................... $260,485Other assets (deferred financing costs) ...... 6,764Long-term debt .......................................... (229,170)Additional paid-in capital .......................... (38,079)As of December 31, <strong>2012</strong>, the carrying amount of the liability component of the 2017 Convertible Notes was $239,126.During the year ended December 31, <strong>2012</strong>, we recorded $9,956 of interest cost for the amortization of the discount and $951 ofinterest cost for the amortization of deferred financing costs related to the 2017 Convertible Notes. During the year endedDecember 31, <strong>2012</strong>, we recorded $4,302 of interest cost related to the contractual interest coupon on the 2017 Convertible Notes.At December 31, <strong>2012</strong>, $1,750 had been accrued in connection with the March 1, 2013 interest payment.Senior NotesOn November 8, <strong>2012</strong>, we completed the public offering of $300,000 aggregate principal amount of 7½% Senior Notes due2022, which are fully and unconditionally guaranteed on a senior unsecured basis by <strong>Stone</strong> Offshore and by certain futurerestricted subsidiaries of <strong>Stone</strong>. The net proceeds from the offering after deducting underwriting discounts, commissions, fees andexpenses totaled $293,203. The 2022 Notes rank equally in right of payment with all of our existing and future senior debt, andrank senior in right of payment to all of our existing and future subordinated debt. The 2022 Notes mature on November 15, 2022,and interest is payable on the 2022 Notes on each May 15 and November 15, commencing on May 15, 2013. We may redeemsome or all of the 2022 Notes at any time on or after November 15, 2017 at the redemption prices specified in the indenture, andwe may redeem some or all of the 2022 Notes prior to November 15, 2017 at a make-whole redemption price as specified in theindenture. We also may redeem up to 35% of the 2022 Notes prior to November 15, 2015 with cash proceeds from certain equityofferings at a redemption price of 107.500% of the principal amount thereof, plus accrued and unpaid interest, if any, to theredemption date. If we sell certain assets and do not reinvest the proceeds or repay senior indebtedness, or we experience certainchanges of control, each as described in the indenture, we must offer to repurchase the 2022 Notes. The 2022 Notes provide forcertain covenants, which include, without limitation, restrictions on liens, indebtedness, asset sales, dividend payments and otherrestricted payments. The violation of any of these covenants could give rise to a default, which if not cured could give the holderof the 2022 Notes a right to accelerate payment. At December 31, <strong>2012</strong>, $3,313 had been accrued in connection with the May 15,2013 interest payment.On January 26, 2010, we completed a public offering of $275,000 aggregate principal amount of 8⅝% Senior Notes due 2017,which are fully and unconditionally guaranteed on a senior unsecured basis by <strong>Stone</strong> Offshore and by certain future restrictedsubsidiaries of <strong>Stone</strong>. The net proceeds from the offering after deducting underwriting discounts, commissions, fees and expensestotaled $265,299. On November 17, 2010, we completed a public offering of an additional $100,000 aggregate principal amountof our 2017 Notes. The net proceeds from this offering after deducting underwriting discounts, commissions, fees and expensestotaled approximately $98,227. The 2017 Notes rank equally in right of payment with all of our existing and future senior debt,and rank senior in right of payment to all of our existing and future subordinated debt. The 2017 Notes mature on February 1,2017, and interest is payable on each February 1 and August 1, commencing on August 1, 2010. We may, at our option, redeem allor part of the 2017 Notes at any time prior to February 1, 2014 at a make-whole redemption price, and at any time on or afterFebruary 1, 2014 at fixed redemption prices. In addition, prior to February 1, 2013, we may, at our option, redeem up to 35% ofthe 2017 Notes with the cash proceeds of certain equity offerings. The 2017 Notes provide for certain covenants, which include,without limitation, restrictions on liens, indebtedness, asset sales, dividend payments and other restricted payments. The violationof any of these covenants could give rise to a default, which if not cured could give the holder of the 2017 Notes a right toaccelerate payment. At December 31, <strong>2012</strong>, $13,477 had been accrued in connection with the February 1, 2013 interest payment.F-23
Senior Subordinated NotesOn December 15, 2004, we issued $200,000 6¾% Senior Subordinated Notes due 2014. In November <strong>2012</strong>, we used proceedsfrom the 2022 Notes offering to purchase a portion of our 2014 Notes pursuant to a tender offer and consent solicitation. InDecember <strong>2012</strong>, the remaining 2014 Notes were redeemed in full. The total cost of the redemption was $204,355, which included$200,681 to redeem the notes plus accrued and unpaid interest of $3,674. The transaction resulted in a charge to earnings of$1,972 in <strong>2012</strong>.On December 5, 2001, we issued $200,000 8¼% Senior Subordinated Notes due 2011 (the “2011 Notes”). In January 2010,we used the proceeds from the 2017 Notes offering to purchase our 2011 Notes pursuant to a tender offer and consent solicitation.In February 2010, the remaining 2011 Notes were redeemed in full. The total cost of the redemption was $202,382, whichincluded $200,483 to redeem the notes plus accrued and unpaid interest of $1,899. The transaction resulted in a charge to earningsof $1,820 in 2010.Deferred Financing Cost and Interest CostOther assets at December 31, <strong>2012</strong> and 2011 included approximately $27,753 and $14,437, respectively, of deferred financingcosts, net of accumulated amortization. These costs at December 31, <strong>2012</strong> related primarily to the issuance of the 2017 ConvertibleNotes, the 2022 Notes, the 2017 Notes and our bank credit facility. The costs associated with the 2017 Convertible Notes, the2022 Notes and the 2017 Notes are being amortized over the life of the notes using a method that applies effective interest rates of7.51%, 7.75% and 8.08%, respectively. The costs associated with our bank credit facility are being amortized over the term of thefacility.Total interest cost incurred, before capitalization, on all obligations for the years ended December 31, <strong>2012</strong>, 2011 and 2010was $68,031, $51,322 and $42,975 respectively.NOTE 12STOCK-BASED COMPENSATION:We record stock compensation expense under U.S. GAAP for stock options and other equity-based compensation awards basedon the fair value on the date of grant. Compensation expense for equity-based compensation awards is recognized in our financialstatements over the vesting period of the award.For the year ended December 31, <strong>2012</strong>, we incurred $13,399 of stock based compensation, of which $13,308 related torestricted stock issuances, $91 related to stock option grants and of which a total of approximately $4,288 was capitalized into oiland gas properties. For the year ended December 31, 2011, we incurred $8,914 of stock based compensation, of which $8,796related to restricted stock issuances, $118 related to stock option grants and of which a total of approximately $3,010 wascapitalized into oil and gas properties. For the year ended December 31, 2010, we incurred $8,462 of stock based compensation,of which $8,263 related to restricted stock issuances, $199 related to stock option grants and of which a total of approximately$2,775 was capitalized into oil and gas properties. Because of the non-cash nature of stock based compensation, the expensedportion of stock based compensation is added back to net income in arriving at net cash provided by operating activities in ourstatement of cash flows. The capitalized portion is not included in net cash used in investing activities.Under the <strong>Stone</strong> <strong>Energy</strong> <strong>Corporation</strong> 2009 Amended and Restated Stock Incentive Plan (the “2009 Plan”), we may grant bothincentive stock options qualifying under Section 422 of the Internal Revenue Code and options that are not qualified as incentivestock options to all employees and directors. All such options must have an exercise price of not less than the fair market value ofthe common stock on the date of grant and may not be re-priced without stockholder approval. Stock options to all employees vestratably over a five-year service-vesting period and expire 10 years subsequent to award. Stock options issued to non-employeedirectors vest ratably over a three-year service-vesting period and expire 10 years subsequent to award. In addition, the 2009 Planprovides that shares available under the 2009 Plan may be granted as restricted stock. Restricted stock typically vests over a onetothree-year period.F-24
Stock Options. There were no stock option grants during the years ended December 31, <strong>2012</strong>, 2011 or 2010.A summary of stock option activity under the 2009 Plan during the year ended December 31, <strong>2012</strong> is as follows (amounts intable represent actual values except where indicated otherwise):NumberofOptionsWgtd.Avg.ExercisePriceWgtd.Avg.TermAggregateIntrinsicValue(in thousands)Options outstanding, beginning of period ....... 438,394 $38.76Granted ............................................................ - -Exercised ......................................................... - -Forfeited .......................................................... (4,200) 35.54Expired ............................................................ (22,400) 34.25Options outstanding, end of period ................. 411,794 39.04 2.8 years $766Options exercisable, end of period .................. 378,004 41.00 2.5 years 459Options unvested, end of period ...................... 33,790 17.17 5.4 years 307Exercise prices for stock options outstanding at December 31, <strong>2012</strong> range from $6.97 to $53.20.A summary of stock option activity under the 2009 Plan during the year ended December 31, 2011 is as follows (amounts intable represent actual values except where indicated otherwise):NumberofOptionsWgtd.Avg.ExercisePriceWgtd.Avg.TermAggregateIntrinsicValue(in thousands)Options outstanding, beginning of period ....... 484,694 $39.43Granted ............................................................ - -Exercised ......................................................... - -Forfeited .......................................................... (13,300) 37.98Expired ............................................................ (33,000) 48.85Options outstanding, end of period ................. 438,394 38.76 3.6 years $1,143Options exercisable, end of period .................. 378,710 41.66 3.1 years 457Options unvested, end of period ...................... 59,684 20.36 6.1 years 686A summary of stock option activity under the 2009 Plan during the year ended December 31, 2010 is as follows (amounts intable represent actual values except where indicated otherwise):NumberofOptionsWgtd.Avg.ExercisePriceWgtd.Avg.TermAggregateIntrinsicValue(in thousands)Options outstanding, beginning of period ....... 495,283 $39.61Granted ............................................................ - -Exercised ......................................................... - -Forfeited .......................................................... (6,190) 40.85Expired ............................................................ (4,399) 57.76Options outstanding, end of period ................. 484,694 39.43 3.8 years $880Options exercisable, end of period .................. 396,115 43.21 3.4 years 176Options unvested, end of period ...................... 88,579 22.50 6.9 years 704Restricted Stock. The fair value of restricted shares is typically determined based on the average of our high and low stockprices on the grant date. During the year ended December 31, <strong>2012</strong>, we issued 670,818 shares of restricted stock valued at$21,085. During the year ended December 31, 2011, we issued 597,062 shares of restricted stock valued at $14,100. During theyear ended December 31, 2010, we issued 395,869 shares of restricted stock valued at $6,251.F-25
A summary of the restricted stock activity under the 2009 Plan for the years ended December 31, <strong>2012</strong>, 2011 and 2010 is asfollows (amounts in table represent actual values):Number ofRestrictedShares<strong>2012</strong> 2011 2010Wgtd.Wgtd.Avg.Number ofAvg.Number ofFair Value Restricted Fair Value RestrictedPer Share Shares Per Share SharesWgtd.Avg.Fair ValuePer ShareRestricted stock outstanding,beginning of period .... .............. 923,740 $20.08 783,606 $17.24 751,437 $20.68Issuances .......................................... 670,818 31.43 597,062 23.62 395,869 15.79Lapse of restrictions ......................... (462,141) 18.29 (419,543) 19.91 (343,657) 23.09Forfeitures ........................................ (23,543) 26.10 (37,385) 18.92 (20,043) 18.07Restricted stock outstanding,end of period ............................. 1,108,874 $27.56 923,740 $20.08 783,606 $17.24As of December 31, <strong>2012</strong>, there was $18,547 of unrecognized compensation cost related to all non-vested share-basedcompensation arrangements under the 2009 Plan. That cost is being amortized on a straight-line basis over the vesting period andis expected to be recognized over a weighted-average period of 1.8 years.Under U.S. GAAP, if tax deductions exceed book compensation expense, then excess tax benefits are credited to additionalpaid-in capital to the extent realized. If book compensation expense exceeds tax deductions, the tax deficit results in either areduction in additional paid-in capital or an increase in income tax expense depending on the pool of available excess tax benefitsto offset such deficit. Adjustments to additional paid-in capital related to the net tax effect of stock option exercises and restrictedstock vesting were $814, $735 and ($2) in <strong>2012</strong>, 2011 and 2010, respectively.NOTE 13SHARE REPURCHASE PROGRAM:On September 24, 2007, our board of directors authorized a share repurchase program for an aggregate amount of up to$100,000. The shares may be repurchased from time to time in the open market or through privately negotiated transactions. Therepurchase program is subject to business and market conditions, and may be suspended or discontinued at any time. ThroughDecember 31, <strong>2012</strong>, 300,000 shares had been repurchased under this program at a total cost of $7,071, or an average price of$23.57 per share. No shares were repurchased during the years ended December 31, <strong>2012</strong>, 2011 and 2010.NOTE 14 — COMMITMENTS AND CONTINGENCIES:Lease CommitmentsWe lease office facilities in Lafayette and New Orleans, Louisiana, Houston, Texas and Morgantown, West Virginia under theterms of long-term, non-cancelable leases expiring on various dates through 2018. We also lease certain equipment on our oil andgas properties typically on a month-to-month basis. The minimum net annual commitments under all leases, subleases andcontracts with non-cancelable terms in excess of 12 months at December 31, <strong>2012</strong> were as follows:2013 ............................... $6122014 ............................... 5402015 ............................... 5402016 ............................... 2602017 ............................... 2032018 ............................... 82Payments related to our lease obligations for the years ended December 31, <strong>2012</strong>, 2011 and 2010 were approximately $894,$446 and $703, respectively.Other CommitmentsWe are contingently liable to surety insurance companies in the amount of $90,789 relative to bonds issued on our behalf to theBureau of Ocean <strong>Energy</strong> Management (“BOEM”), federal and state agencies and certain third parties from which we purchased oiland gas working interests. The bonds represent guarantees by the surety insurance companies that we will operate in accordanceF-26
with applicable rules and regulations and perform certain plugging and abandonment obligations as specified by applicableworking interest purchase and sale agreements.In connection with our exploration and development efforts, we are contractually committed to the use of drilling rigs and theacquisition of seismic data in the aggregate amount of $52,299 to be incurred over the next three years.The Oil Pollution Act (“OPA”) imposes ongoing requirements on a responsible party, including the preparation of oil spillresponse plans and proof of financial responsibility to cover environmental cleanup and restoration costs that could be incurred inconnection with an oil spill. Under the OPA and a final rule adopted by the BOEM in August 1998, responsible parties of coveredoffshore facilities that have a worst case oil spill of more than 1,000 barrels must demonstrate financial responsibility in amountsranging from at least $10,000 in specified state waters to at least $35,000 in Outer Continental Shelf (“OCS”) waters, with higheramounts of up to $150,000 in certain limited circumstances where the BOEM believes such a level is justified by the risks posedby the operations, or if the worst case oil-spill discharge volume possible at the facility may exceed the applicable thresholdvolumes specified under the BOEM’s final rule. We do not anticipate that we will experience any difficulty in continuing tosatisfy the BOEM’s requirements for demonstrating financial responsibility under the OPA and the BOEM’s regulations.LitigationWe are also named as a defendant in certain lawsuits and are a party to certain regulatory proceedings arising in the ordinarycourse of business. We do not expect that these matters, individually or in the aggregate, will have a material adverse effect on ourfinancial condition.We have been served with several petitions filed by the Louisiana Department of Revenue (“LDR”) in Louisiana state courtclaiming additional franchise taxes due. In addition, we have received preliminary assessments from the LDR for additionalfranchise taxes resulting from audits of <strong>Stone</strong> and other subsidiaries. These assessments all relate to the LDR’s assertion that salesof crude oil and natural gas from properties located on the OCS, which are transported through the State of Louisiana, should besourced to the State of Louisiana for purposes of computing the Louisiana franchise tax apportionment ratio. We disagree withthese contentions and are defending ourselves against these claims. Total asserted claims plus estimated accrued interest amountto approximately $29,581. The franchise tax years 2010, 2011 and <strong>2012</strong> for <strong>Stone</strong> remain subject to examination, whichpotentially exposes us to additional estimated assessments of $2,440 including accrued interest. We estimate the potential range ofloss upon resolution of this matter to be between $0 and $32,021.NOTE 15 — EMPLOYEE BENEFIT PLANS:We have entered into deferred compensation and disability agreements with certain of our officers and former officers. Thebenefits under the deferred compensation agreements vest after certain periods of employment, and at December 31, <strong>2012</strong>, theliability for such vested benefits was approximately $1,059 and is recorded in current and other long-term liabilities.The following is a brief description of each incentive compensation plan applicable to our employees:<strong>Annual</strong> Cash Incentive Compensation PlanThe Amended and Restated Revised <strong>Annual</strong> Incentive Compensation Plan, which was adopted in November 2007, provides forannual cash incentive bonuses that are tied to the achievement of certain strategic objectives as defined by our board of directorson an annual basis. <strong>Stone</strong> incurred expenses of $8,113, $11,600, and $5,888, net of amounts capitalized, for each of the yearsended December 31, <strong>2012</strong>, 2011 and 2010, respectively, related to incentive compensation bonuses to be paid under the revisedplan.Stock Incentive PlansAt the 2011 <strong>Annual</strong> Meeting of Stockholders, the stockholders approved the First Amendment (the “First Amendment”) to the2009 Plan. The First Amendment increases the number of shares of common stock that <strong>Stone</strong> may issue under the 2009 Plan, andthe number of shares of common stock that may be issued under the 2009 Plan through incentive stock options by 2,800,000shares, effective May 20, 2011. The 2009 Plan is an amendment and restatement of the company’s 2004 Amended and RestatedStock Incentive Plan (the “2004 Plan”) and it supersedes and replaces in its entirety the 2004 Plan. The 2009 Plan provides for thegranting of incentive stock options and restricted stock awards or any combination as is best suited to the circumstances of theparticular employee or nonemployee director. The 2009 Plan eliminates the automatic grant of stock options or restricted stockawards to nonemployee directors that was provided for in the 2004 Plan so that awards under the 2009 Plan are entirely at thediscretion of the board of directors. Under the 2009 Plan, we may grant both incentive stock options qualifying under Section 422F-27
of the Internal Revenue Code and options that are not qualified as incentive stock options to all employees and directors. All suchoptions must have an exercise price of not less than the fair market value of the common stock on the date of grant and may not bere-priced without stockholder approval. Stock options to all employees vest ratably over a five-year service-vesting period andexpire 10 years subsequent to award. Stock options issued to non-employee directors vest ratably over a three-year service-vestingperiod and expire 10 years subsequent to award. In addition, the 2009 Plan provides that shares available under the 2009 Plan maybe granted as restricted stock. Restricted stock grants typically vest in one to three years at the discretion of the CompensationCommittee of the board of directors. At December 31, <strong>2012</strong>, we had approximately 2,684,466 additional shares available forissuance pursuant to the Plan.401(k) and Deferred Compensation PlansThe <strong>Stone</strong> <strong>Energy</strong> 401(k) Profit Sharing Plan provides eligible employees with the option to defer receipt of a portion of theircompensation and we may, at our discretion, match a portion or all of the employee's deferral. The amounts held under the planare invested in various investment funds maintained by a third party in accordance with the directions of each employee. Anemployee is 20% vested in matching contributions (if any) for each year of service and is fully vested upon five years of service.For the years ended December 31, <strong>2012</strong>, 2011 and 2010, <strong>Stone</strong> contributed $1,759, $1,435 and $1,301, respectively, to the plan.The <strong>Stone</strong> <strong>Energy</strong> <strong>Corporation</strong> Deferred Compensation Plan provides eligible executives and employees with the option todefer up to 100% of their compensation for a calendar year and we may, at our discretion, match a portion or all of theparticipant’s deferral based upon a percentage determined by the board of directors. To date there have been no matchingcontributions made by <strong>Stone</strong>. The amounts held under the plan are invested in various investment funds maintained by a thirdparty in accordance with the direction of each participant. At December 31, <strong>2012</strong> and 2011, plan assets of $7,498 and $6,410,respectively, were included in other assets. An equal amount of plan liabilities were included in other long-term liabilities.Change of Control and Severance PlansOn April 7, 2009, we amended and restated our Executive Change of Control and Severance Plan effective as of December 31,2008 (as so amended and restated, the “Executive Plan”). The Executive Plan also replaced and superseded our Executive Changein Control and Severance Policy that was maintained for certain designated executives (specifically, the CEO and CFO). TheExecutive Plan will provide the company’s officers that are terminated in the event of a change of control and upon certain otherterminations of employment with change of control and severance benefits as defined in the Executive Plan. Executives who areterminated within the scope of the Executive Plan will be entitled to certain payments and benefits including the following: a basesalary up to the date of termination; in the case of the CEO and CFO, a lump sum severance payment of 2.99 times the sum of hisannual pay and any target bonus at the one hundred percent level; a lump sum amount representing a pro rata share of the bonusopportunity up to the date of termination at the then projected rate of payout; in the case of officers other than the CEO and CFOand an involuntary termination occurring outside a change of control period, a lump sum severance payment in an amount equal tothe executive’s annual base salary; in the case of officers other than the CEO and CFO and an involuntary termination occurringduring a change of control period, a lump sum severance payment in an amount equal to 2.99 times the executive’s annual basesalary; continued health plan coverage for six months and outplacement services. In the case of the CEO and CFO, if thepayments would be “excess parachute payments,” they will be reduced as necessary to avoid the 20% excise tax under Section4999 of the Internal Revenue Code of 1986, as amended (the “Code”), but only if the executive is in a better net after-tax positionafter such reduction. Also, if a payment would be to a “key employee” for purposes of Section 409A of the Code, payment will bedelayed until six months after his termination if required to comply with Section 409A. Benefits paid upon a change of control,without regard to whether there is a termination of employment, include the following: lapse of restrictions on restricted stock,accelerated vesting and cash-out of all in-the-money stock options, a 401(k) plan employer matching contribution at the rate of50%, and a pro-rated portion of the projected bonus, if any, for the year of change of control.On December 7, 2007, our board of directors approved and adopted the <strong>Stone</strong> <strong>Energy</strong> <strong>Corporation</strong> Employee Change ofControl Severance Plan (“Employee Severance Plan”), as amended and restated to comply with the final regulations under Section409A of the Internal Revenue Code and to provide that said plan will remain in force and effect unless and until terminated by theboard of directors. The Employee Severance Plan amended and restated the company’s previous Employee Change of ControlSeverance Plan dated November 16, 2006. The Employee Severance Plan covers all full-time employees other than officers.Severance is triggered by an involuntary termination of employment on and during the six-month period following a change ofcontrol, including a resignation by the employee relating to a change in duties. Employees who are terminated within the scope ofthe Employee Severance Plan will be entitled to certain payments and benefits including the following: a lump sum equal to (1)weekly pay times full years of service, plus (2) one week’s pay for each full $10,000 of annual pay, but the sum of (1) and (2)cannot be less than 12 weeks of pay or greater than 52 weeks of pay; continued health plan coverage for six months; and a proratedportion of the employee’s targeted bonus for the year. Benefits paid upon a change of control, without regard to whetherthere is a termination of employment, include the following: lapse of restrictions on restricted stock, accelerated vesting and cash-F-28
out of all in-the-money stock options, a 401(k) plan employer matching contribution at the rate of 50%, and a lump sum cashpayment equal to the product of (i) the number of “restricted shares” of company stock that the employee would have receivedunder the company’s stock plan but did not receive for the time-vested portion of his long-term stock incentive award, if any, forthe calendar year in which the change of control occurs times (ii) the price per share of the company’s common stock utilized ineffecting the change of control, provided that such amount shall be pro-rated by multiplying such amount by the number of fullmonths that have elapsed from January 1 of that calendar year to the effective date of the change of control and then dividing theresult by 12.NOTE 16 — OIL AND GAS RESERVE INFORMATION – UNAUDITED:Our estimated net proved oil and gas reserves at December 31, <strong>2012</strong> have been prepared in accordance with guidelinesestablished by the Securities and Exchange Commission (“SEC”). Accordingly, the following reserve estimates are based uponexisting economic and operating conditions at the respective dates. There are numerous uncertainties inherent in estimatingquantities of proved reserves and in providing the future rates of production and timing of development expenditures. Thefollowing reserve data represents estimates only and should not be construed as being exact. In addition, the present values shouldnot be construed as the market value of the oil and gas properties or the cost that would be incurred to obtain equivalent reserves.The following table sets forth an analysis of the estimated quantities of net proved and proved developed oil (includingcondensate), natural gas and natural gas liquids (“NGL”) reserves, all of which are located onshore and offshore the continentalUnited States. Estimated proved oil, natural gas and NGL reserves at December 31, <strong>2012</strong>, 2011 and 2010 are prepared inaccordance with the SEC’s rule, “Modernization of Oil and Gas <strong>Report</strong>ing,” using a 12-month average pricing assumption. In thefirst quarter of <strong>2012</strong>, we began reporting NGL volumes and revenues separately from gas volumes. Historically, we reported“wet” gas volumes, which included entrained liquids. We now report NGLs and “dry” gas (shrunk for removal of liquids)volumes. Reserve volumes for the year ended December 31, 2011 have been reclassified to conform to the current presentation.Reserve volumes for the years ended December 31, 2010 and 2009 have not been reclassified to conform to the currentpresentation given the immateriality of NGL volumes in such periods.NaturalGas(MMcf)Oil,NaturalGas andNGLs(MMcfe)Oil(MBbls)NGLs(MBbls)Estimated proved reserves as of December 31, 2009 ................................... 32,336 - 216,694 410,711Revisions of previous estimates .............................................................. 3,299 574 12,670 35,906Extensions, discoveries and other additions ........................................... 2,668 - 82,846 98,854Purchase of producing properties ........................................................... 637 - 3,816 7,637Sale of reserves ....................................................................................... (23) - (153) (289)Production ............................................................................................... (5,714) (574) (41,168) (78,896)Estimated proved reserves as of December 31, 2010 ................................... 33,203 - 274,705 473,923Revisions of previous estimates .............................................................. 2,889 4,911 (26,725) 20,075Extensions, discoveries and other additions ........................................... 3,544 - 93,520 114,784Purchase of producing properties ........................................................... 14,396 - 24,595 110,971Sale of reserves ....................................................................................... (1,950) - (2,150) (13,850)Production ............................................................................................... (6,427) (506) (38,466) (80,064)Estimated proved reserves as of December 31, 2011 ................................... 45,655 4,405 325,479 625,839Revisions of previous estimates .............................................................. (1,559) 9,349 (26,694) 20,050Extensions, discoveries and other additions ........................................... 3,681 4,856 131,408 182,633Purchase of producing properties ........................................................... 4,336 619 8,168 37,895Sale of reserves ....................................................................................... (60) - (418) (775)Production ............................................................................................... (7,135) (1,163) (42,569) (92,357)Estimated proved reserves as of December 31, <strong>2012</strong> ................................... 44,918 18,066 395,374 773,285Estimated proved developed reserves:as of December 31, 2010 ........................................................................ 25,000 - 174,876 324,876as of December 31, 2011 ........................................................................ 30,914 3,195 171,871 376,528as of December 31, <strong>2012</strong> ........................................................................ 29,005 8,593 210,956 436,540F-29
The following narrative provides the reasons for the significant changes in the quantities of our estimated proved reserves byyear.Year Ended December 31, <strong>2012</strong>. Extensions, discoveries and other additions were primarily the result of our Appalachiadrilling program (162 Bcfe) and our deep gas development project at LaCantera (17 Bcfe). Purchase of producing propertiesrelates to our acquisition of an additional interest in the Pompano field.Year Ended December 31, 2011. Extensions, discoveries and other additions were primarily the result of our Appalachiadrilling program (94 Bcfe), our deep gas development project at LaPosada (11 Bcfe) and our GOM drilling program at MississippiCanyon Block 109 (6 Bcfe). Purchase of producing properties primarily relates to our acquisition of the Pompano and Mica fields(102 Bcfe) and our acquisition of an additional 15% working interest in the Pyrenees project (6 Bcfe). Sale of reserves primarilyrelates to the sale of our non-operated interest in the Main Pass Block 296 and 311 fields (13 Bcfe).Year Ended December 31, 2010. Revisions of previous estimates were the result of positive reserve report pricing changesextending the economic limits of reservoirs (28 Bcfe) and well performance (5 Bcfe). Extensions, discoveries and other additionswere primarily the result of our Appalachia drilling program (77 Bcfe) and our GOM drilling program primarily at MississippiCanyon Block 109 (18 Bcfe).The following tables present the standardized measure of discounted future net cash flows related to estimated proved oil,natural gas and NGL reserves together with changes therein, including a reduction for estimated plugging and abandonment coststhat are also reflected as a liability on the balance sheet at December 31, <strong>2012</strong>. You should not assume that the future net cashflows or the discounted future net cash flows, referred to in the tables below, represent the fair value of our estimated oil, naturalgas and NGL reserves. Prices are based on either the preceding 12-months’ average price based on closing prices on the first dayof each month, or prices defined by existing contractual arrangements. The <strong>2012</strong> average 12-month oil and gas prices net ofdifferentials were $101.20 per Bbl of oil, $38.23 per Bbl of NGLs and $2.68 per Mcf of gas. The 2011 average 12-month oil andgas prices net of differentials were $100.97 per Bbl of oil, $58.26 per Bbl of NGLs and $4.74 per Mcf of gas. The 2010 average12-month oil and gas prices net of differentials were $77.68 per Bbl of oil and $4.46 per Mcf of gas. Future production anddevelopment costs are based on current costs with no escalations. Estimated future cash flows net of future income taxes havebeen discounted to their present values based on a 10% annual discount rate.Standardized Measure Year Ended December 31,<strong>2012</strong> 2011 2010Future cash inflows ...................................................................... $6,295,455 $6,171,279 $3,803,004Future production costs................................................................ (1,946,426) (1,747,806) (1,191,718)Future development costs ............................................................ (1,241,531) (1,219,214) (907,956)Future income taxes ..................................................................... (799,007) (852,364) (330,651)Future net cash flows ................................................................... 2,308,491 2,351,895 1,372,67910% annual discount .................................................................... (794,632) (808,933) (415,050)Standardized measure of discounted future net cash flows ......... $1,513,859 $1,542,962 $957,629F-30
Changes in Standardized MeasureYear Ended December 31,<strong>2012</strong> 2011 2010Standardized measure at beginning of year ................................. $1,542,962 $957,629 $614,987Sales and transfers of oil, gas and NGLs produced, net ofproduction costs ................................................................. (697,741) (670,347) (487,418)Changes in price, net of future production costs .................... (380,841) 502,324 485,272Extensions and discoveries, net of future productionand development costs ....................................................... 178,272 293,168 270,629Changes in estimated future development costs, net ofdevelopment costs incurred during the period ................... 212,329 97,852 119,986Revisions of quantity estimates .............................................. 76,450 (27,854) 147,509Accretion of discount ............................................................. 207,292 118,722 64,836Net change in income taxes ................................................... 22,947 (300,363) (196,219)Purchases of reserves in-place ............................................... 276,389 567,286 21,264Sales of reserves in-place ....................................................... 2,480 (36,278) 1,424Changes in production rates due to timing and other ............. 73,320 40,823 (84,641)Net increase (decrease) in standardized measure ........... (29,103) 585,333 342,642Standardized measure at end of year ........................................... $1,513,859 $1,542,962 $957,629NOTE 17 — SUMMARIZED QUARTERLY FINANCIAL INFORMATION – UNAUDITED:The results of operations by quarter are as follows:<strong>2012</strong> Quarter EndedMarch 31 June 30 September 30 December 31Operating revenue .............................................. $244,957 $226,561 $227,397 $254,871Income from operations ...................................... 84,927 56,156 44,485 78,397Net income ........................................................ 50,974 30,547 23,659 44,246Basic earnings per share ..................................... $1.03 $0.62 $0.48 $0.89Diluted earnings per share .................................. $1.03 $0.62 $0.48 $0.892011 Quarter EndedMarch 31 June 30 September 30 December 31Operating revenue .............................................. $200,039 $235,734 $214,594 $223,616Income from operations ...................................... 64,752 92,155 80,694 73,399Net income ........................................................ 39,792 57,196 51,821 45,523Basic earnings per share ..................................... $0.81 $1.17 $1.06 $0.93Diluted earnings per share .................................. $0.81 $1.17 $1.06 $0.93F-31
NOTE 18 – GUARANTOR FINANCIAL STATEMENTS:<strong>Stone</strong> Offshore is an unconditional guarantor (the “Guarantor Subsidiary”) of our 2017 Notes, 2017 Convertible Notes and2022 Notes. Our other subsidiary (the “Non-Guarantor Subsidiary”) did not provide a guarantee. Our non-guarantor subsidiary,Caillou Boca, was merged into <strong>Stone</strong> Offshore on September 6, <strong>2012</strong>. The following presents consolidating financial informationas of December 31, <strong>2012</strong> and 2011 and for the years ended December 31, <strong>2012</strong>, 2011 and 2010 on an issuer (parent company),guarantor subsidiary, non-guarantor subsidiary, and consolidated basis. Elimination entries presented are necessary to combine theentities.CONDENSED CONSOLIDATING BALANCE SHEETDECEMBER 31, <strong>2012</strong>(In thousands of dollars)GuarantorSubsidiaryNon-GuarantorSubsidiary Eliminations ConsolidatedParentAssetsCurrent assets:Cash and cash equivalents ............................ $228,398 $51,128 $ - $ - $279,526Accounts receivable ...................................... 59,213 108,075 - - 167,288Fair value of hedging contracts ..................... - 39,655 - - 39,655Current income tax receivable ...................... 10,027 - - - 10,027Deferred taxes *............................................ 5,947 9,567 - - 15,514Inventory ....................................................... 3,924 283 - - 4,207Other current assets ....................................... 3,626 - - - 3,626Total current assets ..................................... 311,135 208,708 - - 519,843Oil and gas properties, full cost method:Proved, net .............................................. 634,697 1,099,603 - - 1,734,300Unevaluated ............................................. 254,757 193,038 - - 447,795Other property and equipment, net ............... 22,115 - - - 22,115Fair value of hedging contracts ..................... - 9,199 - - 9,199Other assets, net ............................................ 41,679 1,500 - - 43,179Investment in subsidiary ............................... 736,331 - - (736,331) -Total assets .................................................. $2,000,714 $1,512,048 $ - ($736,331) $2,776,431Liabilities and Stockholders' EquityCurrent liabilities:Accounts payable to vendors ....................... $74,503 $19,858 $ - $ - $94,361Undistributed oil and gas proceeds ............... 21,841 1,573 - - 23,414Accrued interest ............................................ 18,546 - - - 18,546Fair value of hedging contracts ..................... - 149 - - 149Asset retirement obligations ......................... - 66,260 - - 66,260Other current liabilities ................................. 16,765 - - - 16,765Total current liabilities ............................... 131,655 87,840 - - 219,495Long-term debt ............................................. 914,126 - - - 914,126Deferred taxes *............................................ 47,758 263,072 - - 310,830Asset retirement obligations ......................... 5,479 416,563 - - 422,042Fair value of hedging contracts ..................... - 1,530 - - 1,530Other long-term liabilities ............................. 29,563 6,712 - - 36,275Total liabilities ............................................. 1,128,581 775,717 - - 1,904,298Commitments and contingenciesStockholders’ equity:Common stock .............................................. 484 - - - 484Treasury stock ............................................... (860) - - - (860)Additional paid-in capital ............................. 1,386,475 1,496,510 - (1,496,510) 1,386,475Accumulated earnings (deficit)..................... (542,799) (789,012) - 789,012 (542,799)Accumulated other comprehensive income(loss) ................................................... 28,833 28,833 - (28,833) 28,833Total stockholders’ equity .......................... 872,133 736,331 - (736,331) 872,133Total liabilities and stockholders’ equity .. $2,000,714 $1,512,048 $ - ($736,331) $2,776,431* Deferred income taxes have been allocated to guarantor subsidiary where related oil and gas properties reside.F-32
CONDENSED CONSOLIDATING BALANCE SHEETDECEMBER 31, 2011(In thousands of dollars)GuarantorSubsidiaryNon-GuarantorSubsidiary Eliminations ConsolidatedParentAssetsCurrent assets:Cash and cash equivalents ............................ $37,389 $926 $136 $ - $38,451Accounts receivable ...................................... 36,463 81,452 1,353 (1,129) 118,139Fair value of hedging contracts ..................... - 25,177 - - 25,177Current income tax receivable ...................... 19,946 - - - 19,946Deferred taxes *............................................ 8,269 17,803 - - 26,072Inventory ....................................................... 4,360 283 - - 4,643Other current assets ....................................... 791 - - - 791Total current assets ..................................... 107,218 125,641 1,489 (1,129) 233,219Oil and gas properties, full cost method:Proved, net .............................................. 387,554 1,083,192 2,693 - 1,473,439Unevaluated ............................................. 246,269 155,340 - - 401,609Other property and equipment, net ............... 11,172 - - - 11,172Fair value of hedging contracts ..................... - 22,543 - - 22,543Other assets, net ............................................ 20,873 2,896 - - 23,769Investment in subsidiary ............................... 733,533 (273) - (733,260) -Total assets .................................................. $1,506,619 $1,389,339 $4,182 ($734,389) $2,165,751Liabilities and Stockholders' EquityCurrent liabilities:Accounts payable to vendors ....................... $78,170 $25,866 $39 ($1,129) $102,946Undistributed oil and gas proceeds ............... 26,036 1,292 - - 27,328Accrued interest ............................................ 14,059 - - - 14,059Fair value of hedging contracts ..................... - 11,122 - - 11,122Asset retirement obligations ......................... - 62,676 - - 62,676Other current liabilities ................................. 22,974 5,396 - - 28,370Total current liabilities ............................... 141,239 106,352 39 (1,129) 246,501Long-term debt ............................................. 620,000 - - - 620,000Deferred taxes *............................................ 56,970 190,865 - - 247,835Asset retirement obligations ......................... 7,626 351,061 4,416 - 363,103Fair value of hedging contracts ..................... - 815 - - 815Other long-term liabilities ............................. 12,955 6,713 - - 19,668Total liabilities ............................................. 838,790 655,806 4,455 (1,129) 1,497,922Commitments and contingenciesStockholders’ equity:Common stock .............................................. 481 - - - 481Treasury stock ............................................... (860) - - - (860)Additional paid-in capital ............................. 1,338,565 1,724,232 1,639 (1,725,871) 1,338,565Accumulated earnings (deficit)..................... (692,225) (1,012,567) (1,912) 1,014,479 (692,225)Accumulated other comprehensive income(loss) ................................................... 21,868 21,868 - (21,868) 21,868Total stockholders’ equity .......................... 667,829 733,533 (273) (733,260) 667,829Total liabilities and stockholders’ equity .. $1,506,619 $1,389,339 $4,182 ($734,389) $2,165,751* Deferred income taxes have been allocated to guarantor subsidiary where related oil and gas properties reside.F-33
CONDENSED CONSOLIDATING STATEMENT OF OPERATIONSYEAR ENDED DECEMBER 31, <strong>2012</strong>(In thousands of dollars)ParentGuarantorSubsidiaryNon-GuarantorSubsidiary Eliminations ConsolidatedOperating revenue:Oil production ................................................. $26,149 $735,155 $ - $ - $761,304Gas production ................................................ 34,331 100,408 - - 134,739Natural gas liquids production ........................ 15,264 33,234 - - 48,498Other operational income ................................ 2,766 397 357 - 3,520Derivative income, net .................................... - 3,428 - - 3,428Total operating revenue ............................... 78,510 872,622 357 - 951,489Operating expenses:Lease operating expenses ................................ 19,914 195,105 (16) - 215,003Transportation, processing, and gatheringexpenses .................................................. 12,049 9,733 - - 21,782Production taxes .............................................. 3,330 6,685 - - 10,015Depreciation, depletion, amortization ............. 63,022 281,152 191 - 344,365Accretion expense ........................................... 561 32,513 257 - 33,331Salaries, general and administrative ................ 54,641 7 - - 54,648Incentive compensation expense ..................... 8,113 - - - 8,113Other operational expenses ............................. 173 94 - - 267Total operating expenses .............................. 161,803 525,289 432 - 687,524Income (loss) from operations ...................... (83,293) 347,333 (75) - 263,965Other (income) expenses:Interest expense .............................................. 30,446 (71) - - 30,375Interest income................................................ (285) (315) - - (600)Other income .................................................. (144) (1,661) - - (1,805)Loss on early extinguishment of debt ............. 1,972 - - - 1,972(Income) loss from investment insubsidiaries ............................................ (223,555) 75 - 223,480 -Total other (income) expenses ...................... (191,566) (1,972) - 223,480 29,942Income (loss) before taxes ........................... 108,273 349,305 (75) (223,480) 234,023Provision (benefit) for income taxes:Current ............................................................ 15,022 - - - 15,022Deferred .......................................................... (56,175) 125,750 - - 69,575Total income taxes ........................................ (41,153) 125,750 - - 84,597Net income (loss) .......................................... $149,426 $223,555 ($75) ($223,480) $149,426Comprehensive income (loss) ...................... $156,391 $223,555 ($75) ($223,480) $156,391F-34
CONDENSED CONSOLIDATING STATEMENT OF OPERATIONSYEAR ENDED DECEMBER 31, 2011(In thousands of dollars)ParentGuarantorSubsidiaryNon-GuarantorSubsidiary Eliminations ConsolidatedOperating revenue:Oil production ................................................. $5,675 $658,283 $ - $ - $663,958Gas production ................................................ 19,470 151,141 - - 170,611Natural gas liquids production ........................ - 29,996 - - 29,996Other operational income ................................ 3,085 249 604 - 3,938Derivative income, net .................................... - 1,418 - - 1,418Total operating revenue ............................... 28,230 841,087 604 - 869,921Operating expenses:Lease operating expenses ................................ 6,632 169,018 231 - 175,881Transportation, processing and gatheringexpenses .................................................. - 8,958 - - 8,958Production taxes .............................................. 1,434 7,946 - - 9,380Depreciation, depletion, amortization ............. 17,860 261,326 834 - 280,020Accretion expense ........................................... 15 30,385 364 - 30,764Salaries, general and administrative ................ 40,073 94 2 - 40,169Incentive compensation expense ..................... 11,600 - - - 11,600Other operational expenses ............................. 1,404 745 - - 2,149Total operating expenses .............................. 79,018 478,472 1,431 - 558,921Income (loss) from operations ...................... (50,788) 362,615 (827) - 311,000Other (income) expenses:Interest expense .............................................. 9,043 246 - - 9,289Interest income................................................ (178) (242) - - (420)Other (income) expense, net ........................... (52) (1,890) - - (1,942)Loss on early extinguishment of debt ............. 607 - - - 607(Income) loss from investment insubsidiaries .............................................. (232,751) 827 - 231,924 -Total other (income) expenses ...................... (223,331) (1,059) - 231,924 7,534Income (loss) before taxes ............................ 172,543 363,674 (827) (231,924) 303,466Provision (benefit) for income taxes:Current ............................................................ (20,386) - - - (20,386)Deferred .......................................................... (1,403) 130,923 - - 129,520Total income taxes ........................................ (21,789) 130,923 - - 109,134Net income (loss) .......................................... $194,332 $232,751 ($827) ($231,924) $194,332Comprehensive income (loss) ...................... $230,404 $232,751 ($827) ($231,924) $230,404F-35
CONDENSED CONSOLIDATING STATEMENT OF OPERATIONSYEAR ENDED DECEMBER 31, 2010(In thousands of dollars)ParentGuarantorSubsidiaryNon-GuarantorSubsidiary Eliminations ConsolidatedOperating revenue:Oil production ................................................. $51,357 $366,591 $ - $ - $417,948Gas production ................................................ 61,137 149,549 - - 210,686Natural gas liquids production ........................ - 27,473 - - 27,473Other operational income ................................ 4,831 (54) 1,139 - 5,916Derivative income, net .................................... 3,265 - - - 3,265Total operating revenue ............................... 120,590 543,559 1,139 - 665,288Operating expenses:Lease operating expenses ................................ 64,868 85,344 - - 150,212Transportation, processing and gatheringexpenses .................................................... - 7,218 - - 7,218Production taxes .............................................. 3,631 2,177 - - 5,808Depreciation, depletion, amortization ............. 40,351 206,856 994 - 248,201Accretion expense ........................................... 14,503 19,524 442 - 34,469Salaries, general and administrative ................ 42,741 17 1 - 42,759Incentive compensation expense ..................... 5,888 - - - 5,888Other operational expenses ............................. 2,097 3,482 - - 5,579Total operating expenses .............................. 174,079 324,618 1,437 - 500,134Income (loss) from operations ...................... (53,489) 218,941 (298) - 165,154Other (income) expenses:Interest expense .............................................. 12,192 - - - 12,192Interest income................................................ (1,439) (25) - - (1,464)Other income .................................................. (53) (762) 39 - (776)Other expense ................................................. 601 70 - - 671Loss on early extinguishment of debt ............. 1,820 - - - 1,820(Income) loss from investment in subsidiary .. (140,366) 337 - 140,029 -Total other (income) expenses ...................... (127,245) (380) 39 140,029 12,443Income (loss) before taxes ............................ 73,756 219,321 (337) (140,029) 152,711Provision (benefit) for income taxes:Current ............................................................ 5,896 (88) - - 5,808Deferred .......................................................... (28,569) 79,043 - - 50,474Total income taxes ........................................ (22,673) 78,955 - - 56,282Net income (loss) .......................................... $96,429 $140,366 ($337) ($140,029) $96,429Comprehensive income (loss) ...................... $97,605 $140,366 ($337) ($140,029) $97,605F-36
CONDENSED CONSOLIDATING STATEMENT OF CASH FLOWSYEAR ENDED DECEMBER 31, <strong>2012</strong>(In thousands of dollars)GuarantorSubsidiaryNon-GuarantorSubsidiary Eliminations ConsolidatedParentCash flows from operating activities:Net income (loss).............................................................. $149,426 $223,555 ($75) ($223,480) $149,426Adjustments to reconcile net income (loss) to net cashprovided by operating activities:Depreciation, depletion and amortization ......................... 63,022 281,152 191 - 344,365Accretion expense ............................................................. 561 32,513 257 - 33,331Deferred income tax provision (benefit)........................... (56,175) 125,750 - - 69,575Settlement of asset retirement obligations ........................ - (65,567) - - (65,567)Non-cash stock compensation expense ............................. 8,699 - - - 8,699Excess tax benefits ............................................................ (949) - - - (949)Non-cash derivative income ............................................. - (509) - - (509)Loss on early extinguishment of debt ............................... 1,972 - - - 1,972Non-cash interest expense ................................................ 13,085 - - - 13,085Non-cash (income) loss from investment insubsidiaries ................................................................ (223,555) 75 - 223,480 -Change in current income taxes ....................................... 10,618 - - - 10,618Change in intercompany receivables/payables ................. 275,819 (275,125) (694) - -(Increase) decrease in accounts receivable........................ (22,750) (33,345) 224 - (55,871)Increase in other current assets ......................................... (2,836) - - - (2,836)Decrease in inventory ...................................................... 436 - - - 436Increase (decrease) in accounts payable ........................... 5,348 (208) (39) - 5,101Decrease in other current liabilities ................................. (5,311) (5,115) - - (10,426)Other ................................................................................ 10,960 (1,661) - - 9,299Net cash provided by (used in) operating activities ...... 228,370 281,515 (136) - 509,749Cash flows from investing activities:Investment in oil and gas properties ................................. (324,542) (231,313) - - (555,855)Proceeds from sale of oil and gas properties, net ofexpenses .................................................................... 403 - - - 403Sale of fixed assets ............................................................ 134 - - - 134Investment in fixed and other assets ................................. (13,370) - - - (13,370)Net cash used in investing activities ............................... (337,375) (231,313) - - (568,688)Cash flows from financing activities:Proceeds from bank borrowings ....................................... 25,000 - - - 25,000Repayment of bank borrowings ........................................ (70,000) - - - (70,000)Proceeds from issuance of senior convertible notes .......... 300,000 - - - 300,000Deferred financing costs of senior convertible notes ........ (8,855) - - - (8,855)Proceeds from sold warrants ............................................. 40,170 - - - 40,170Payments for purchased call options ................................. (70,830) - - - (70,830)Proceeds from issuance of senior notes ............................ 300,000 - - - 300,000Deferred financing costs ................................................... (11,966) - - - (11,966)Redemption of senior subordinated notes ......................... (200,681) - - - (200,681)Excess tax benefits ............................................................ 949 - - - 949Net payments for share based compensation .................... (3,773) - - - (3,773)Net cash provided by financing activities ...................... 300,014 - - - 300,014Net change in cash and cash equivalents ....................... 191,009 50,202 (136) - 241,075Cash and cash equivalents, beginning of period ........... 37,389 926 136 - 38,451Cash and cash equivalents, end of period ..................... $228,398 $51,128 $ - $ - $279,526F-37
CONDENSED CONSOLIDATING STATEMENT OF CASH FLOWSYEAR ENDED DECEMBER 31, 2011(In thousands of dollars)GuarantorSubsidiaryNon-GuarantorSubsidiary Eliminations ConsolidatedParentCash flows from operating activities:Net income (loss).............................................................. $194,332 $232,751 ($827) ($231,924) $194,332Adjustments to reconcile net income (loss) to net cashprovided by operating activities:Depreciation, depletion and amortization ......................... 17,860 261,326 834 - 280,020Accretion expense ............................................................. 15 30,385 364 - 30,764Deferred income tax provision (benefit)........................... (1,403) 130,923 - - 129,520Settlement of asset retirement obligations ........................ - (63,391) - - (63,391)Non-cash stock compensation expense ............................. 5,905 - - - 5,905Excess tax benefits ............................................................ (1,493) - - - (1,493)Non-cash derivative income ............................................. - (2,216) - - (2,216)Loss on early extinguishment of debt ............................... 607 - - - 607Non-cash interest expense ................................................ 1,908 - - - 1,908Other non-cash income ..................................................... (1,602) - - - (1,602)Non-cash (income) loss from investment insubsidiaries ................................................................ (230,861) (1,063) - 231,924 -Change in current income taxes ....................................... (19,451) - - - (19,451)Change in intercompany receivables/payables ................. 217,287 (217,724) 437 - -Increase in accounts receivable ......................................... (11,022) (7,688) (890) - (19,600)(Increase) decrease in other current assets ........................ (80) 14 - - (66)Decrease in inventory ...................................................... 1,605 14 - - 1,619Increase in accounts payable ............................................. 2,658 3,341 40 - 6,039Increase in other current liabilities ................................... 23,440 6,143 - - 29,583Other ................................................................................ (1,628) - - - (1,628)Net cash provided by (used in) operating activities ...... 198,077 372,815 (42) - 570,850Cash flows from investing activities:Investment in oil and gas properties ................................. (309,026) (455,903) (4) - (764,933)Proceeds from sale of oil and gas properties, net ofexpenses .................................................................... 5,575 82,355 - - 87,930Investment in fixed and other assets ................................. (2,247) - - - (2,247)Net cash used in investing activities ............................... (305,698) (373,548) (4) - (679,250)Cash flows from financing activities:Proceeds from bank borrowings ....................................... 75,000 - - - 75,000Repayment of bank borrowings ........................................ (30,000) - - - (30,000)Deferred financing costs ................................................... (4,017) - - - (4,017)Excess tax benefits ............................................................ 1,493 - - - 1,493Net payments for share based compensation .................... (2,581) - - - (2,581)Net cash provided by financing activities ...................... 39,895 - - - 39,895Net change in cash and cash equivalents ....................... (67,726) (733) (46) - (68,505)Cash and cash equivalents, beginning of period ........... 105,115 1,659 182 - 106,956Cash and cash equivalents, end of period ..................... $37,389 $926 $136 $ - $38,451F-38
CONDENSED CONSOLIDATING STATEMENT OF CASH FLOWSYEAR ENDED DECEMBER 31, 2010(In thousands of dollars)GuarantorSubsidiaryNon-GuarantorSubsidiary Eliminations ConsolidatedParentCash flows from operating activities:Net income (loss).......................................................... $96,429 $140,366 ($337) ($140,029) $96,429Adjustments to reconcile net income (loss) to netcash provided by operating activities:Depreciation, depletion and amortization ..................... 40,351 206,856 994 - 248,201Accretion expense ......................................................... 14,503 19,524 442 - 34,469Deferred income tax provision (benefit)....................... (28,569) 79,043 - - 50,474Settlement of asset retirement obligations .................... (6,461) (30,440) - - (36,901)Non-cash stock compensation expense ......................... 5,692 - - - 5,692Excess tax benefits ........................................................ (299) - - - (299)Non-cash derivative income ......................................... (324) - - - (324)Loss on early extinguishment of debt ........................... 1,820 - - - 1,820Non-cash interest expense ............................................ 858 - - - 858Other non-cash expense ................................................ 979 - - - 979Non-cash (income) loss from investment insubsidiary .............................................................. (140,366) 337 - 140,029 -Change in current income taxes ................................... (10,783) (88) - - (10,871)Change in intercompany receivable/payables ............... 349,118 (347,941) (1,177) - -(Increase) decrease in accounts receivable.................... (11,556) 61,254 (65) - 49,633Decrease in other current assets .................................... 18 56 - - 74Decrease in inventory .................................................. 1,848 275 - - 2,123Increase (decrease) in accounts payable ....................... (1,045) 272 - - (773)Decrease in other current liabilities ............................. (17,423) (665) - - (18,088)Other expenses ............................................................. 1,230 68 - - 1,298Net cash provided by (used in) operatingactivities ....................................................................... 296,020 128,917 (143) - 424,794Cash flows from investing activities:Investment in oil and gas properties ............................. (265,198) (136,394) (175) - (401,767)Proceeds from sale of oil and gas properties, net ofexpenses ................................................................ 25,455 6,180 - - 31,635Investment in fixed and other assets ............................. (2,949) - - - (2,949)Acquisition of non-controlling interest ......................... - (1,007) - - (1,007)Net cash used in investing activities ........................... (242,692) (131,221) (175) - (374,088)Cash flows from financing activities:Repayment of bank borrowings .................................... (175,000) - - - (175,000)Proceeds from issuance of senior notes ........................ 375,000 - - - 375,000Deferred financing costs ............................................... (11,474) - - - (11,474)Redemption of senior subordinated notes ..................... (200,503) - - - (200,503)Excess tax benefits ........................................................ 299 - - - 299Net payments for share based compensation ................ (1,365) - - - (1,365)Net cash used in financing activities .......................... (13,043) - - - (13,043)Net increase (decrease) in cash and cashequivalents ............................................................ 40,285 (2,304) (318) - 37,663Cash and cash equivalents, beginning of period ....... 64,830 3,963 500 - 69,293Cash and cash equivalents, end of period ................. $105,115 $1,659 $182 $ - $106,956F-39
GLOSSARY OF CERTAIN INDUSTRY TERMSThe following is a description of the meanings of some of the oil and gas industry terms used in this Form 10-K. The revisionsand additions to the definition section in Rule 4-10(a) of Regulation S-X contained in the SEC’s new rule, “Modernization of Oiland Gas <strong>Report</strong>ing”, are included. The definitions of proved developed reserves, proved reserves and proved undevelopedreserves have been abbreviated from the new rule.Bbl. One stock tank barrel, or 42 U.S. gallons of liquid volume, used herein in reference to crude oil or other liquid hydrocarbons.Bcf. One billion cubic feet of gas.Bcfe. One billion cubic feet of gas equivalent. Determined using the ratio of one barrel of crude oil to six mcf of natural gas.Btu. British thermal unit, which is the heat required to raise the temperature of a one-pound mass of water from 58.5 to 59.5degrees Fahrenheit.Development well. A well drilled within the proved area of an oil or gas reservoir to the depth of a stratigraphic horizon known tobe productive.Exploratory well. A well drilled to find a new field or to find a new reservoir in a field previously found to be productive of oil orgas in another reservoir.Field. An area consisting of a single reservoir or multiple reservoirs all grouped on or related to the same individual geologicalstructural feature and/or stratigraphic condition. There may be two or more reservoirs in a field that are separated vertically byintervening impervious, strata, or laterally by local geologic barriers, or by both. Reservoirs that are associated by being inoverlapping or adjacent fields may be treated as a single or common operational field. The geological terms structural feature andstratigraphic condition are intended to identify localized geological features as opposed to the broader terms of basins, trends,provinces, plays, areas-of-interest, etc.Gross acreage or gross wells. The total acres or wells, as the case may be, in which a working interest is owned.Liquidity. The ability to obtain cash quickly either through the conversion of assets or the incurrence of liabilities.MBbls. One thousand barrels of crude oil or other liquid hydrocarbons.Mcf. One thousand cubic feet of gas.Mcfe. One thousand cubic feet of gas equivalent. Determined using the ratio of one barrel of crude oil to six Mcf of natural gas.MMBbls. One million barrels of crude oil or other liquid hydrocarbons.MMBtu. One million Btus.MMcf. One million cubic feet of gas.MMcfe. One million cubic feet of gas equivalent. Determined using the ratio of one barrel of crude oil to six mcf of natural gas.Net acres or net wells. The sum of the fractional working interests owned in gross acres or gross wells expressed as wholenumbers and fractions of whole numbers.Primary term lease. An oil and gas property with no existing production, in which <strong>Stone</strong> has a specific time frame to establishproduction without losing the rights to explore the property.Productive well. A well that is found to be mechanically capable of producing hydrocarbons in sufficient quantities that proceedsfrom the sale of such production exceeds production expenses and taxes.Proved developed reserves. Proved reserves that can be expected to be recovered (i) through existing wells with existingequipment and operating methods or in which the cost of the required equipment is relatively minor compared to the cost of a newG-1
well; and (ii) through installed extraction technology equipment and infrastructure operational at the time of the reserves estimateif the extraction is by means not involving a well.Proved oil and natural gas reserves. Those quantities of oil and gas, which, by analysis of geoscience and engineering data, canbe estimated with reasonable certainty to be economically producible—from a given date forward, from known reservoirs, andunder existing economic conditions, operating methods, and government regulations—prior to the time at which contractsproviding the right to operate expire, unless evidence indicates that renewal is reasonably certain, regardless of whetherdeterministic or probabilistic methods are used for the estimation. The project to extract hydrocarbons must have commenced orthe operator must be reasonably certain that it will commence the project within a reasonable time. Reasonable certainty is definedas “much more likely to be achieved than not”.Proved undeveloped reserves. Proved reserves that are expected to be recovered from new wells on undrilled acreage, or fromexisting wells where a relatively major expenditure is required for recompletion.Standardized measure of discounted future net cash flows. The standardized measure represents value-based information about anenterprise’s proved oil and gas reserves based on estimates of future cash flows, including income taxes, from production ofproved reserves assuming continuation of certain economic and operating conditions. Future cash flows are based on a 12-monthaverage price, calculated as the unweighted arithmetic average of the first-day-of-the-month price for each month within the 12-month period prior to the end of the reporting period.Undeveloped acreage. Lease acreage on which wells have not been drilled or completed to a point that would permit theproduction of economic quantities of oil and gas regardless of whether such acreage contains proved reserves.Working interest. An operating interest that gives the owner the right to drill, produce and conduct operating activities on theproperty and to receive a share of production.G-2
Board of DirectorsLt. Gen. George R.Christmas (Ret.) 2, 3Marine Corps Heritage FoundationFormer President andChief Executive OfficerB. J. Duplantis2, 3, 4Gordon, Arata, McCollam,Duplantis & EaganSenior PartnerPeter D. Kinnear1, 2, 3FMC Technologies, Inc.Former Chairman andChief Executive OfficerJohn P. Laborde 4Tidewater Inc.Retired Chairman EmeritusRobert S. Murley1, 2, 3Credit SuisseVice Chairman – Senior AdvisorRichard A. Pattarozzi 4Shell Oil CompanyFormer Vice PresidentDonald E. Powell 1, 3FDICFormer ChairmanKay G. Priestly1, 3, 4Turquoise Hill ResourcesChief Executive OfficerPhyllis M. Taylor2, 3, 4Taylor <strong>Energy</strong> Company LLCChairman andChief Executive OfficerDavid H. Welch<strong>Stone</strong> <strong>Energy</strong> <strong>Corporation</strong>Chairman, President andChief Executive Officer1 Audit Committee 2 Compensation Committee 3 Nominating and Governance Committee 4 Reserves CommitteeCorporate Information<strong>Stone</strong> <strong>Energy</strong> <strong>Corporation</strong>625 East Kaliste Saloom RoadLafayette, LA 70508(337) 237-0410www.<strong>Stone</strong><strong>Energy</strong>.comHouston Office16800 Greenspoint Park DriveSuite 225 SouthHouston, TX 77060(281) 872-1999Morgantown Office6000 Hampton Drive, Suite B & EMorgantown, WV 26505(304) 225-1600New Orleans Office1100 Poydras Street, Suite 1050New Orleans, LA 70163(504) 593-3600Investor RelationsKenneth H. BeerP.O. Box 52807Lafayette, LA 70505(337) 237-0410CFO@<strong>Stone</strong><strong>Energy</strong>.comNYSE: SGYIndependent AuditorsErnst & Young LLP3900 One Shell Square701 Poydras StreetNew Orleans, LA70139-9869<strong>Annual</strong> MeetingThe company’s <strong>Annual</strong> Meetingof Stockholders will be heldat 10:00 a.m. on May 23, 2013,at the Windsor Court Hotel,New Orleans, LA.Transfer Agent and RegistrarComputershareP.O. Box 43006Providence, RI 02940-3006(877) 878-7534www.computershare.comForm 10-KCopies of the company’s <strong>Annual</strong> <strong>Report</strong>on Form 10-K filed with the Securities andExchange Commission may be obtained uponrequest to Investor Relations or through thecompany’s website at www.<strong>Stone</strong><strong>Energy</strong>.com.Quarterly reports and press release informationalso may be accessed through the website.<strong>Annual</strong> CEO CertificationThe <strong>Annual</strong> CEO Certificationregarding the New York StockExchange’s corporate governancelisting standards required bySection 303A.12(a) of theNew York Stock Exchange ListedCompany Manual was provided to theNew York Stock Exchange onJune 5, <strong>2012</strong>.
<strong>Stone</strong> <strong>Energy</strong> <strong>Corporation</strong>625 East Kaliste Saloom RoadLafayette, LA 70508Phone (337) 237-0410Fax (337) 521-2072www.<strong>Stone</strong><strong>Energy</strong>.com<strong>Stone</strong> <strong>Energy</strong> <strong>Corporation</strong> <strong>2012</strong> <strong>Annual</strong> <strong>Report</strong>Paper contains a minimum of 10% post-consumer fiber