2012 Annual Report - Stone Energy Corporation
2012 Annual Report - Stone Energy Corporation
2012 Annual Report - Stone Energy Corporation
Create successful ePaper yourself
Turn your PDF publications into a flip-book with our unique Google optimized e-Paper software.
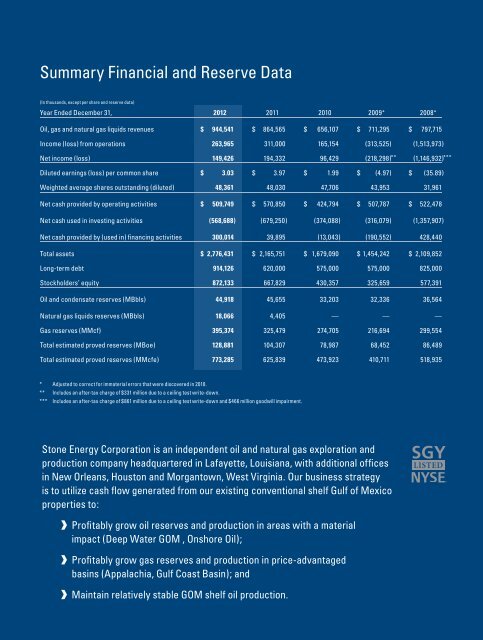
Summary Financial and Reserve Data(In thousands, except per share and reserve data)Year Ended December 31, <strong>2012</strong> 2011 2010 2009* 2008*Oil, gas and natural gas liquids revenues $ 944,541 $ 864,565 $ 656,107 $ 711,295 $ 797,715Income (loss) from operations 263,965 311,000 165,154 (313,525) (1,513,973)Net income (loss) 149,426 194,332 96,429 (218,298) ** (1,146,932) ***Diluted earnings (loss) per common share $ 3.03 $ 3.97 $ 1.99 $ (4.97) $ (35.89)Weighted average shares outstanding (diluted) 48,361 48,030 47,706 43,953 31,961Net cash provided by operating activities $ 509,749 $ 570,850 $ 424,794 $ 507,787 $ 522,478Net cash used in investing activities (568,688) (679,250) (374,088) (316,079) (1,357,907)Net cash provided by (used in) financing activities 300,014 39,895 (13,043) (190,552) 428,440Total assets $ 2,776,431 $ 2,165,751 $ 1,679,090 $ 1,454,242 $ 2,109,852Long-term debt 914,126 620,000 575,000 575,000 825,000Stockholders’ equity 872,133 667,829 430,357 325,659 577,391Oil and condensate reserves (MBbls) 44,918 45,655 33,203 32,336 36,564Natural gas liquids reserves (MBbls) 18,066 4,405 — — —Gas reserves (MMcf) 395,374 325,479 274,705 216,694 299,554Total estimated proved reserves (MBoe) 128,881 104,307 78,987 68,452 86,489Total estimated proved reserves (MMcfe) 773,285 625,839 473,923 410,711 518,935* Adjusted to correct for immaterial errors that were discovered in 2010.** Includes an after-tax charge of $331 million due to a ceiling test write-down.*** Includes an after-tax charge of $861 million due to a ceiling test write-down and $466 million goodwill impairment.<strong>Stone</strong> <strong>Energy</strong> <strong>Corporation</strong> is an independent oil and natural gas exploration andproduction company headquartered in Lafayette, Louisiana, with additional officesin New Orleans, Houston and Morgantown, West Virginia. Our business strategyis to utilize cash flow generated from our existing conventional shelf Gulf of Mexicoproperties to:SGYProfitably grow oil reserves and production in areas with a materialimpact (Deep Water GOM , Onshore Oil);Profitably grow gas reserves and production in price-advantagedbasins (Appalachia, Gulf Coast Basin); andMaintain relatively stable GOM shelf oil production.


