The following narrative provides the reasons for the significant changes in the quantities of our estimated proved reserves byyear.Year Ended December 31, <strong>2012</strong>. Extensions, discoveries and other additions were primarily the result of our Appalachiadrilling program (162 Bcfe) and our deep gas development project at LaCantera (17 Bcfe). Purchase of producing propertiesrelates to our acquisition of an additional interest in the Pompano field.Year Ended December 31, 2011. Extensions, discoveries and other additions were primarily the result of our Appalachiadrilling program (94 Bcfe), our deep gas development project at LaPosada (11 Bcfe) and our GOM drilling program at MississippiCanyon Block 109 (6 Bcfe). Purchase of producing properties primarily relates to our acquisition of the Pompano and Mica fields(102 Bcfe) and our acquisition of an additional 15% working interest in the Pyrenees project (6 Bcfe). Sale of reserves primarilyrelates to the sale of our non-operated interest in the Main Pass Block 296 and 311 fields (13 Bcfe).Year Ended December 31, 2010. Revisions of previous estimates were the result of positive reserve report pricing changesextending the economic limits of reservoirs (28 Bcfe) and well performance (5 Bcfe). Extensions, discoveries and other additionswere primarily the result of our Appalachia drilling program (77 Bcfe) and our GOM drilling program primarily at MississippiCanyon Block 109 (18 Bcfe).The following tables present the standardized measure of discounted future net cash flows related to estimated proved oil,natural gas and NGL reserves together with changes therein, including a reduction for estimated plugging and abandonment coststhat are also reflected as a liability on the balance sheet at December 31, <strong>2012</strong>. You should not assume that the future net cashflows or the discounted future net cash flows, referred to in the tables below, represent the fair value of our estimated oil, naturalgas and NGL reserves. Prices are based on either the preceding 12-months’ average price based on closing prices on the first dayof each month, or prices defined by existing contractual arrangements. The <strong>2012</strong> average 12-month oil and gas prices net ofdifferentials were $101.20 per Bbl of oil, $38.23 per Bbl of NGLs and $2.68 per Mcf of gas. The 2011 average 12-month oil andgas prices net of differentials were $100.97 per Bbl of oil, $58.26 per Bbl of NGLs and $4.74 per Mcf of gas. The 2010 average12-month oil and gas prices net of differentials were $77.68 per Bbl of oil and $4.46 per Mcf of gas. Future production anddevelopment costs are based on current costs with no escalations. Estimated future cash flows net of future income taxes havebeen discounted to their present values based on a 10% annual discount rate.Standardized Measure Year Ended December 31,<strong>2012</strong> 2011 2010Future cash inflows ...................................................................... $6,295,455 $6,171,279 $3,803,004Future production costs................................................................ (1,946,426) (1,747,806) (1,191,718)Future development costs ............................................................ (1,241,531) (1,219,214) (907,956)Future income taxes ..................................................................... (799,007) (852,364) (330,651)Future net cash flows ................................................................... 2,308,491 2,351,895 1,372,67910% annual discount .................................................................... (794,632) (808,933) (415,050)Standardized measure of discounted future net cash flows ......... $1,513,859 $1,542,962 $957,629F-30
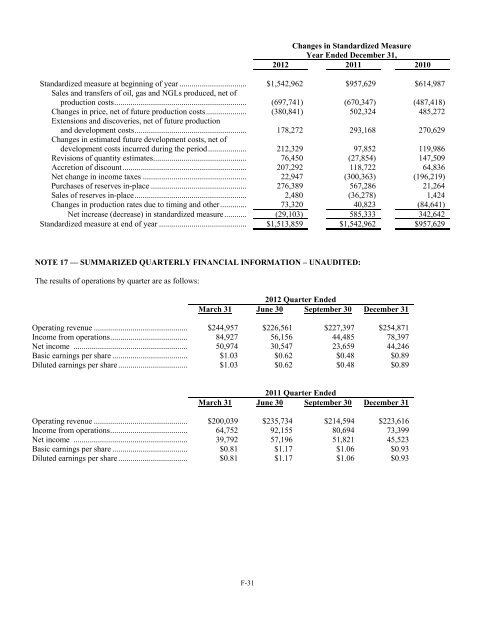
Changes in Standardized MeasureYear Ended December 31,<strong>2012</strong> 2011 2010Standardized measure at beginning of year ................................. $1,542,962 $957,629 $614,987Sales and transfers of oil, gas and NGLs produced, net ofproduction costs ................................................................. (697,741) (670,347) (487,418)Changes in price, net of future production costs .................... (380,841) 502,324 485,272Extensions and discoveries, net of future productionand development costs ....................................................... 178,272 293,168 270,629Changes in estimated future development costs, net ofdevelopment costs incurred during the period ................... 212,329 97,852 119,986Revisions of quantity estimates .............................................. 76,450 (27,854) 147,509Accretion of discount ............................................................. 207,292 118,722 64,836Net change in income taxes ................................................... 22,947 (300,363) (196,219)Purchases of reserves in-place ............................................... 276,389 567,286 21,264Sales of reserves in-place ....................................................... 2,480 (36,278) 1,424Changes in production rates due to timing and other ............. 73,320 40,823 (84,641)Net increase (decrease) in standardized measure ........... (29,103) 585,333 342,642Standardized measure at end of year ........................................... $1,513,859 $1,542,962 $957,629NOTE 17 — SUMMARIZED QUARTERLY FINANCIAL INFORMATION – UNAUDITED:The results of operations by quarter are as follows:<strong>2012</strong> Quarter EndedMarch 31 June 30 September 30 December 31Operating revenue .............................................. $244,957 $226,561 $227,397 $254,871Income from operations ...................................... 84,927 56,156 44,485 78,397Net income ........................................................ 50,974 30,547 23,659 44,246Basic earnings per share ..................................... $1.03 $0.62 $0.48 $0.89Diluted earnings per share .................................. $1.03 $0.62 $0.48 $0.892011 Quarter EndedMarch 31 June 30 September 30 December 31Operating revenue .............................................. $200,039 $235,734 $214,594 $223,616Income from operations ...................................... 64,752 92,155 80,694 73,399Net income ........................................................ 39,792 57,196 51,821 45,523Basic earnings per share ..................................... $0.81 $1.17 $1.06 $0.93Diluted earnings per share .................................. $0.81 $1.17 $1.06 $0.93F-31