2012 Annual Report - Stone Energy Corporation
2012 Annual Report - Stone Energy Corporation
2012 Annual Report - Stone Energy Corporation

Create successful ePaper yourself
Turn your PDF publications into a flip-book with our unique Google optimized e-Paper software.
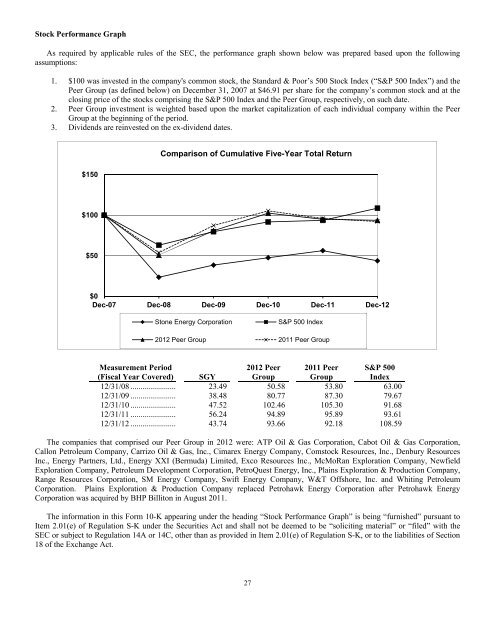
Stock Performance GraphAs required by applicable rules of the SEC, the performance graph shown below was prepared based upon the followingassumptions:1. $100 was invested in the company's common stock, the Standard & Poor’s 500 Stock Index (“S&P 500 Index”) and thePeer Group (as defined below) on December 31, 2007 at $46.91 per share for the company’s common stock and at theclosing price of the stocks comprising the S&P 500 Index and the Peer Group, respectively, on such date.2. Peer Group investment is weighted based upon the market capitalization of each individual company within the PeerGroup at the beginning of the period.3. Dividends are reinvested on the ex-dividend dates.Comparison of Cumulative Five-Year Total Return$150$100$50$0Dec-07 Dec-08 Dec-09 Dec-10 Dec-11 Dec-12<strong>Stone</strong> <strong>Energy</strong> <strong>Corporation</strong>S&P 500 Index<strong>2012</strong> Peer Group 2011 Peer GroupMeasurement Period(Fiscal Year Covered) SGY<strong>2012</strong> PeerGroup2011 PeerGroupS&P 500Index12/31/08 ....................... 23.49 50.58 53.80 63.0012/31/09 ....................... 38.48 80.77 87.30 79.6712/31/10 ....................... 47.52 102.46 105.30 91.6812/31/11 ....................... 56.24 94.89 95.89 93.6112/31/12 ....................... 43.74 93.66 92.18 108.59The companies that comprised our Peer Group in <strong>2012</strong> were: ATP Oil & Gas <strong>Corporation</strong>, Cabot Oil & Gas <strong>Corporation</strong>,Callon Petroleum Company, Carrizo Oil & Gas, Inc., Cimarex <strong>Energy</strong> Company, Comstock Resources, Inc., Denbury ResourcesInc., <strong>Energy</strong> Partners, Ltd., <strong>Energy</strong> XXI (Bermuda) Limited, Exco Resources Inc., McMoRan Exploration Company, NewfieldExploration Company, Petroleum Development <strong>Corporation</strong>, PetroQuest <strong>Energy</strong>, Inc., Plains Exploration & Production Company,Range Resources <strong>Corporation</strong>, SM <strong>Energy</strong> Company, Swift <strong>Energy</strong> Company, W&T Offshore, Inc. and Whiting Petroleum<strong>Corporation</strong>. Plains Exploration & Production Company replaced Petrohawk <strong>Energy</strong> <strong>Corporation</strong> after Petrohawk <strong>Energy</strong><strong>Corporation</strong> was acquired by BHP Billiton in August 2011.The information in this Form 10-K appearing under the heading “Stock Performance Graph” is being “furnished” pursuant toItem 2.01(e) of Regulation S-K under the Securities Act and shall not be deemed to be “soliciting material” or “filed” with theSEC or subject to Regulation 14A or 14C, other than as provided in Item 2.01(e) of Regulation S-K, or to the liabilities of Section18 of the Exchange Act.27