2012 Annual Report - Stone Energy Corporation
2012 Annual Report - Stone Energy Corporation
2012 Annual Report - Stone Energy Corporation

You also want an ePaper? Increase the reach of your titles
YUMPU automatically turns print PDFs into web optimized ePapers that Google loves.
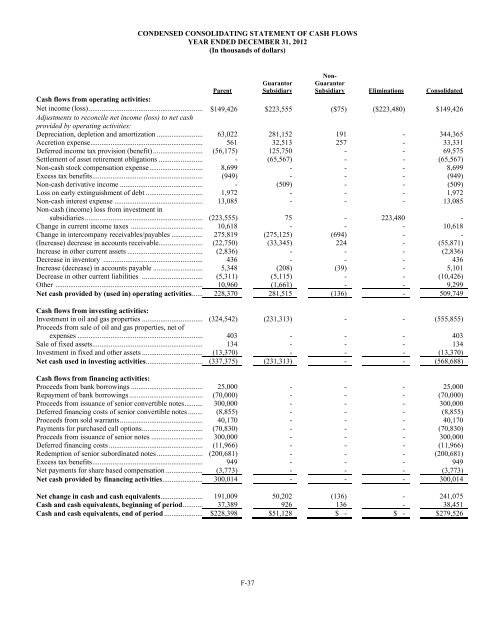
CONDENSED CONSOLIDATING STATEMENT OF CASH FLOWSYEAR ENDED DECEMBER 31, <strong>2012</strong>(In thousands of dollars)GuarantorSubsidiaryNon-GuarantorSubsidiary Eliminations ConsolidatedParentCash flows from operating activities:Net income (loss).............................................................. $149,426 $223,555 ($75) ($223,480) $149,426Adjustments to reconcile net income (loss) to net cashprovided by operating activities:Depreciation, depletion and amortization ......................... 63,022 281,152 191 - 344,365Accretion expense ............................................................. 561 32,513 257 - 33,331Deferred income tax provision (benefit)........................... (56,175) 125,750 - - 69,575Settlement of asset retirement obligations ........................ - (65,567) - - (65,567)Non-cash stock compensation expense ............................. 8,699 - - - 8,699Excess tax benefits ............................................................ (949) - - - (949)Non-cash derivative income ............................................. - (509) - - (509)Loss on early extinguishment of debt ............................... 1,972 - - - 1,972Non-cash interest expense ................................................ 13,085 - - - 13,085Non-cash (income) loss from investment insubsidiaries ................................................................ (223,555) 75 - 223,480 -Change in current income taxes ....................................... 10,618 - - - 10,618Change in intercompany receivables/payables ................. 275,819 (275,125) (694) - -(Increase) decrease in accounts receivable........................ (22,750) (33,345) 224 - (55,871)Increase in other current assets ......................................... (2,836) - - - (2,836)Decrease in inventory ...................................................... 436 - - - 436Increase (decrease) in accounts payable ........................... 5,348 (208) (39) - 5,101Decrease in other current liabilities ................................. (5,311) (5,115) - - (10,426)Other ................................................................................ 10,960 (1,661) - - 9,299Net cash provided by (used in) operating activities ...... 228,370 281,515 (136) - 509,749Cash flows from investing activities:Investment in oil and gas properties ................................. (324,542) (231,313) - - (555,855)Proceeds from sale of oil and gas properties, net ofexpenses .................................................................... 403 - - - 403Sale of fixed assets ............................................................ 134 - - - 134Investment in fixed and other assets ................................. (13,370) - - - (13,370)Net cash used in investing activities ............................... (337,375) (231,313) - - (568,688)Cash flows from financing activities:Proceeds from bank borrowings ....................................... 25,000 - - - 25,000Repayment of bank borrowings ........................................ (70,000) - - - (70,000)Proceeds from issuance of senior convertible notes .......... 300,000 - - - 300,000Deferred financing costs of senior convertible notes ........ (8,855) - - - (8,855)Proceeds from sold warrants ............................................. 40,170 - - - 40,170Payments for purchased call options ................................. (70,830) - - - (70,830)Proceeds from issuance of senior notes ............................ 300,000 - - - 300,000Deferred financing costs ................................................... (11,966) - - - (11,966)Redemption of senior subordinated notes ......................... (200,681) - - - (200,681)Excess tax benefits ............................................................ 949 - - - 949Net payments for share based compensation .................... (3,773) - - - (3,773)Net cash provided by financing activities ...................... 300,014 - - - 300,014Net change in cash and cash equivalents ....................... 191,009 50,202 (136) - 241,075Cash and cash equivalents, beginning of period ........... 37,389 926 136 - 38,451Cash and cash equivalents, end of period ..................... $228,398 $51,128 $ - $ - $279,526F-37