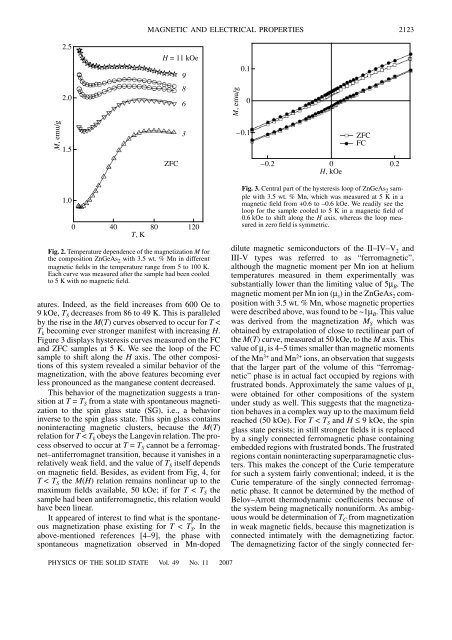
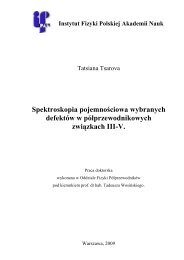
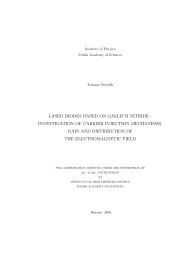
2122KOROLEVA et al.M, emu/g43210M, emu/g1.00.80.60.40.2H = 600 OeZFCFCH = 50 Oe0 50 150 250 350T, K100 200 300 400T, KFig. 1. Temperature dependence <strong>of</strong> <strong>the</strong> magnetization M for<strong>the</strong> composition ZnGeAs 2 with 3.5 wt. % <strong>Mn</strong> in magneticfields <strong>of</strong> 50 kOe <strong>and</strong> 0.6 kOe (inset). The ZFC curve: <strong>the</strong>sample was zero-field-cooled from 400 to 5 K, after whichits magnetization was measured under heating. The FCcurve: <strong>the</strong> sample was cooled in a field <strong>of</strong> 0.6 kOe from 400to 5 K with parallel measurement <strong>of</strong> its magnetization.<strong>and</strong> ZnSnAs 2 : <strong>Mn</strong> [8], compounds with <strong>the</strong> Curie pointas high as 350 K. We reported on <strong>the</strong> compoundCdGeAs 2 : <strong>Mn</strong>, whose Curie temperature T C was stillhigher, 355 K.The II–IV–V 2 ternary semiconductors have beenknown for a long time. These compounds are crystallochemical<strong>and</strong> electronic analogs <strong>of</strong> <strong>the</strong> III–V semiconductors.Interest in <strong>the</strong>se compounds emerged afterone discovered <strong>the</strong>ir unique nonlinear optical properties,namely, <strong>the</strong> high nonlinear polarizability <strong>and</strong> birefringence,which opened a way to <strong>the</strong>ir use for parametricconversion <strong>of</strong> laser radiation in <strong>the</strong> mid-IR range.The most promising for this purpose are high-purityCdGeP 2 , CdGeAs 2 , <strong>and</strong> ZnGeP 2 crystals. The II–IV–V 2 -type compounds retain <strong>the</strong> main features characteristic<strong>of</strong> <strong>the</strong> III-V materials, namely, <strong>the</strong> predominantlycovalent bonding, small effective carrier masses, relativelyhigh mobilities <strong>of</strong> <strong>the</strong> electrons <strong>and</strong> holes, <strong>and</strong>persistence <strong>of</strong> <strong>the</strong> absolute minima <strong>and</strong> maxima <strong>of</strong> <strong>the</strong>conduction <strong>and</strong> <strong>the</strong> valence b<strong>and</strong> at Brillouin zone center.We prepared <strong>and</strong> studied new ZnGeAs 2 : <strong>Mn</strong> compoundswith <strong>the</strong> Curie point reaching 367 K, a recordhighvalue for II–IV–V 2 -type compounds. TheZnGeAs 2 compound studied in <strong>the</strong> present work possesses<strong>the</strong> following characteristics: b<strong>and</strong>gap 0.85 eV;mobility ~10 2 cm 2 /V s (for holes with concentrations <strong>of</strong>10 18 –5 × 10 19 cm –3 ); effective hole mass 0.4–0.74. Thismakes <strong>the</strong> II–IV–V 2 : <strong>Mn</strong> compounds promising forspintronics applications.2. EXPERIMENTAL TECHNIQUEWe report here on a study <strong>of</strong> <strong>the</strong> magnetization,electrical resistivity ρ, magnetoresistance ∆ρ/ρ = (ρ H –ρ H = 0 )/ρ H = 0 <strong>and</strong> <strong>the</strong> Hall effect <strong>of</strong> polycrystallineZnGeAs 2 : <strong>Mn</strong> samples with <strong>Mn</strong> contents <strong>of</strong> 1.5 to3.5 wt. %. The magnetization was measured with aSQUID magnetometer. The four-probe technique wasemployed to measure ρ <strong>and</strong> ∆ρ/ρ. The Hall effect wasstudied by <strong>the</strong> st<strong>and</strong>ard dc method. The contacts to <strong>the</strong>samples were secured with current-conducting glue.3. EXPERIMENTAL RESULTSAND DISCUSSIONThe ZnGeAs 2 samples were prepared by directalloying <strong>of</strong> high-purity powders <strong>of</strong> ZnAs 2 <strong>and</strong> Ge takenin stoichiometric ratio. <strong>Mn</strong> was introduced according to<strong>the</strong> hypo<strong>the</strong>tical ZnGeAs 2 –<strong>Mn</strong>GeAs 2 cut. To increase<strong>the</strong> <strong>Mn</strong> solubility, <strong>the</strong> rate <strong>of</strong> cooling from 900°C waschosen not lower than 5–10 K/s. X-ray diffraction analysisshowed all samples with <strong>the</strong> <strong>Mn</strong> contents <strong>of</strong> 1.5, 3,<strong>and</strong> 3.5 wt. % to be single phase, thus identifying <strong>the</strong>mas ZnGeAs 2 . A comparison <strong>of</strong> <strong>the</strong> lattice constantsrevealed that <strong>the</strong> cell volume decreases with increasing<strong>Mn</strong> content, which suggests formation <strong>of</strong> solid solutionsthrough <strong>Mn</strong> substitution for Zn. The contents <strong>of</strong><strong>the</strong> components were checked by x-ray fluorescence. Astudy <strong>of</strong> <strong>the</strong> distribution <strong>of</strong> elements over <strong>the</strong> samplelength showed that Zn : Ge : As = 1 : 1 : 2. Within experimentalerror, <strong>the</strong> <strong>Mn</strong> was found to be distributed uniformlyover <strong>the</strong> sample length.Figure 1 displays temperature dependence <strong>of</strong> <strong>the</strong>magnetization, M(T), for <strong>the</strong> composition with 3.5 wt.% <strong>Mn</strong> in a magnetic field H = 50 kOe. The M(T) curveobtained for T > 60 K is seen to be characteristic <strong>of</strong> aferromagnet. For T < 60 K, however, magnetization isobserved to grow strongly with decreasing temperature,an effect that can be interpreted as an additional contributiondue to <strong>the</strong> superparamagnetic phase. The inset toFig. 1 shows <strong>the</strong> M(T) plot measured in a weak magneticfield <strong>of</strong> 600 Oe. The M(T) curves obtained in astrong (50 kOe) <strong>and</strong> a weak (0.6 kOe) field are immediatelyseen to differ substantially. When measuring in<strong>the</strong> weak field, <strong>the</strong> magnetization is observed to dropstrongly as <strong>the</strong> temperature falls below T S = 86 K, withM decreasing 4.5 times. At T k = 10 K, this drop stops,<strong>and</strong> here one sees a difference between <strong>the</strong> magnetizations<strong>of</strong> <strong>the</strong> sample cooled from T > T C in this weakmagnetic field (FC curve) <strong>and</strong> <strong>the</strong> one that was zer<strong>of</strong>ieldcooled (ZFC curve) The FC curve exhibits a risewith fur<strong>the</strong>r decrease in <strong>the</strong> temperature. Shown inFig. 2 are M(T) curves in <strong>the</strong> temperature intervalincluding T S , which were measured in magnetic fields<strong>of</strong> 3, 6, 8, 9, <strong>and</strong> 11 kOe. Examining this figure showsthat as H increases, <strong>the</strong> decrease in <strong>the</strong> magnetization atT = T S becomes weaker to disappear altoge<strong>the</strong>r at11 kOe, <strong>and</strong> <strong>the</strong> value <strong>of</strong> T S shifts toward lower temper-PHYSICS OF THE SOLID STATE Vol. 49 No. 11 2007
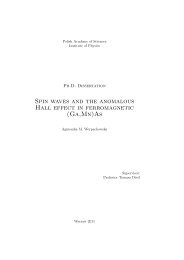
MAGNETIC AND ELECTRICAL PROPERTIES 21232.52.0H = 11 kOe986M, emu/g0.10M, emu/g1.53–0.1ZFCFCZFC–0.2 00.2H, kOe1.00 40 80 120T, KFig. 2. Temperature dependence <strong>of</strong> <strong>the</strong> magnetization M for<strong>the</strong> composition ZnGeAs 2 with 3.5 wt. % <strong>Mn</strong> in differentmagnetic fields in <strong>the</strong> temperature range from 5 to 100 K.Each curve was measured after <strong>the</strong> sample had been cooledto 5 K with no magnetic field.atures. Indeed, as <strong>the</strong> field increases from 600 Oe to9 kOe, T S decreases from 86 to 49 K. This is paralleledby <strong>the</strong> rise in <strong>the</strong> M(T) curves observed to occur for T