’string’,’lin-log’,...’position’,[240,395,40,20],...’callback’,...’semilogy(fdat,pdat);xlabel(X);ylabel(Y);’);loglinBtn = uicontrol(’style’,’pushbutton’,...’string’,’log-lin’,...’position’,[280,395,40,20],...’callback’,...’semilogx(fdat,pdat);xlabel(X);ylabel(Y);’);loglogBtn = uicontrol(’style’,’pushbutton’,...’string’,’log-log’,...’position’,[320,395,40,20],...’callback’,...’loglog(fdat,pdat);xlabel(X);% Create exit pushbutton with red text.ylabel(Y);’);exitBtn = uicontrol(’Style’,’pushbutton’,...’string’,’EXIT’,’position’,[510,395,40,20],...’foregroundcolor’,[1 0 0],’callback’,’close;’); Fig. 13: Graph of “vibration data” from Example25.1% Script file: firstplot.m% Brings template for file selection. Reads% selected filename and path and plots% spectrum in a lin-lin diagram.% Output data are frequency and pressure% amplitude vectors: ’fdat’ and ’pdat’.% Author: U Carlsson, 2001-08-22Executing this GUI from the command line(>> specplot) brings the following screen.Example 25.1 illustrates how the ’callback’ propertyallows the programmer to define what actionsshould result when buttons are pushed etc. Theseactions may consist of single Matlab commands orcomplicated sequences of operations defined in varioussubroutines.function [fdat,pdat] = firstplot% Call Matlab function ’uigetfile’ that% brings file selction template.[filename,pathname] = uigetfile(’*.bin’,...’Select binary data-file:’);% Change directorycd(pathname);% Open file for reading binary floating% point numbers.fid = fopen(filename,’rb’);data = fread(fid,’float32’);% Close filefclose(fid);% Partition data vector in frequency and% pressure vectorspdat = data(2:2:length(data));fdat = data(1:2:length(data));% Plot pressure signal in a lin-lin diagramplot(fdat,pdat);% Define suitable axis labelsxlabel(’Frequency, [Hz]’);ylabel(’Pressure amplitude, [Pa]’);Exercise 25.1 Five di↵erent sound recordings arestored on binary data files, sound1.bin, sound2.bin,..., sound5.bin. Thestorageprecisionis’float32’and the sounds are recorded with sample frequency12000 Hz.Write a graphic user interface that, opens an interfacewindow and• lets the user select one of the five sounds,• plots the selected sound pressure signal as afunction of time in a lin-lin diagram,• lets the user listen to the sound by pushing a’SOUND’ button and finally• closes the session by pressing a ’CLOSE’ button.26 Command SummaryThe command>> helpwill give a list of categories for which help is available(e.g. matlab/general covers the topics listedin Table 3.41
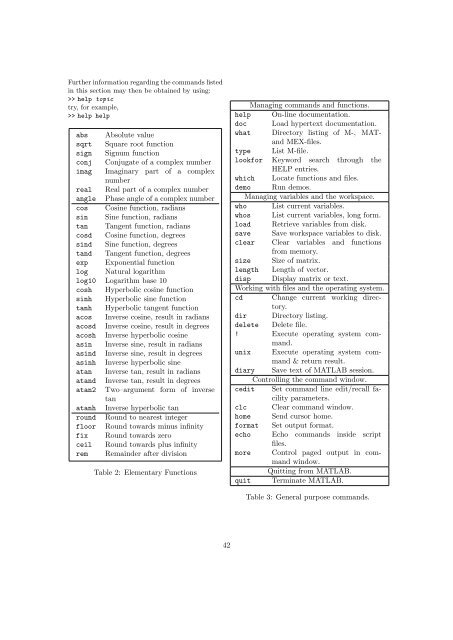
Further information regarding the commands listedin this section may then be obtained by using:>> help topictry, for example,>> help helpabs Absolute valuesqrt Square root functionsign Signum functionconj Conjugate of a complex numberimag Imaginary part of a complexnumberreal Real part of a complex numberangle Phase angle of a complex numbercos Cosine function, radianssin Sine function, radianstan Tangent function, radianscosd Cosine function, degreessind Sine function, degreestand Tangent function, degreesexp Exponential functionlog Natural logarithmlog10 Logarithm base 10cosh Hyperbolic cosine functionsinh Hyperbolic sine functiontanh Hyperbolic tangent functionacos Inverse cosine, result in radiansacosd Inverse cosine, result in degreesacosh Inverse hyperbolic cosineasin Inverse sine, result in radiansasind Inverse sine, result in degreesasinh Inverse hyperbolic sineatan Inverse tan, result in radiansatand Inverse tan, result in degreesatan2 Two–argument form of inversetanatanh Inverse hyperbolic tanround Round to nearest integerfloor Round towards minus infinityfix Round towards zeroceil Round towards plus infinityrem Remainder after divisionTable 2: Elementary FunctionsManaging commands and functions.help On-line documentation.doc Load hypertext documentation.what Directory listing of M-, MATandMEX-files.type List M-file.lookfor Keyword search through theHELP entries.which Locate functions and files.demo Run demos.Managing variables and the workspace.who List current variables.whos List current variables, long form.load Retrieve variables from disk.save Save workspace variables to disk.clear Clear variables and functionsfrom memory.size Size of matrix.length Length of vector.disp Display matrix or text.Working with files and the operating system.cd Change current working directory.dir Directory listing.delete Delete file.! Execute operating system command.unix Execute operating system command& return result.diary Save text of MATLAB session.Controlling the command window.cedit Set command line edit/recall facilityparameters.clc Clear command window.home Send cursor home.format Set output format.echo Echo commands inside scriptfiles.more Control paged output in commandwindow.Quitting from MATLAB.quit Terminate MATLAB.Table 3: General purpose commands.42
- Page 1 and 2: An Introduction to MatlabVersion 3.
- Page 3 and 4: 1 MATLAB• Matlab is an interactiv
- Page 5: These are not allowable:Net-Cost, 2
- Page 8 and 9: Note that the components of x were
- Page 10 and 11: For example, if u = [10, 11, 12], v
- Page 12 and 13: a.*b -24, ans./cans =-18 -10 0 12 2
- Page 14 and 15: Colours Line Styles/symbolsy yellow
- Page 16 and 17: YData: [27 8 1]ZData:[1x0 double]Th
- Page 18 and 19: 14 Elementwise ExamplesExample 14.1
- Page 20 and 21: 0 00 0The second command illustrate
- Page 22 and 23: 9 10 11 1220 0 5 4>> J(1,1)ans =1>>
- Page 24 and 25: 15.12 Sparse MatricesMatlab has pow
- Page 26 and 27: It is well-known that the solution
- Page 28 and 29: the corresponding number, and two f
- Page 30 and 31: -2.0000 3.1416 5.0000-5.0000 -3.000
- Page 32 and 33: if logical test 1Commands to be exe
- Page 34 and 35: 6 8 0 1>> k = find(A==0)k =29Thus,
- Page 36 and 37: function [A] = area2(a,b,c)% Comput
- Page 38 and 39: In order to plot this we have to de
- Page 40 and 41: 100 2256200 4564300 3653400 6798500
- Page 44 and 45: Matrix analysis.cond Matrix conditi
- Page 46 and 47: imag, 42inner product, 8, 21, 22int