2007-2008 - Ports of Auckland
2007-2008 - Ports of Auckland
2007-2008 - Ports of Auckland

You also want an ePaper? Increase the reach of your titles
YUMPU automatically turns print PDFs into web optimized ePapers that Google loves.
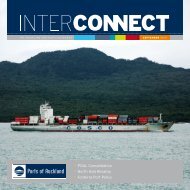
0204060810121416OPERATIONAL HIGHLIGHTS<strong>Ports</strong> <strong>of</strong> <strong>Auckland</strong> Annual Review <strong>2008</strong>CONTAINER THROUGHPUT(TEU, 20 foot equivalent unit)662,170 644,306 686,077 773,160 840,993TRADE BREAKDOWNIN REVIEW• Total container volumes up 8.8%to 840,993 TEU with trans-shipmentvolumes increasing 55.5%• Full import volumes were up 3.0%and full export container volumeswere down 2.7%• Bulk and breakbulk volumesincreased 2.4% (excludes WynyardWharf volumes)*O4 O5 O6 O7 O8Imports 53%Exports 47%• Ship calls numbering 1,738 included70 cruise ship calls• Crane rate (container moves perhour) increased 5.7% alongsideimprovements in ship hours in port, shipturnaround, staff hours per containerand truck turnaround measuresSHIP CALLSCONTAINER cruise ship THROUGHPUTcalls(TUE, 20-foot equivalent unit)VEHICLESPORT (units) OPERATIONS EBIT$'0008501,808301,739301,736491,743491,7387020189,770 201,381 185,159 168,299 173,373750166501255084504350O4 O5 O6 O7 O8O4 O5 O6 O7 O80O4 O5 O6 O7 O8O4 O5 O6 O7 O8BULK AND BREAKBULK CARGO*(million tonnes)CONTAINER THROUGHPUT(TUE, 20-foot equivalent unit)4.6 4.9 4.6 4.1 3.6CONTAINER THROUGHPUT(TUE, 20-foot equivalent unit)200020018001601600140012001000O4 O5 O6 O7 O8O4 O5 O6 O7 O812080400*Graph shows all bulk and breakbulk cargo volume aspreviously reported and including Wynyard Wharfvolumes for the years 2004 to <strong>2007</strong>. Wynyard Wharfvolume is not included in the <strong>2008</strong> volume figurefollowing the transfer <strong>of</strong> the Western Reclamationproperty holding to <strong>Auckland</strong> Regional Holdings as<strong>of</strong> 1 April <strong>2007</strong>.O4 O5 O6 O7 O8