Annual Report 2006 - Munters
Annual Report 2006 - Munters
Annual Report 2006 - Munters

You also want an ePaper? Increase the reach of your titles
YUMPU automatically turns print PDFs into web optimized ePapers that Google loves.
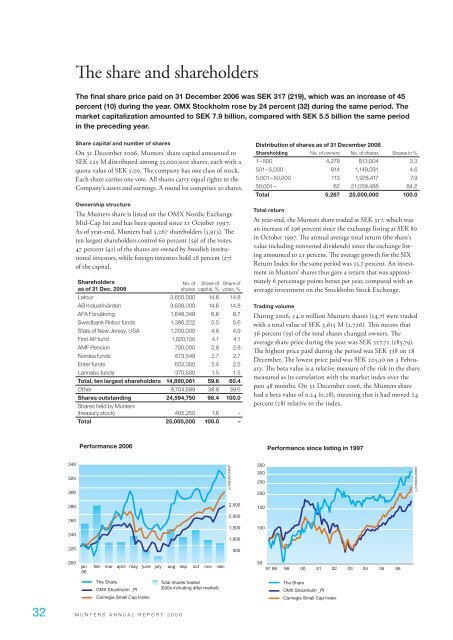
The share and shareholdersThe final share price paid on 31 December <strong>2006</strong> was SEK 317 (219), which was an increase of 45percent (10) during the year. OMX Stockholm rose by 24 percent (32) during the same period. Themarket capitalization amounted to SEK 7.9 billion, compared with SEK 5.5 billion the same periodin the preceding year.Share capital and number of sharesOn 31 December <strong>2006</strong>, <strong>Munters</strong>’ share capital amounted toSEK 125 M distributed among 25,000,000 shares, each with aquota value of SEK 5.00. The company has one class of stock.Each share carries one vote. All shares carry equal rights to theCompany’s assets and earnings. A round lot comprises 50 shares.Ownership structureThe <strong>Munters</strong> share is listed on the OMX Nordic ExchangeMid-Cap list and has been quoted since 21 October 1997.As of year-end, <strong>Munters</strong> had 5,267 shareholders (5,913). Theten largest shareholders control 60 percent (59) of the votes.47 percent (41) of the shares are owned by Swedish institutionalinvestors, while foreign investors hold 28 percent (27)of the capital.Shareholdersas of 31 Dec. <strong>2006</strong>No. ofsharesShare ofcapital, %Share ofvotes, %Latour 3,650,000 14.6 14.8AB Industrivärden 3,638,000 14.6 14.8AFA Försäkring 1,648,340 6.6 6.7Swedbank Robur funds 1,386,222 5.5 5.6State of New Jersey, USA 1,200,000 4.8 4.9First AP fund 1,020,150 4.1 4.1AMF Pension 700,000 2.8 2.8Nordea funds 673,549 2.7 2.7Enter funds 603,300 2.4 2.5Lannebo funds 370,500 1.5 1.5Total, ten largest shareholders 14,890,061 59.6 60.4Other 9,704,689 38.8 39.6Shares outstanding 24,594,750 98.4 100.0Shares held by <strong>Munters</strong>(treasury stock) 405,250 1.6 –Total 25,000,000 100.0 –Distribution of shares as of 31 December <strong>2006</strong>Shareholding No. of owners No. of shares Shares in %1 – 500 4,278 813,004 3.3501 – 5,000 814 1,149,091 4.65,001 – 50,000 113 1,978,417 7.950,001 – 62 21,059,488 84.2Total 5,267 25,000,000 100.0Total returnAt year-end, the <strong>Munters</strong> share traded at SEK 317, which wasan increase of 296 percent since the exchange listing at SEK 80in October 1997. The annual average total return (the share’svalue including reinvested dividends) since the exchange listingamounted to 21 percent. The average growth for the SIXReturn Index for the same period was 15.7 percent. An investmentin <strong>Munters</strong>’ shares thus gave a return that was approximately6 percentage points better per year, compared with anaverage investment on the Stockholm Stock Exchange.Trading volumeDuring <strong>2006</strong>, 14.0 million <strong>Munters</strong> shares (14.7) were tradedwith a total value of SEK 3,615 M (2,726). This means that56 percent (59) of the total shares changed owners. Theaverage share price during the year was SEK 257.71 (185.79).The highest price paid during the period was SEK 338 on 18December. The lowest price paid was SEK 205.50 on 3 February.The beta value is a relative measure of the risk in the sharemeasured as its correlation with the market index over thepast 48 months. On 31 December <strong>2006</strong>, the <strong>Munters</strong> sharehad a beta value of 0.24 (0.28), meaning that it had moved 24percent (28) relative to the index. M U N T E R S A N N U A L R E P O R T 2 0 0 6