Annual Report 2006 - Munters
Annual Report 2006 - Munters
Annual Report 2006 - Munters

Create successful ePaper yourself
Turn your PDF publications into a flip-book with our unique Google optimized e-Paper software.
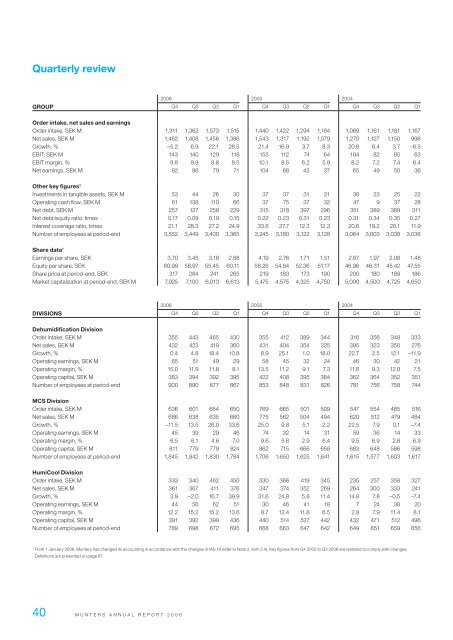
Quarterly review<strong>2006</strong> 2005 2004Group Q4 Q3 Q2 Q1 Q4 Q3 Q2 Q1 Q4 Q3 Q2 Q1Order intake, net sales and earningsOrder intake, SEK M 1,311 1,362 1,573 1,515 1,440 1,422 1,294 1,184 1,089 1,161 1,181 1,167Net sales, SEK M 1,462 1,408 1,456 1,386 1,543 1,317 1,192 1,079 1,270 1,127 1,150 996Growth, % –5.2 6.9 22.1 28.5 21.4 16.9 3.7 8.3 20.8 6.4 3.7 –8.5EBIT, SEK M 143 140 129 118 155 112 74 64 104 82 85 63EBIT margin, % 9.8 9.9 8.8 8.5 10.1 8.5 6.2 5.9 8.2 7.2 7.4 6.4Net earnings, SEK M 92 86 79 71 104 68 43 37 65 49 50 36Other key figures 1Investments in tangible assets, SEK M 53 44 26 30 37 37 31 21 38 23 25 22Operating cash flow, SEK M 61 138 110 66 37 75 37 32 47 9 37 28Net debt, SEK M 257 127 258 229 315 318 397 296 351 389 389 311Net debt/equity ratio, times 0.17 0.09 0.19 0.15 0.22 0.23 0.31 0.23 0.31 0.34 0.35 0.27Interest coverage ratio, times 21.1 28.3 27.2 24.9 33.6 27.7 12.3 12.3 20.6 19.2 20.1 11.9Number of employees at period-end 3,552 3,449 3,400 3,365 3,245 3,180 3,122 3,128 3,064 3,003 3,038 3,036Share data 1Earnings per share, SEK 3.70 3.45 3.18 2.88 4.19 2.76 1.71 1.51 2.67 1.97 2.08 1.48Equity per share, SEK 60.99 58.97 55.45 60.11 58.26 54.84 52.36 51.17 46.96 46.31 45.42 47.55Share price at period-end, SEK 317 284 241 265 219 183 173 190 200 180 189 186Market capitalization at period-end, SEK M 7,925 7,100 6,013 6,613 5,475 4,575 4,325 4,750 5,000 4,500 4,725 4,650<strong>2006</strong> 2005 2004Divisions Q4 Q3 Q2 Q1 Q4 Q3 Q2 Q1 Q4 Q3 Q2 Q1Dehumidification DivisionOrder intake, SEK M 355 443 465 430 355 412 389 344 316 356 348 333Net sales, SEK M 432 423 419 360 431 404 354 325 395 323 350 276Growth, % 0.4 4.8 18.4 10.8 8.9 25.1 1.0 18.0 22.7 2.5 12.1 –11.9Operating earnings, SEK M 65 51 49 29 58 45 32 24 46 30 42 21Operating margin, % 15.0 11.9 11.8 8.1 13.5 11.2 9.1 7.3 11.6 9.3 12.0 7.5Operating capital, SEK M 383 394 392 395 422 408 395 384 362 364 352 351Number of employees at period-end 900 890 877 867 853 848 831 826 781 756 758 744MCS DivisionOrder intake, SEK M 636 601 654 650 769 665 501 509 547 554 485 516Net sales, SEK M 686 638 635 660 775 562 504 494 620 512 479 484Growth, % –11.5 13.5 26.0 33.6 25.0 9.8 5.1 2.2 22.5 7.9 0.1 –7.4Operating earnings, SEK M 45 39 29 46 74 32 14 31 59 36 14 33Operating margin, % 6.5 6.1 4.6 7.0 9.6 5.8 2.9 6.4 9.5 6.9 2.8 6.9Operating capital, SEK M 811 779 779 824 862 715 666 658 683 648 586 598Number of employees at period-end 1,845 1,842 1,830 1,784 1,706 1,650 1,625 1,641 1,615 1,577 1,603 1,617HumiCool DivisionOrder intake, SEK M 333 340 462 450 330 366 419 345 235 257 358 327Net sales, SEK M 361 367 411 376 347 374 352 269 264 300 333 241Growth, % 3.9 –2.0 16.7 39.9 31.6 24.8 5.8 11.4 14.8 7.8 –0.5 –7.4Operating earnings, SEK M 44 56 62 51 30 46 41 18 7 24 38 20Operating margin, % 12.2 15.2 15.2 13.6 8.7 12.4 11.8 6.5 2.8 7.9 11.4 8.1Operating capital, SEK M 391 392 399 436 440 514 527 442 432 471 512 496Number of employees at period-end 789 698 672 695 668 663 647 642 649 651 659 6561From 1 January <strong>2006</strong>, <strong>Munters</strong> has changed its accounting in accordance with the changes in IAS 19 (refer to Note 2, item 2.4). Key figures from Q4 2005 to Q3 <strong>2006</strong> are restated to comply with changes.Definitions are presented on page 67.40 M U N T E R S A N N U A L R E P O R T 2 0 0 6