Annual Report 2006 - Munters
Annual Report 2006 - Munters
Annual Report 2006 - Munters

You also want an ePaper? Increase the reach of your titles
YUMPU automatically turns print PDFs into web optimized ePapers that Google loves.
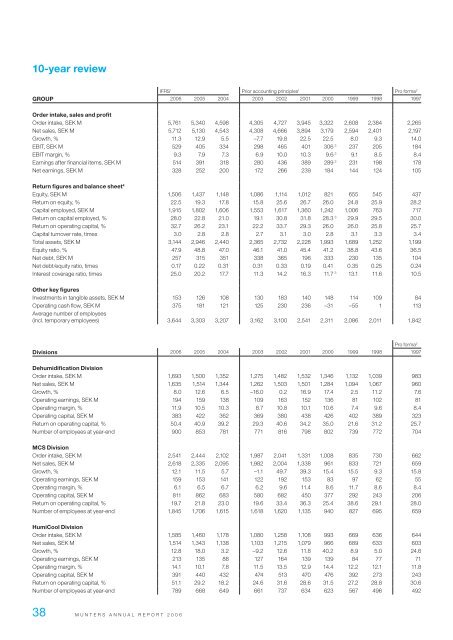
10-year reviewIFRS 1 Prior accounting principles 1 Pro forma 2Group <strong>2006</strong> 2005 2004 2003 2002 2001 2000 1999 1998 1997Order intake, sales and profitOrder intake, SEK M 5,761 5,340 4,598 4,305 4,727 3,945 3,322 2,608 2,384 2,265Net sales, SEK M 5,712 5,130 4,543 4,308 4,666 3,894 3,179 2,594 2,401 2,197Growth, % 11.3 12.9 5.5 –7.7 19.8 22.5 22.5 8.0 9.3 14.0EBIT, SEK M 529 405 334 298 465 401 306 3 237 205 184EBIT margin, % 9.3 7.9 7.3 6.9 10.0 10.3 9.6 3 9.1 8.5 8.4Earnings after financial items, SEK M 514 391 318 280 436 389 289 3 231 198 178Net earnings, SEK M 328 252 200 172 266 239 184 144 124 105Return figures and balance sheet 4Equity, SEK M 1,506 1,437 1,148 1,086 1,114 1,012 821 655 545 437Return on equity, % 22.5 19.3 17.8 15.8 25.6 26.7 26.0 24.8 25.9 28.2Capital employed, SEK M 1,915 1,802 1,606 1,553 1,617 1,360 1,242 1,006 763 717Return on capital employed, % 28.0 22.8 21.0 19.1 30.8 31.8 28.3 3 29.9 29.5 30.0Return on operating capital, % 32.7 26.2 23.1 22.2 33.7 29.3 26.0 26.0 25.8 25.7Capital turnover rate, times 3.0 2.8 2.8 2.7 3.1 3.0 2.8 3.1 3.3 3.4Total assets, SEK M 3,144 2,946 2,440 2,365 2,732 2,228 1,993 1,689 1,252 1,199Equity ratio, % 47.9 48.8 47.0 46.1 41.0 45.4 41.2 38.8 43.6 36.5Net debt, SEK M 257 315 351 338 365 196 333 230 135 104Net debt/equity ratio, times 0.17 0.22 0.31 0.31 0.33 0.19 0.41 0.35 0.25 0.24Interest coverage ratio, times 25.0 20.2 17.7 11.3 14.2 16.3 11.7 3 13.1 11.6 10.5Other key figuresInvestments in tangible assets, SEK M 153 126 108 130 183 140 148 114 109 84Operating cash flow, SEK M 375 181 121 125 230 236 –31 –55 1 113Average number of employees(incl. temporary employees) 3,644 3,303 3,207 3,162 3,100 2,541 2,311 2,086 2,011 1,842Pro forma 2Divisions <strong>2006</strong> 2005 2004 2003 2002 2001 2000 1999 1998 1997Dehumidification DivisionOrder intake, SEK M 1,693 1,500 1,352 1,275 1,482 1,532 1,346 1,132 1,039 983Net sales, SEK M 1,635 1,514 1,344 1,262 1,503 1,501 1,284 1,094 1,067 960Growth, % 8.0 12.6 6.5 –16.0 0.2 16.9 17.4 2.5 11.2 7.6Operating earnings, SEK M 194 159 138 109 163 152 136 81 102 81Operating margin, % 11.9 10.5 10.3 8.7 10.8 10.1 10.6 7.4 9.6 8.4Operating capital, SEK M 383 422 362 369 380 438 426 402 389 323Return on operating capital, % 50.4 40.9 39.2 29.3 40.6 34.2 35.0 21.6 31.2 25.7Number of employees at year-end 900 853 781 771 816 798 802 739 772 704MCS DivisionOrder intake, SEK M 2,541 2,444 2,102 1,987 2,041 1,331 1,008 835 730 662Net sales, SEK M 2,618 2,335 2,095 1,982 2,004 1,338 961 833 721 659Growth, % 12.1 11.5 5.7 –1.1 49.7 39.3 15.4 15.5 9.3 15.8Operating earnings, SEK M 159 153 141 122 192 153 83 97 62 55Operating margin, % 6.1 6.5 6.7 6.2 9.6 11.4 8.6 11.7 8.6 8.4Operating capital, SEK M 811 862 683 580 682 450 377 292 243 206Return on operating capital, % 19.7 21.8 23.0 19.6 33.4 36.3 25.4 38.6 29.1 28.0Number of employees at year-end 1,845 1,706 1,615 1,618 1,620 1,135 940 827 695 659HumiCool DivisionOrder intake, SEK M 1,585 1,460 1,178 1,080 1,258 1,108 993 669 636 644Net sales, SEK M 1,514 1,343 1,138 1,103 1,215 1,079 966 689 633 603Growth, % 12.8 18.0 3.2 –9.2 12.6 11.8 40.2 8.9 5.0 24.6Operating earnings, SEK M 213 135 88 127 164 139 139 84 77 71Operating margin, % 14.1 10.1 7.8 11.5 13.5 12.9 14.4 12.2 12.1 11.8Operating capital, SEK M 391 440 432 474 513 470 476 392 273 243Return on operating capital, % 51.1 29.2 18.2 24.6 31.6 28.6 31.5 27.2 28.8 30.6Number of employees at year-end 789 668 649 661 737 634 623 567 496 49238 M U N T E R S A N N U A L R E P O R T 2 0 0 6