(MGCR-472-061) Practice Problems for Quality - PageOut
(MGCR-472-061) Practice Problems for Quality - PageOut
(MGCR-472-061) Practice Problems for Quality - PageOut

You also want an ePaper? Increase the reach of your titles
YUMPU automatically turns print PDFs into web optimized ePapers that Google loves.
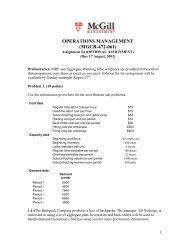
OPERATIONS MANAGEMENT (<strong>MGCR</strong>-<strong>472</strong>-<strong>061</strong>) <strong>Practice</strong>Problem 1.<strong>Problems</strong> <strong>for</strong> <strong>Quality</strong>A grinding and deburring operation is monitored using a mean and a range chart. Sixsamples of 20 observations have been obtained and the sample means and rangescomputed:Problem 2.SAMPLE MEAN RANGE1 3.06 0.422 3.15 0.503 3.11 0.414 3.13 0.465 3.06 0.466 3.09 0.45a) Determine upper and lower control limits <strong>for</strong> the mean and range chartsassuming 3-σ control limits.b) Is the process in control?c) What value of z would give an alpha risk of 3% <strong>for</strong> the process?A restaurant randomly selects 5 samples of french fries each week over a six-week periodin order to determine if the cook is providing equal portions to each customer. The datacollected is shown below:SAMPLE 1 2 3 4 5 61 15 16 12 12 17 122 14 12 18 18 17 143 12 11 15 17 18 184 15 18 12 18 17 165 13 13 17 18 18 15a. Assuming that the standard deviation of the process is 6, what will be the controllimits that would provide an alpha risk of 5% <strong>for</strong> the process?b. Now suppose that the standard deviation of the process is not known. Calculate the3-sigma centerline and the control limits <strong>for</strong> the x and R charts. Does the processappear to be in control? What alpha risk does 2.5-sigma control limits provide?
Problem 3.An Internet service provider is interested in monitoring the length of customer servicecalls. Every week the company randomly samples 5 calls received that week. For eachcall, the length is recorded in minutes:SAMPLE 1 2 3 4 5 MEAN RANGE1 17 22 11 19 14 16.6 112 25 21 20 15 18 19.8 103 19 16 25 10 15 17.0 154 17 25 14 25 21 20.4 115 25 17 25 17 16 20.0 96 17 20 19 22 17 19.0 57 20 11 22 11 25 17.8 148 13 25 19 24 11 18.4 149 22 21 23 11 16 18.6 1210 15 13 19 24 19 18.0 1111 16 13 18 14 25 17.2 1212 17 19 14 19 20 17.8 613 18 18 12 25 24 19.4 1314 19 19 19 24 13 18.8 1115 15 23 19 22 15 18.8 816 10 15 16 15 22 15.6 1217 15 14 18 24 16 17.4 1018 12 14 18 13 16 14.6 619 21 12 11 19 15 15.6 1020 13 23 24 18 18 19.2 11(a)(b)(c)Calculate the control limits <strong>for</strong> the R-chart.Calculate the control limits <strong>for</strong> the x -chart.Does the process appear to be in control? Explain.
Problem 4.Here is an x-bar chart with 20 sample means plotted on it. Use this chart to per<strong>for</strong>m a test<strong>for</strong> runs above and below the centerline.a. What is the expected number of runs?b. What is the standard deviation of the number of runs?c. What is the actual number of runs?d. What is the z-statistic?e. What are the critical values of z <strong>for</strong> 95 percent?f. Is this process under control? Explain,
SOLUTIONSProblem 1.a) X = 3.1, R = 0.45UCL R = D 4 R (n=20) = 1.59*(0.45) = 0.715LCL R = D 3 R (n=20) = 0.41*(0.45) = 0.1845UCL = X + AX2 R = 3.1 + 0.18*(0.45) = 3.181LCL = X - AX2 R = 3.1 - 0.18*(0.45) = 3.019b) It is in control since all means and ranges are within the control limits.c) α = 0.03 ⇒ z[1 – (0.03/2)] = z(0.985) = 2.17.Problem 2.
Problem 3.a) R = 10.55; UCL R = D 4 R (n=5) = 2.11*(10.55) = 22.26LCL R = D 3 R (n=5) = 0.b) X = 18.UCL = X + AX2 R (n=5) = 18 + 0.58*(10.55) = 24,09LCL = X - AX2 R = 18 - 0.58*(10.55) = 11.88c) Both charts seem to be in control.Problem 4.