Transitioning from Logger Pro 2 to Logger Pro 3 - Vernier Software ...
Transitioning from Logger Pro 2 to Logger Pro 3 - Vernier Software ...
Transitioning from Logger Pro 2 to Logger Pro 3 - Vernier Software ...
You also want an ePaper? Increase the reach of your titles
YUMPU automatically turns print PDFs into web optimized ePapers that Google loves.
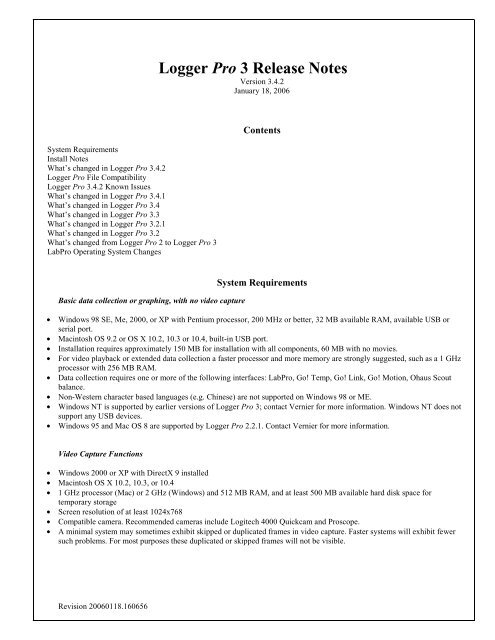
<strong>Logger</strong> <strong>Pro</strong> 3 Release NotesVersion 3.4.2January 18, 2006System RequirementsInstall NotesWhat’s changed in <strong>Logger</strong> <strong>Pro</strong> 3.4.2<strong>Logger</strong> <strong>Pro</strong> File Compatibility<strong>Logger</strong> <strong>Pro</strong> 3.4.2 Known IssuesWhat’s changed in <strong>Logger</strong> <strong>Pro</strong> 3.4.1What’s changed in <strong>Logger</strong> <strong>Pro</strong> 3.4What’s changed in <strong>Logger</strong> <strong>Pro</strong> 3.3What’s changed in <strong>Logger</strong> <strong>Pro</strong> 3.2.1What’s changed in <strong>Logger</strong> <strong>Pro</strong> 3.2What’s changed <strong>from</strong> <strong>Logger</strong> <strong>Pro</strong> 2 <strong>to</strong> <strong>Logger</strong> <strong>Pro</strong> 3Lab<strong>Pro</strong> Operating System ChangesContentsBasic data collection or graphing, with no video captureSystem Requirements• Windows 98 SE, Me, 2000, or XP with Pentium processor, 200 MHz or better, 32 MB available RAM, available USB orserial port.• Macin<strong>to</strong>sh OS 9.2 or OS X 10.2, 10.3 or 10.4, built-in USB port.• Installation requires approximately 150 MB for installation with all components, 60 MB with no movies.• For video playback or extended data collection a faster processor and more memory are strongly suggested, such as a 1 GHzprocessor with 256 MB RAM.• Data collection requires one or more of the following interfaces: Lab<strong>Pro</strong>, Go! Temp, Go! Link, Go! Motion, Ohaus Scoutbalance.• Non-Western character based languages (e.g. Chinese) are not supported on Windows 98 or ME.• Windows NT is supported by earlier versions of <strong>Logger</strong> <strong>Pro</strong> 3; contact <strong>Vernier</strong> for more information. Windows NT does notsupport any USB devices.• Windows 95 and Mac OS 8 are supported by <strong>Logger</strong> <strong>Pro</strong> 2.2.1. Contact <strong>Vernier</strong> for more information.Video Capture Functions• Windows 2000 or XP with DirectX 9 installed• Macin<strong>to</strong>sh OS X 10.2, 10.3, or 10.4• 1 GHz processor (Mac) or 2 GHz (Windows) and 512 MB RAM, and at least 500 MB available hard disk space fortemporary s<strong>to</strong>rage• Screen resolution of at least 1024x768• Compatible camera. Recommended cameras include Logitech 4000 Quickcam and <strong>Pro</strong>scope.• A minimal system may sometimes exhibit skipped or duplicated frames in video capture. Faster systems will exhibit fewersuch problems. For most purposes these duplicated or skipped frames will not be visible.Revision 20060118.160656
Installation Issues and NoteThere is an interaction between the <strong>Logger</strong> <strong>Pro</strong> installer and Texas Instruments TI Connect un-installer.If TI Connect has been installed and subsequently removed, <strong>Logger</strong> <strong>Pro</strong> installer will refuse <strong>to</strong> run. Toinstall <strong>Logger</strong> <strong>Pro</strong>, first reinstall TI Connect 1.3 or newer. You can download an installer <strong>from</strong>http://education.ti.com.<strong>Logger</strong> <strong>Pro</strong> 2, <strong>Logger</strong> Lite, Graphical Analysis, and <strong>Logger</strong> <strong>Pro</strong> 3 can coexist on a single computer.What’s changed in <strong>Logger</strong> <strong>Pro</strong> 3.4.2International<strong>Logger</strong> <strong>Pro</strong> 3.4.2 provides an upgrade path for 3.2.1 international users. International users should examine release note entriesbelow for versions since 3.2.1 <strong>to</strong> gain an understanding of what has changed <strong>from</strong> 3.2.1 <strong>to</strong> 3.4.2.Silent Installation<strong>Logger</strong> <strong>Pro</strong> 3.4.2 provides and allows “silent install” option for system maintainers of a large collection of machines for Englishonly. For more information on the “silent install” option, please contact <strong>Vernier</strong> <strong>Software</strong> & Technology.Issues ResolvedOver 80 issues were addressed by 3.4.2. The following list reflects some of the more notable issues resolved.• Curve fits no longer fail when columns have single Greek character short column names.• The correct curve fit now loads on opening all files saved with curve fits in versions before 3.4. This only affected savedcurve fits after the polynomial fit in the curve fit menu.• Removed a program failure that would occur if the user deleted the base column of a graph and s<strong>to</strong>red the latest run.• Changed the slope calculation <strong>to</strong> correctly account for blank cells.• Text import now works correctly for utf8 text encoding (special characters).• Lab<strong>Pro</strong> OS update no longer causes an intermittent failure.• Curve fits with single-character x-axis labels now correctly use that label.• Fixed program failure on keyboard entry when au<strong>to</strong>matic linear fit helper object is the only object selected.• Graph Options dialog now respects manual scale settings.• Better Lab<strong>Pro</strong> driver install on Windows 2000.• Fixed a Lab<strong>Pro</strong> power saving feature defect that prevented the unit <strong>from</strong> powering down in all situations.• Fixed a Mac OS <strong>Logger</strong><strong>Pro</strong> crash when a default folder name was left empty in the startup file.• Fixed an issue with FFT where removal of one input column accidentally removed the source.• Fixed text edit issues in text boxes where some characters were turned in<strong>to</strong> Greek characters.• Fixed text select and replace cursor placement issues that made certain text manipulations difficult.• Data Delete Column should now ONLY show columns that can be deleted• Corrected a situation that froze <strong>Logger</strong><strong>Pro</strong> 3.4.1 using an analog sensor and a pho<strong>to</strong>gate sensor.• Opening Digital Meter Options dialog no longer intermittently shows “invalid parameter” message.• Fixed intermittent and rare file corruption problems.• Fixed TI Graph Link silver cable problem when upgrading <strong>from</strong> <strong>Logger</strong> <strong>Pro</strong> 3.1.• Non-numeric entries in numeric columns are no longer lost.<strong>Logger</strong> <strong>Pro</strong> File Compatibility<strong>Logger</strong> <strong>Pro</strong> 3.4.2 can open files created in <strong>Logger</strong> <strong>Pro</strong> 3.0, 3.1, 3.2, 3.2.1, 3.3, 3.4 and 3.4.1. <strong>Logger</strong> <strong>Pro</strong> 3.4.2 can also openfiles created in <strong>Logger</strong> Lite (any version) and Graphical Analysis 3.0, 3.1, 3.2, and 3.4.Files created by <strong>Logger</strong> <strong>Pro</strong> 3.4.2 can be opened in version 3.3, but if 3.4-only features are used the file will not be fullyfunctional.Revision 20060118.160656
Files created by <strong>Logger</strong> <strong>Pro</strong> 3.4.2 cannot be opened in <strong>Logger</strong> <strong>Pro</strong> 3.0, 3.1 or 3.2.1. Graphical Analysis cannot open any <strong>Logger</strong><strong>Pro</strong> files.<strong>Logger</strong> <strong>Pro</strong> 3.4.2 Known Issues• Macin<strong>to</strong>sh OS 9: <strong>Logger</strong> <strong>Pro</strong> may not au<strong>to</strong>matically connect <strong>to</strong> Lab<strong>Pro</strong> on launch of application. To connect, use theConnect Interface <strong>from</strong> the Experiment menu.• Special character text support in Windows 98, Me, and OS 9 is limited; not all characters will be displayed.• Macin<strong>to</strong>sh OS 10.2 may not display all subscripts and superscripts using the correct placement.• Help doesn't display correctly in Mac OS 10.4. This is a Mac OS bug; <strong>to</strong> display help properly update <strong>to</strong> 10.4.1 or newer.• In Windows XP SP1, connecting a Go! device that has never been used on that specific computer, while <strong>Logger</strong> <strong>Pro</strong> isrunning, will result in a message <strong>to</strong> reboot the computer. Once that device has been used on a specific machine, the rebootmessage will not reappear. Users can avoid this one-time reboot by connecting the Go! device while <strong>Logger</strong> <strong>Pro</strong> is notrunning. Since each Go! device has a unique serial number, this reboot request can show up unexpectedly if the devices aremoved <strong>from</strong> one computer <strong>to</strong> another.• Meters moni<strong>to</strong>ring Drop Counter sensors will only display the last point taken.• The first Motion Detec<strong>to</strong>r point may be bad if the target is more than 6 meters away.• System response time may increase when collecting a large number of data points• When using a Stainless Steel Temperature <strong>Pro</strong>be remotely, the default calibration will be used. A cus<strong>to</strong>m calibration can beperformed, but will be used only when the collection is done while attached <strong>to</strong> a computer.• Do not connect the USB cable <strong>to</strong> Lab<strong>Pro</strong> until it is powered and has given its startup beeps.• When updating the Lab<strong>Pro</strong> OS on multiple Lab<strong>Pro</strong>s, do not disconnect a Lab<strong>Pro</strong> until after you click OK on the dialog boxannouncing a successful update.• <strong>Logger</strong> <strong>Pro</strong> 3 does not support 640x480 moni<strong>to</strong>rs.• User parameters cannot start with z.• Pho<strong>to</strong>gate data collection can fail in digital events mode with a bad time value. This issue also affects earlier releases, andwill be corrected in a Lab<strong>Pro</strong> firmware update. Contact <strong>Vernier</strong> <strong>Software</strong> & Technology at info@vernier.com for moreinformation.• Files created in <strong>Logger</strong> <strong>Pro</strong> 3.4.2 containing calculated columns with the degree symbol or micro in the column name willnot open correctly in <strong>Logger</strong> <strong>Pro</strong> 3.3. To avoid the problem, remove the degree symbol or micro character while in version3.4.2. Or, in version 3.3, find the ° or µ you see in the column name and remove the Â.• Files created in <strong>Logger</strong> <strong>Pro</strong> 3.3 or earlier containing column names that use the pipe character (|) will not open correctly in<strong>Logger</strong> <strong>Pro</strong> 3.4.2. To resolve this problem, remove the pipe character <strong>from</strong> the column names while using <strong>Logger</strong> <strong>Pro</strong> 3.3 orearlier.• Files created in 3.4.2 that include calculated columns referring <strong>to</strong> a specific data set will not open properly in <strong>Logger</strong> <strong>Pro</strong>3.3.• On Macin<strong>to</strong>sh only, picture analysis may not work if the inserted image is a .pct file. To avoid the problem, convert <strong>to</strong> .jpgin an image editing program.• On Windows systems, <strong>Logger</strong><strong>Pro</strong> files on read-only media (CDs etc) will fail <strong>to</strong> open due <strong>to</strong> a low level Microsoft defect.One can copy such files <strong>to</strong> the system hard drive, make them read-only or writable, and open them in <strong>Logger</strong><strong>Pro</strong>successfully.What’s changed in <strong>Logger</strong> <strong>Pro</strong> 3.4.1Serial Lab<strong>Pro</strong> CommunicationsFixed issue with slow (
Signed DriverLab<strong>Pro</strong> USB driver for Windows XP is now signed by Microsoft. A signed driver can be installed without displaying ahardware wizard or requiring an administra<strong>to</strong>r login. Initial <strong>Logger</strong> <strong>Pro</strong> installation still requires administrative rights, butconnecting a Lab<strong>Pro</strong> <strong>to</strong> a new USB port will no longer require such rights.Support for New Devices• Support added for Go! Motion.• Support added for TI-84 and TI-89 Titanium USB direct cables.• Support for new sensors: Blood Pressure, Charge, Spirometer, and Hand Dynamometer.User Parameters• User parameters allow control of values used in calculations, triggering, and analog output functions.• Control objects for user parameters have been added <strong>to</strong> the Insert menu. Parameter controls are page objects, much like adigital meter, that allow adjustment of parameter values using mouse or cursor keys.Curve Fits and Modeling• Function Plotting. Modeling no longer requires the presence of data <strong>to</strong> draw a function on a graph, so a function may beplotted alone.• Improved modeling (manual curve fits) that can be modified after the fit is drawn on the main graph.• Curve fits now optionally s<strong>to</strong>red as a calculated column of user parameters. Curve fits as parameters allows the fit <strong>to</strong> bemanually adjusted after the fit.Video Features• Video capture <strong>from</strong> many USB camera devices, with au<strong>to</strong>matic insertion of movies in <strong>Logger</strong> <strong>Pro</strong> pages, has been added <strong>to</strong>the Insert menu.• When an experiment file containing inserted videos or pictures is created or saved, the referenced video or picture file iscopied <strong>to</strong> the same file location.• Video capture done with data collection will be inserted and already synchronized, ready for replay.• Video analysis of a still pho<strong>to</strong>.• Rotated coordinate systems for video analysis allows one-dimensional analysis of motion that is neither vertical norhorizontal.• Display of current frame time and frame number in videos.Graph Features• Double Y graphs allow plotting of values with different magnitudes on a single graph, such as pH and temperature vs. time.• Adaptive point protec<strong>to</strong>rs for clearer printing of graphs with multiple traces. Point protec<strong>to</strong>rs are placed sparsely on runs asmarkers.• Better use of color for distinguishing runs. Optionally <strong>Logger</strong> <strong>Pro</strong> will use a single color in each run.• Time of day and Date in Time column and graphs has been added.• Optional rotated horizontal axis labels for graphs.• New option <strong>to</strong> make all rows major tics on graphs. For example, a data table listing twelve month names can be set <strong>to</strong>display all months on the horizontal axis.• Additional control of number displays in data tables and graph labels. User can force scientific notation.Styled TextYou can cus<strong>to</strong>mize the style of the text (including adding Greek characters) as it appears in text boxes, annotations, and graphlabels.Data Collection• Au<strong>to</strong>matic saving of backup data files in case of power loss or crash.• Space bar <strong>to</strong>ggles data collection on and off if the selected page object does not have space as a valid character. Forexample, if a graph is selected, pressing the space bar will start and s<strong>to</strong>p collection, just like the Collect but<strong>to</strong>n. However, ifa text object is selected pressing space will enter a space character. The space bar is a convenient way <strong>to</strong> start datacollection.
• New unit-changing paradigm allows changing units after data collection. Units are no longer tied <strong>to</strong> a particular calibration.New Calculated Column Functions• Event counting with pho<strong>to</strong>gates• Modulo• Boolean functions• Collapse indirect for better display of pho<strong>to</strong>gate data• Blood pressure calculationsImprovements• Support added for QuickTime 7.• Improved speed for all Mac OS versions, especially OS 9. In particular, opening files with many calculated columns, ors<strong>to</strong>ring runs with many calculated columns, is much faster.• Clarified sensor calibration dialog box.• Improved printing of fine graph lines by setting gray grid lines <strong>to</strong> black.• Sounds in videos is now enabled on all platforms.• Improved <strong>to</strong>lerance of videos with uneven time steps, making more videos usable for analysis.• Improved examine mode for video analysis. Video now snaps <strong>to</strong> frame when a marked point is selected.• Improved flexibility in displaying pho<strong>to</strong>gate data without blank cells. The data table can hide rows based on any singlecolumn.• Aspect ratio of inserted videos preserved at file open.• It is now possible <strong>to</strong> collect data more slowly than one point every 4.4 hours when Lab<strong>Pro</strong> is connected <strong>to</strong> the computer.Remote data collection continues <strong>to</strong> have the 4.4-hour upper limit <strong>to</strong> the time between points.What’s changed in <strong>Logger</strong> <strong>Pro</strong> 3.3Support for Multiple Devices<strong>Logger</strong> <strong>Pro</strong> 3.3 supports Lab<strong>Pro</strong>, Go!Temp, Go! Link, and Ohaus Scout <strong>Pro</strong> balances. Up <strong>to</strong> four devices may be usedsimultaneously, with no more than two Lab<strong>Pro</strong>s. On Windows, only one Ohaus scale can be connected by USB. Note: USBdevices connect au<strong>to</strong>matically if detected. Serial Lab<strong>Pro</strong> (and Ohaus on Windows) require manual connection using ConnectInterface <strong>from</strong> the Experiment menu.Icons for On-Line DevicesThe second row in the <strong>to</strong>ol bar now holds icons for each on-line device, followed by any live readouts. These icons are but<strong>to</strong>ns<strong>to</strong> summon the sensor setup dialogs for each device. Off line devices do not appear in the <strong>to</strong>ol bar, but are available in theExperiment menu.Keyboard triggeringKeyboard triggering is a new option that allows you <strong>to</strong> start data collection with minimal delay by pressing the space bar orreturn key on the keyboard. Enable keyboard triggering on the Data Collection dialog, Triggering tab. When keyboardtriggering is active, clicking the Collect but<strong>to</strong>n merely prepares the system for data collection; collection begins at the next pointwhen the space bar is pressed.Au<strong>to</strong>matic Detection of Sensor Configuration<strong>Logger</strong> <strong>Pro</strong> now detects the connection and removal of au<strong>to</strong>-ID sensors whenever live readouts are on and data collection is notactive. When a sensor is added, a column is added <strong>to</strong> the Data Table. When a sensor is removed, its column is removed if thecolumn is empty. To disable this behavior, turn off live readouts in the Experiment menu.Au<strong>to</strong>matic Updating of Page Objects<strong>Logger</strong> <strong>Pro</strong> now au<strong>to</strong>matically adds graphs or connects columns <strong>to</strong> existing graphs when sensors are added. This behaviorsimplifies setup, but it can also disrupt existing page layouts. As a result there are two new options <strong>to</strong> control au<strong>to</strong>matic updatesof page objects. You can separately enable or disable update page objects on File!New (the default is on) and after File !Open (the default is off).
Single-Point CalibrationStandard calibrations require two external references, but some sensors can be calibrated by setting an offset only, such ascorrecting a barometer for altitude. <strong>Logger</strong> <strong>Pro</strong> now allows single-point calibrations for any sensor that can be calibrated usingtwo points.Identify Column Data SourceNow that <strong>Logger</strong> <strong>Pro</strong> collects data <strong>from</strong> multiple devices it can be confusing as <strong>to</strong> where a given column is getting its values.You can now determine the source by device and channel number (eg., Lab<strong>Pro</strong> 2, CH 3) by inspecting the Column Optionsdialog for a given column. In addition, the interface dialogs (Experiments!Set Up Sensors ! Show all Interfaces show thecolumn name where the data <strong>from</strong> each channel is s<strong>to</strong>red, in each sensor's Sensor Info display.Finer Control of Live ReadoutsAll live readouts can still be disabled through the experiment menu but individual columns can be controlled through thecolumn options. This can be very helpful <strong>to</strong> reduce the number of live readouts displayed on the <strong>to</strong>ol bar. You can now turn onlive readouts for the Motion Detec<strong>to</strong>r, although then the detec<strong>to</strong>r will click at all times.Export <strong>to</strong> GIS Format<strong>Logger</strong> <strong>Pro</strong> can export data in a form recognized by GIS software such as ArcView by ESRI.New Page ObjectsThere are three new page objects. The Thermometer resembles a glass thermometer and can be used <strong>to</strong> display sensor readings.The Analog Gauge is a dial readout for sensor readings. The Animated Display is used <strong>to</strong> represent the motion of objects,usually <strong>from</strong> a Motion Detec<strong>to</strong>r column.New Global PreferencesNew preferences have been added. Optionally you can turn on a list of recently used files <strong>to</strong> be displayed in the File menu. Thisfeature lets you quickly return <strong>to</strong> recent work, but some users may want <strong>to</strong> turn off the feature so that students cannot easily findother student work. The default is off. You can turn on large <strong>to</strong>ol bar but<strong>to</strong>ns so that <strong>Logger</strong> <strong>Pro</strong> will look nearly like <strong>Logger</strong>Lite. The default is set for standard <strong>Logger</strong> <strong>Pro</strong> but<strong>to</strong>ns.Supports New SensorsThe new Thermocouple (version shipping after May 2004) is now supportedSensor Confirmation DialogThe Sensor Confirmation dialog opens when you open an experiment file and <strong>Logger</strong> <strong>Pro</strong> does not detect all the necessarysensors. In version 3.2.1 and earlier we assumed that some non-au<strong>to</strong> ID sensors were present. Now we prompt, unless theSensor Confirmation flag is cleared in the setting for that experiment file.The Sensor Confirmation Dialog will disappear when you connect the requested au<strong>to</strong> ID sensors.You can also indicate where any non-au<strong>to</strong> ID sensors are connected and manually close the dialog.<strong>Logger</strong> <strong>Pro</strong> File Compatibility<strong>Logger</strong> <strong>Pro</strong> saves files in the .cmbl file format. <strong>Logger</strong> <strong>Pro</strong> opens .xmbl, .gmbl, and .cmbl files as saved by <strong>Logger</strong> <strong>Pro</strong> version3.0, 3.1, 3.2 and 3.2.1, and <strong>Logger</strong> Lite. <strong>Logger</strong> <strong>Pro</strong> will also open files saved in any version of Graphical Analysis 3 (.ga3extension).Other Changes• Grouped graph behavior links axes and doesn’t group the objects themselves.• Page objects now click <strong>to</strong> the front like windows in Finder and Explorer.• Sensor polling for new au<strong>to</strong> ID sensors is now on whenever live readouts are on.• Option <strong>to</strong> hide helper objects added.• Predictions now take on the units of the graph.• If no interface is connected when <strong>Logger</strong> <strong>Pro</strong> is launched, there is no longer a prompt <strong>to</strong> connect an interface, since <strong>Logger</strong><strong>Pro</strong> is often used for manually entered data.Experiment Files• Experiment files have been updated.
• Experiment files have been added for Workshop Physics and CPU (Constructing Physics Understanding).• Experiment files for Workshop Physics, CPU, Interactive Lecture Demonstrations, Real Time Physics, and Tools forScientific Thinking have been moved <strong>to</strong> a folder titled Additional Physics.Supported Operating SystemsMac OSX 10.3 is now supported.What’s changed in <strong>Logger</strong> <strong>Pro</strong> 3.2.1?EnhancementsSeveral printing issues corrected.Fixed problem with serial connection <strong>to</strong> Lab<strong>Pro</strong> and Events with Entry data collection.Two-Pho<strong>to</strong>gate timing mode corrected.Remote data collection for 12000 points and four sensors now works correctly.Experiment FilesExperiment files have been updated.International<strong>Logger</strong> <strong>Pro</strong> 3.2.1 is more compatible with international options.<strong>Logger</strong> <strong>Pro</strong> File Compatibility<strong>Logger</strong> <strong>Pro</strong> files created in version 3.2 and 3.2.1 cannot be opened in older versions of <strong>Logger</strong> <strong>Pro</strong>.<strong>Logger</strong> <strong>Pro</strong> files created in version 3.0 and 3.1 may be opened in <strong>Logger</strong> <strong>Pro</strong> 3.2 and 3.2.1.What’s changed in <strong>Logger</strong> <strong>Pro</strong> 3.2?Video AnalysisQuantitative position information can be obtained <strong>from</strong> inserted videos. User can set scale, define an origin, and track thepositions of up <strong>to</strong> three objects. Video analysis data may be synchronized with sensor data.Strip ChartsA new strip chart graph type has been added. If the width of a strip chart is less than the data collection time, then the strip chartwill scroll right <strong>to</strong> left as data collection or replay proceeds.Rate FunctionsThe rate functions used for heart rate and respiration rate calculations has been improved <strong>to</strong> use a moving window, allowingmore frequent updates <strong>to</strong> the reported values.TI Connect Compatibility<strong>Logger</strong> <strong>Pro</strong> 3.2 is compatible with TI Connect versions 1.1, 1.2 and 1.3, and will use the installed USB Graph Link driver forcalcula<strong>to</strong>r data import, if one is present.Optional Lab<strong>Pro</strong> OS updateYou have the option <strong>to</strong> update the Lab<strong>Pro</strong> Operating System (OS) <strong>from</strong> 6.26 <strong>to</strong> 6.27 <strong>to</strong> obtain improved Pho<strong>to</strong>gate and remotedata collection behavior. If your Lab<strong>Pro</strong> has an OS older than 6.26, <strong>Logger</strong> <strong>Pro</strong> 3.2 will require an update <strong>to</strong> 6.27.Other changes• New and better sensor select dialog, with groupings of sensors.• Handles 60 samples a minute or hour and other unusual values with better display of time values.• Comma decimal separa<strong>to</strong>r now supported in addition <strong>to</strong> North American standard period decimal separa<strong>to</strong>r.• Additional Tool Tips added.• Extra smart sensors are ignored when opening a file.• Stainless Steel Temperature probe calibration now supported using three reference temperatures.
• Removed extra Motion Detec<strong>to</strong>r calibrations because you are able <strong>to</strong> remove au<strong>to</strong>matically generated calc columns nowand they will not come back.• Data can now start before the movie and still be synced.• Improved Motion Detec<strong>to</strong>r calibrating.• Large number support increased <strong>to</strong> 10 50 .What’s new in <strong>Logger</strong> <strong>Pro</strong> 3.1A major development in <strong>Logger</strong> <strong>Pro</strong> 3 is the addition of all the features of the Graphical Analysis 3 <strong>Pro</strong>gram. Below isan overview of these features.New Feature: Import From TI DeviceYou can use <strong>Logger</strong> <strong>Pro</strong> 3 <strong>to</strong> transfer the data <strong>from</strong> a Texas Instruments graphing calcula<strong>to</strong>r <strong>to</strong> your computer for analysis orprinting. Supported calcula<strong>to</strong>rs are the TI-73, TI-73 Explorer, TI-82, TI-83, TI-83 Plus, TI-83 Plus Silver Edition, TI-84 Plus,TI-84 Plus Silver Edition, TI-85, TI-86, TI-89, TI-92, TI-92 Plus, and Voyage 200. To do this, you need a TI-GRAPH LINKcable, which is part of the TI-GRAPH LINK package and is sold by <strong>Vernier</strong> <strong>Software</strong> & Technology and other TexasInstruments dealers. This cable connects the TI graphing calcula<strong>to</strong>r <strong>to</strong> the serial or USB port of your computer.New Feature: Import From Data <strong>Pro</strong>You can import data <strong>from</strong> a Palm hand held running Data<strong>Pro</strong> in<strong>to</strong> <strong>Logger</strong> <strong>Pro</strong> 3 for analysis or printing by selecting Import<strong>from</strong>…Data<strong>Pro</strong> <strong>from</strong> the File menu. The Palm hot sync feature will also send data <strong>to</strong> <strong>Logger</strong> <strong>Pro</strong>. You will need the Data<strong>Pro</strong>package, which is sold by <strong>Vernier</strong> <strong>Software</strong> & Technology.New Feature: MoviesYou can synchronize data collection and a movie of the experiment so that as you replay the movie, the data are replayed on thegraph. Supported movie formats are Video clip (.avi) and all file formats supported by the QuickTime player. For a completelist of supported formats, visit: apple.com/quicktime/products/qt/specifications.htmlNew Feature: Draw PredictionAdded <strong>to</strong> <strong>Logger</strong> <strong>Pro</strong> 3 is the ability <strong>to</strong> predict what might happen in a given scenario. In certain lab experiments, you mightwant students <strong>to</strong> predict what is going <strong>to</strong> happen before they collect data. When you draw a prediction in <strong>Logger</strong> <strong>Pro</strong> 3 on thegraphs, the prediction will be saved in the data table for comparisons.New Feature: Control DevicesUsing <strong>Logger</strong> <strong>Pro</strong> 3, you can power devices with an output signal <strong>from</strong> the function genera<strong>to</strong>r built in<strong>to</strong> Lab<strong>Pro</strong>. You can alsopower and control devices using the Digital Control Unit.New Feature: Pages<strong>Logger</strong> <strong>Pro</strong> 3 now has pages. This allows you <strong>to</strong> have different layouts of data in a single file. One page might contain a graphand table with five different data collections. Then on different pages you might perform comparisons between differentcollections or just go in<strong>to</strong> each collection in more detail. Each page can almost act as a different file while still sharing datawith all the other pages.New Feature: Insert Additional ObjectsAdded <strong>to</strong> <strong>Logger</strong> <strong>Pro</strong> 3 is the ability <strong>to</strong> add different objects besides the normal table and graph. These include rectangles andovals. You can also add pictures <strong>to</strong> your experiment. Visual aids are especially useful for annotation, documentation, orinstruction for a particular experiment.New Feature: Data BrowserThe Data Browser is a container for all the data in a <strong>Logger</strong> <strong>Pro</strong> file. In contrast, a given data table will not necessarily show alldata columns.
For basic use of <strong>Logger</strong> <strong>Pro</strong>, you will not need <strong>to</strong> use the Data Browser. By default, all new data columns are added <strong>to</strong> all datatables. However, for more complex <strong>Logger</strong> <strong>Pro</strong> sessions, you may find it useful <strong>to</strong> display only a subset of the possible columnsin a particular data table, or you may find it useful <strong>to</strong> not display a data table at all. In these cases, you will use the Data Browser<strong>to</strong> manipulate data columns and data sets.What’s changed <strong>from</strong> <strong>Logger</strong> <strong>Pro</strong> 2 <strong>to</strong> <strong>Logger</strong> <strong>Pro</strong> 3Below are questions you may ask if you are already familiar with older versions of <strong>Logger</strong> <strong>Pro</strong>. Also provided is a list ofimprovements and new features of <strong>Logger</strong> <strong>Pro</strong> 3.Interfaces<strong>Logger</strong> <strong>Pro</strong> 3 supports the <strong>Vernier</strong> Lab<strong>Pro</strong> interface, the <strong>Vernier</strong> Go! Temp, the <strong>Vernier</strong> Go! Link, and the Ohaus Scout <strong>Pro</strong>balance. You can import data <strong>from</strong> text files, Excel files, different TI Graphing Calcula<strong>to</strong>rs using a TI-GRAPH LINK cable, aPalm OS handheld using Data <strong>Pro</strong> and the Lab<strong>Pro</strong>. <strong>Logger</strong> <strong>Pro</strong> 3 will not work with the ULI, Serial Box Interface, or the MPLI.“Lab<strong>Pro</strong>” and “Collect” but<strong>to</strong>nsThe “Collect” but<strong>to</strong>n will no longer disappear when an interface is not connected. Instead there is constant feedback in the upperleft-hand corner of the <strong>to</strong>olbar that tells the user whether or not the Lab<strong>Pro</strong> is connected. The Collect but<strong>to</strong>n will be faded ifLab<strong>Pro</strong> is not connected or recognized.Windows<strong>Logger</strong> <strong>Pro</strong> 3 now uses objects instead of windows. Every table, graph, meter, floating box and other window previouslyavailable in <strong>Logger</strong> <strong>Pro</strong> 2 are now separate objects in <strong>Logger</strong> <strong>Pro</strong> 3. Each object can still be resized and moved. Using thePage menu items, objects can be aligned, layered, grouped, ungrouped, and locked on a page. To insert most objects, just selectthe object you wish <strong>to</strong> add <strong>from</strong> the Insert menu. Floating boxes, now called helper objects, can still be found in the Analyzemenu. Objects also have options, which can be opened by either double clicking on an object or selecting the desired object andchoosing it <strong>from</strong> the Options menu.Data RunsRuns <strong>from</strong> <strong>Logger</strong> <strong>Pro</strong> 2 are now called Data Sets in <strong>Logger</strong> <strong>Pro</strong> 3.Calculated columnsFormula Columns are now called Calculated Columns in <strong>Logger</strong> <strong>Pro</strong> 3. Other than the name change, calculated columns act thesame way as Formula Columns in <strong>Logger</strong> <strong>Pro</strong> 2, with some additional features like error bar calculations.Supported File Formats<strong>Logger</strong> <strong>Pro</strong> 3 can open files in <strong>Logger</strong> <strong>Pro</strong> 3 (.cmbl or .xmbl), <strong>Logger</strong> Lite (.gmbl) or Graphical Analysis 3 (.ga3) formats.The Import Text feature, available <strong>from</strong> the File menu, can import data saved with the Export Text menu item or files createdand saved <strong>from</strong> several other formats (e.g. Excel). The file must be in the tab-delimited text format used by Export Text (a .txt,.TEXT, .dat or .scv extension). Data are imported only in<strong>to</strong> the latest data columns. You can also use this feature <strong>to</strong> import dataprepared or collected in another program in<strong>to</strong> <strong>Logger</strong> <strong>Pro</strong>.Sensor SetupThe Setup menu has been removed. The Sensors <strong>Pro</strong>perties dialog has changed <strong>to</strong> the Sensor dialog, which can be accessedthrough the Experiment menu by choosing Set Up Sensors ! Show All Interfaces <strong>from</strong> the Experiment menu. Each interface(Lab<strong>Pro</strong>, Go!Temp, Go! Link, or Ohaus balance) will have its own Sensor dialog.If you are using an au<strong>to</strong>-ID sensor (such as a Stainless Steel Temperature Sensor or a Motion Detec<strong>to</strong>r), <strong>Logger</strong> <strong>Pro</strong> willidentify your sensor at launch and load a default data collection mode. If your sensor does not au<strong>to</strong>-ID, choose an experimentfile <strong>from</strong> the appropriate sensor folder or open the Sensor Setup dialog <strong>to</strong> manually configure <strong>Logger</strong> <strong>Pro</strong> for you sensor.
Mode and SamplingIn <strong>Logger</strong> <strong>Pro</strong> 3 these two separate pages have been combined in<strong>to</strong> the Data Collection dialog <strong>from</strong> the Experiment menu. Asyou change the mode for the collection, you will notice the options available will also change according <strong>to</strong> your choice. Theseoptions are similar <strong>to</strong> those in <strong>Logger</strong> <strong>Pro</strong> 2.Repeat modeIn <strong>Logger</strong> <strong>Pro</strong> 2 there was a separate Repeat mode for doing a Real Time Collection with repeats. In <strong>Logger</strong> <strong>Pro</strong> 3, Repeat is acheckbox option on the Time Based collection mode page of the Data Collection dialog.Pho<strong>to</strong>gate Timing modesPho<strong>to</strong>gate Timing modes are not available in the Data Collection menu. Click on the Pho<strong>to</strong>gate Channel Box in the SensorSetup window <strong>to</strong> change or select timing modes.<strong>Logger</strong> <strong>Pro</strong> 3 also contains improved, more flexible functions (available in the New Calculated Column dialog <strong>from</strong> the DataMenu) <strong>to</strong> create calculated columns based on Pho<strong>to</strong>gate data.Radiation Moni<strong>to</strong>r setupOnce the Radiation Moni<strong>to</strong>r is set up in the Sensor Setup window, the sensor status will be shown. The reading will be inCounts. The status of the Radiation Moni<strong>to</strong>r is also displayed under the Toolbar. Click on the Radiation Moni<strong>to</strong>r Channel Boxin the Sensor Setup window <strong>to</strong> change or select timing intervals.FFT graph and tableTo insert an FFT graph, just select it <strong>from</strong> the Insert menu under Additional Graphs. In <strong>Logger</strong> <strong>Pro</strong> 3 there is no longer aseparate FFT Table; instead FFT data are placed in the regular data table. The FFT Graph Options dialog is similar <strong>to</strong> the FFTOptions dialog found in <strong>Logger</strong> <strong>Pro</strong> 2 except the two pages, Graph Features and FFT, have been combined in<strong>to</strong> one page foreasier access. FFTs have also been updated <strong>to</strong> allow more than one column <strong>to</strong> be plotted on a single FFT graph.His<strong>to</strong>gram graph and tableTo insert a His<strong>to</strong>gram graph, select His<strong>to</strong>gram <strong>from</strong> the Insert menu under Additional Graphs. In <strong>Logger</strong> <strong>Pro</strong> 3 there is nolonger a separate His<strong>to</strong>gram Table; instead his<strong>to</strong>gram data are placed in the regular data table. The His<strong>to</strong>gram Graph Optionsdialog is similar <strong>to</strong> the His<strong>to</strong>gram Options dialog found in <strong>Logger</strong> <strong>Pro</strong> 2, but the Graph Features page has been renamed <strong>to</strong>Graph Options and the Axis Options page is now the Bin & Count Options page. His<strong>to</strong>grams have also been updated <strong>to</strong> allowmore than one column <strong>to</strong> be plotted on a single His<strong>to</strong>gram graph.Au<strong>to</strong>matic/Manual Curve FitBoth types of curve fits have been merged in<strong>to</strong> a single dialog in <strong>Logger</strong> <strong>Pro</strong> 3. <strong>Logger</strong> <strong>Pro</strong> 3 includes all <strong>Logger</strong> <strong>Pro</strong> 2 curvefit options and many new features. For au<strong>to</strong>matic curve fits, you are now able <strong>to</strong> define your own function for a curve fit. Thepreview window now acts like a normal graph with the ability <strong>to</strong> zoom and au<strong>to</strong>scale. To switch between a manual andau<strong>to</strong>matic curve fit, just click the appropriate radio but<strong>to</strong>n located in the upper right of the dialog under Fit Type. Afterperforming an au<strong>to</strong>matic curve fit, you can switch <strong>to</strong> a manual curve fit <strong>to</strong> get an even better fit if you desire. Sometimes it alsohelps <strong>to</strong> click the Try Fit but<strong>to</strong>n more than once <strong>to</strong> improve an au<strong>to</strong>matic curve fit.Au<strong>to</strong>scale axesThe functionality is now in the Axes Options tab of the Graph Options dialog, which can be called up by selecting GraphOptions <strong>from</strong> the Options menu or by double clicking on the graph. Clicking on the axis labels on the graph may also changethe axes. The scaling options for each axis are now independent of each other.PrintingThere is no longer an option <strong>to</strong> Print Screen. Instead, you can select Print <strong>from</strong> the File menu.
Remote data retrievalRemote data retrieval <strong>from</strong> the Lab<strong>Pro</strong> is now in the Experiment menu. The functionality remains the same except that whenyou setup the Lab<strong>Pro</strong> for remote data, you can now print out your collection settings. Retrieval of data <strong>from</strong> the Lab<strong>Pro</strong> remainsthe same.Calibration FolderThe calibration for sensors has been updated and is now s<strong>to</strong>red in a database, so it's no longer necessary <strong>to</strong> supply a calibrationfolder.Experiment FolderThe experiment folder is now located within the default folder, which can be defined in the Preferences dialog.Over Range Au<strong>to</strong>scale optionThe Over Range Au<strong>to</strong>scale option in the Graph behavior preferences page in the Preferences dialog has been removed. In<strong>Logger</strong> <strong>Pro</strong> 3 you can get the same effect by going <strong>to</strong> the Axes Options, which can be accessed either through the GraphOptions (<strong>from</strong> the Options menu or double clicking on the graph). There are scaling options for each axis, so the au<strong>to</strong>scalingcan be independent of each other.Default Interface<strong>Logger</strong> <strong>Pro</strong> 3 allows the creation of offline interfaces, replacing the single default interface of <strong>Logger</strong> <strong>Pro</strong> 2.Options menuThe Options item found in the Experiment menu in <strong>Logger</strong> <strong>Pro</strong> 2 has moved <strong>to</strong> the File menu and renamed Settings for "thisfile.” You will find all of the experiment options in this dialog except the Enable au<strong>to</strong>matic Curve Fit checkbox, which hasbeen moved <strong>to</strong> the Preferences dialog. This new Settings dialog will save your options for the entire file, even after closing thefile.S<strong>to</strong>re Latest RunTo s<strong>to</strong>re a set of data, choose S<strong>to</strong>re Latest <strong>from</strong> the Experiment Menu.Information about a fileThe About "this file" item in the Help menu has been removed. In <strong>Logger</strong> <strong>Pro</strong> 3 you can place information about a page in thePage Options item in the Page menu. You can set the Page Information text in the Page Options dialog for page 1. You can alsochoose for it <strong>to</strong> be displayed when the page is first viewed, or when the file is opened.Undo functionIn <strong>Logger</strong> <strong>Pro</strong> 2 there was an undo command in the Edit menu. <strong>Logger</strong> <strong>Pro</strong> 3 expands on this command and allows you <strong>to</strong> undoalmost any action that you perform. Collecting data, deleting or inserting an object, or changing the scale of the graph, forexample can all be undone. If you perform <strong>to</strong>o many undos, you now have the option <strong>to</strong> perform a redo that essentially undoesan undo.Text AnnotationText Annotation in <strong>Logger</strong> <strong>Pro</strong> 3 has been updated with many new features. For one, each text annotation can be connected <strong>to</strong> apoint, thus describing information about what is happening <strong>to</strong> the graph at a particular point in time. As the graph is moved, thetext annotation will stay with its point. You can also have more than one text annotation for a single point.Stretchy AxesJust outside the X or Y-axis line, you can use the cursor <strong>to</strong> manually rescale or stretch the axis.Lab<strong>Pro</strong> Operating System Changes 6.26 (required) and 6.27 (optional)<strong>Logger</strong> <strong>Pro</strong> 3 requires at least Lab<strong>Pro</strong> operating system 6.26. If a Lab<strong>Pro</strong> is connected with an earlier version, a dialog box willopen offering <strong>to</strong> update the Lab<strong>Pro</strong>. You must update the Lab<strong>Pro</strong> <strong>to</strong> use it with <strong>Logger</strong> <strong>Pro</strong> 3. Beginning in version 3.2.1,
<strong>Logger</strong> <strong>Pro</strong> will update the Lab<strong>Pro</strong> OS <strong>to</strong> version 6.27. This update is optional, and be applied by connecting a Lab<strong>Pro</strong>, clickingthe Lab<strong>Pro</strong> icon in the <strong>to</strong>olbar, and clicking the Update Lab<strong>Pro</strong> OS but<strong>to</strong>n in the Sensors dialog for that Lab<strong>Pro</strong>.In version 6.26 sensors were allowed <strong>to</strong> warm up after pressing the START/STOP but<strong>to</strong>n. In 6.27 the sensors are warmed up atsetup time. After any warm-up period has elapsed, data collection begins immediately on pressing START/STOP.Version 6.27 updates and fixes:• The build has DataMate 6.15 that includes the TI-73 Application.• Fixed problem where communications were ignored during sensor warm up period.• Fixed problem of pho<strong>to</strong>gate time base and analog time base being out of sync.• Fixed problem of a first point of moni<strong>to</strong>red (not collected) data being max value when using high speed data collection(DataMate),• Fixed problem of corrupted data if pho<strong>to</strong>gate state transitions during start of pendulum experiment• Fixed problem of using two Radiation moni<strong>to</strong>rs at the same time (<strong>Logger</strong> <strong>Pro</strong>)


