Termite Report 2011 - City of Guelph
Termite Report 2011 - City of Guelph
Termite Report 2011 - City of Guelph

Create successful ePaper yourself
Turn your PDF publications into a flip-book with our unique Google optimized e-Paper software.
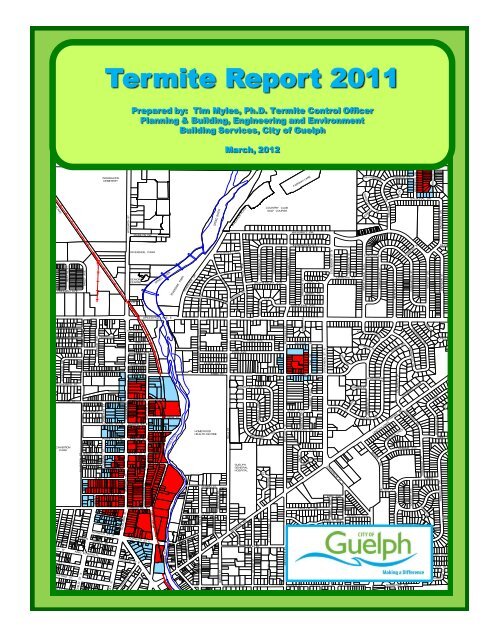
Executive Summary<strong>Guelph</strong>’s <strong>Termite</strong> Management Areas <strong>Guelph</strong> has three termite management areas which have introducedpopulations <strong>of</strong> the eastern subterranean termite. The management areas are divided into red and blue zones.Red zone areas have had known termite infestations while blue zones are buffer areas. Each block is assigned asector number (Figure 1). Approximately 3,100 traps are installed in the red zones and inner blue zones and arechecked on a regular basis from spring through fall.Windermere Area Inactive in <strong>2011</strong> The most encouraging finding in <strong>2011</strong> was the complete inactivity <strong>of</strong> all259 traps in the Windermere management area. Consequently the boundaries <strong>of</strong> that area have been furtherconstricted this year as indicated in Figure 1 for 2012.Pattern <strong>of</strong> Activity in <strong>2011</strong> and Constriction <strong>of</strong> the <strong>Termite</strong> Management Areas The red and blue zonescurrently (2012) encompass 637 properties on portions <strong>of</strong> 38 blocks, down from a maximal extent <strong>of</strong> 869properties on 48 blocks in 2009. See Figure 1 for sector numbers and the current zone designations for specificproperties. New marginal activity was found on one property in Sector 3 and on three properties in Sector 48.However this expansion was <strong>of</strong>fset by continuous inactivity in many peripheral red and blue zone areas, whichhave now been re-designated as follows. Thirty-five red properties were re-designated as blue due to inactivity.Thus there was a net reduction <strong>of</strong> 31 red properties. Another 98 formerly blue properties were removed fromthe termite management area and are now indicated as white areas (Figure 1). With continued management, wemay anticipate continuous annual shrinkage <strong>of</strong> the termite management areas as termite populations aresuppressed and hidden structural infestations are discovered, treated, and eliminated.Second Year <strong>of</strong> Suppression with Zinc Borate <strong>2011</strong> was the second year <strong>of</strong> treatments under the currentexperimental authorization from the Pest Management Regulatory Agency (PMRA) to test zinc borate.Therefore this was the first year for comparing year over year trap yield as a way <strong>of</strong> assessing the efficacy <strong>of</strong> thezinc borate treatments. The total number <strong>of</strong> termites trapped in 2010 was 928,495 compared to 683,793 in <strong>2011</strong>(Figure 2). This represents a 26.4% reduction in the termite population over the previous year. Comparison <strong>of</strong>the first and second halves <strong>of</strong> <strong>2011</strong> suggests an even sharper level <strong>of</strong> decline. The number <strong>of</strong> termites trapped inMay, June, and July was 495,433 compared to 187,201 collected in August, September and October (Figure 3).This represents a within-year decline <strong>of</strong> 62.2%. These measures <strong>of</strong> suppression are also supported by thecontinuous downward trend in the average number <strong>of</strong> termites trapped per inspection (Figure 4).Detection and Treatment <strong>of</strong> Structural Infestations Seven structural (house) infestations were discoveredduring <strong>2011</strong> and structures were rebuilt, renovated, and/or treated. Although this was an increase over the threediscovered in 2010, it was still less than half the number discovered in 2009. The ongoing process <strong>of</strong> discoveryand remediation <strong>of</strong> hidden structural infestations will continue to be an important component <strong>of</strong> the program, assuch infestations are likely to be a critical factor in sustaining the current pattern <strong>of</strong> infestation.<strong>Termite</strong> Habitat Reduction Further progress was made in the removal <strong>of</strong> critical habitat. Thirty-one dead orinfested trees and 34 stumps were identified and removed. This included 20 infested trees, logs, or stumpsremoved from the Grand River Conservation Authority land in sector 21. Two additional trees with superficialactivity were sprayed. 210 borate rods were installed in guard rail posts, fence posts, and retaining walls insectors 2, 7 and 37. A large planter box in sector 47 was found to be infested and was dismantled and removed.Disposal permits were provided to area residents to defray the cost <strong>of</strong> disposing <strong>of</strong> yard wood and demolitiondebris. A total <strong>of</strong> 200 disposal permits were issued in <strong>2011</strong>, up from 156 permits issued in 2010.<strong>Termite</strong> Inspections In <strong>2011</strong>, the number <strong>of</strong> termite inspections for real estate transfers was 41, up from 38 in2010. The number <strong>of</strong> termite inspections related to building permits was 50, over twice the number in 2010,indicating an increase in building activity in the termite management areas.i
TABLE OF CONTENTSEXECUTIVE SUMMARY ..................................................................................................................... iLIST OF TABLES ....................................................................................................................................... ivLIST OF FIGURES ...................................................................................................................................... vLIST OF APPENDICES .............................................................................................................................. viiTABLES ..................................................................................................................................... 1FIGURES ..................................................................................................................................... 9APPENDICES ................................................................................................................................... 38iii
LIST OF TABLESTable 1. Extent <strong>of</strong> <strong>Guelph</strong>’s Three <strong>Termite</strong> Management Areas in 2012. ............................................ 1Table 2. Woolwich <strong>Termite</strong> Management Area for 2012 ..................................................................... 2Table 3. Windermere <strong>Termite</strong> Management Area ................................................................................ 3Table 4. Emma-Pine <strong>Termite</strong> Management Area. ................................................................................ 3Table 5. Summary <strong>of</strong> Property and Trap Activity in Red Zone Blocks (1998-<strong>2011</strong>). ......................... 4Table 6. <strong>Termite</strong>s Trapped per Inspection (2008-<strong>2011</strong>). ...................................................................... 5Table 7. Tree, Stump and Required Wood Removals. .......................................................................... 6Table 8. Impel Borate Rod Installations ............................................................................................... 7Table 9. <strong>Termite</strong> Inspections by Year and Type .................................................................................... 8iv
LIST OF FIGURESFigure 1. New boundaries <strong>of</strong> <strong>Guelph</strong> termite management areas for 2012 ............................................. 9Figure 2. Comparison <strong>of</strong> total termites trapped per sector in 2010 and <strong>2011</strong> ........................................ 10Figure 3. Comparison <strong>of</strong> termites trapped in first and second halves <strong>of</strong> <strong>2011</strong> by sector ....................... 10Figure 4. Average number <strong>of</strong> termites trapped per inspection by sector (2008-2012).......................... 11Figure 5. Areas <strong>of</strong> detected termite activity in the Woolwich management area in <strong>2011</strong> ..................... 12Figure 6. Areas <strong>of</strong> detected termite activity in the Emma-Pine management area in <strong>2011</strong> ................... 13Figure 7. Areas <strong>of</strong> detected termite activity in the Windermere management area in <strong>2011</strong> .................. 14Figure 8. Trap activity in sector 2 in <strong>2011</strong> .............................................................................................. 15Figure 9. Trap activity in sector 3 in <strong>2011</strong> .............................................................................................. 16Figure 10. Trap activity in sector 7 in <strong>2011</strong> ............................................................................................ 17Figure 11. Trap activity in sector 8 in <strong>2011</strong> ............................................................................................ 18Figure 12. Trap activity in sector 10 in <strong>2011</strong> .......................................................................................... 19Figure 13. Trap activity in sector 12 in <strong>2011</strong> .......................................................................................... 20Figure 14. Trap activity in sector 15 in <strong>2011</strong> .......................................................................................... 21Figure 15. Trap activity in sector 16 in <strong>2011</strong> .......................................................................................... 22Figure 16. Trap activity in sector 19 in <strong>2011</strong> .......................................................................................... 23Figure 17. Trap activity in sector 20 in <strong>2011</strong> .......................................................................................... 24Figure 18. Trap activity in sector 21 in <strong>2011</strong> .......................................................................................... 25Figure 19. Trap activity in sector 22 in <strong>2011</strong> .......................................................................................... 26Figure 20. Trap activity in sector 23 in <strong>2011</strong> .......................................................................................... 27Figure 21. Trap activity in sector 24 in <strong>2011</strong> .......................................................................................... 28Figure 22. Trap activity in sector 25 in <strong>2011</strong> .......................................................................................... 29v
Figure 23. Trap activity in sector 27 in <strong>2011</strong> .......................................................................................... 30Figure 24. Trap activity in sector 30 in <strong>2011</strong> .......................................................................................... 31Figure 25. Trap activity in sector 36 in <strong>2011</strong> .......................................................................................... 32Figure 26. Trap activity in sector 37 in <strong>2011</strong> .......................................................................................... 33Figure 27. Trap activity in sector 41 in <strong>2011</strong> .......................................................................................... 34Figure 28. Trap activity in sector 42 in <strong>2011</strong> ....................................................................................... 35Figure 29. Trap activity in sector 47 in <strong>2011</strong> ....................................................................................... 36vi
LIST OF APPENDICESMedia1) March 21, 2012: Gains made in termite war. <strong>Guelph</strong> Mercury, p. A1 ....................................... 371a) March 21, 2012: Biggest surprise in Windermere area. <strong>Guelph</strong> Mercury, p. A5 .................... 37Technical2) Laboratory Evaluation <strong>of</strong> Zinc Borate, Disodium Octaborate ................................................. 383) Laboratory Evaluation <strong>of</strong> Three Species <strong>of</strong> the Bio-control Fungus Metarhizium ................... 404) Laboratory Evaluation <strong>of</strong> Metarhizium flavoviride Conidia in a Dust Dilution Series ............. 435) Laboratory Evaluation <strong>of</strong> Metarhizium flavoviride Conidia .................................................... 466) Laboratory Evaluations <strong>of</strong> N'N-Naphthaloyl Hydroxyl Amine (NHA) .................................. 477) Laboratory Evaluation <strong>of</strong> Lead as a Potential <strong>Termite</strong> Bait Toxicant ..................................... 49vii
Table 1. Extent <strong>of</strong> <strong>Guelph</strong>'s Three <strong>Termite</strong> Management Areas in 2012(Zones, Properties and Blocks)ZonesRed Blue Red + Blue White* Total (R+B+W)Management Areas: zones properties zones properties zones properties zones properties zones properties blocks1) Woolwich Area 20 355 16 201 36 556 21 337 57 893 422) Windermere Area 1 20 3 13 4 33 3 27 7 60 43) Emma - Pine Area 1 22 4 26 5 48 0 0 5 48 4Totals 22 397 23 240 45 637 24 364 69 1001 50* historically included1
Table 2. Woolwich <strong>Termite</strong> Management Area for 2012SectorNumberSector Name(SE corner)SectorTypeNumberPropertiesPropertiesInstalledNumberTrapsInstalledTraps perInstalledProperty000 Verney x Woolwich White 14 0 0 0.000 Earl x Dufferin White 18 0 0 0.00 Earl x GJR White 10 0 0 0.01 Division x Woolwich White 32 0 0 0.01 Division x Woolwich Blue 9 4 12 3.02 Clarence x Dufferin Blue 10 8 24 3.02 Clarence x Dufferin Red 13 13 113 8.73 Clarence x Speed R. Blue 6 1 17 17.03 Clarence x Speed R. Red 1 1 17 17.04 Avondale x Princess White 16 0 0 0.05 Clarke x Princess White 13 0 0 0.06 Clarke x Woowich Blue 26 9 27 3.07 Clarke x Dufferin Red 26 26 227 8.78 George x Speed R. Red 11 11 99 9.09 Powell x Woolwich White 1 0 0 0.09 Powell x Woolwich Blue 21 7 21 3.010 Powell x Dufferin Red 21 21 129 6.111 John x Speed R. Blue 15 15 45 3.012 Pipe x Speed R. Red 13 13 99 8.413 Tiffany x Central White 22 0 0 0.014 Tiffany x Woolwich Blue 22 6 18 3.015 Tiffany x Dufferin Red 15 15 116 7.716 Tiffany x Speed R. Red 13 13 93 7.217 London x Exhibition White 1 0 0 0.018 Cavell x Central White 20 0 0 0.019 Extra x Woolwich Blue 7 7 42 6.019 Extra x Woolwich Red 12 12 51 4.320 Kerr x Dufferin Red 15 14 84 6.021 Marcon x Speed R. Red 10 10 79 7.922 Mont x Woolwich White 17 17 59 3.522 Mont x Woolwich Blue 8 8 27 3.422 Mont x Woolwich Red 13 12 51 4.323 London x Dufferin Red 43 42 214 5.124 London x Cardigan Red 35 35 190 5.425 McTague x Woolwich Blue 5 5 19 3.825 McTague x Woolwich Red 35 35 174 5.026 London x Dublin Blue 7 0 0 0.027 London x Woolwich Red 28 26 121 4.728 Suffolk x Park White 32 0 0 0.029 K. Edwd x Dublin White 43 0 0 0.030 Edwin x Woolwich Blue 4 4 21 5.330 Edwin x Woolwich Red 15 15 69 4.631 Charles x Woolwich Blue 25 9 27 3.032 Norwich x Norfolk White 7 0 0 0.032 Norwich x Norfolk Blue 18 6 18 3.033 Green x Norfolk White 19 0 0 0.034 Green x Woolwich White 26 0 0 0.035 Liverpool x Norwich White 22 0 0 0.036 Norwich x Speed R. Red 10 9 80 8.937 Norwich x Cardigan Red 25 25 211 8.438 Suffolk x Woolwich White 12 0 0 0.039 Yarmouth x Norwich White 18 0 0 0.040 Woolwich x Cardigan Blue 17 8 24 3.040 Woolwich x Cardigan White 4 0 0 0.041 Eramosa x Speed R. Red 1 1 6 6.041 Eramosa x Speed R. Blue 1 0 0 0.0Red 355 349 2223 6.4SubtotalsBlue 201 97 342 3.5TOTALSWhite 323 0 0 0.0R+B+W 879 446 2565 5.8R+B 556 446 2565 5.82
Table 3. Windermere <strong>Termite</strong> Management AreaSectorNumberSector NameSectorTypeNumberPropertiesPropertiesInstalledNumberTrapsInstalledTrapsperInstalledProperty42Balmoral xWindermere Red 20 20 142 7.142Balmoral xWindermere Blue 6 6 36 6.042Balmoral xWindermere White* 16 16 32 2.043 Windsor x Inverness Blue 2 2 6 3.044 Balmoral x Inverness Blue 5 5 15 3.044 Balmoral x Inverness White* 1 1 3 3.045 Balmoral x Balmoral White* 8 8 18 2.346 Balmoral x Victoria White* 2 2 7 3.5Subtotals Red 20 20 142 7.1Blue 13 13 57 4.4White* 27 27 60 2.2TOTALS R+B+W 60 60 259*Some traps removed in <strong>2011</strong>, remainder to be removed in 2012.Table 4. Emma - Pine <strong>Termite</strong> Management AreaSectorNumberSector NameSectorTypeNumberPropertiesPropertiesInstalledNumberTrapsInstalledTraps/InstalledProperty47 Emma x Pine Red 22 22 222 10.148 Metcalfe x Balsam Blue 3 4 15 3.849 Emma (south side) Blue 8 8 24 3.050 Pine (east side) Blue 8 8 24 3.051 Emma X Metcalfe Blue 7 4 15 3.8SubtotalsRed 22 22 201 9.1Blue 26 24 78 3.3TOTALS R + B 49 46 3003
Table 6. <strong>Termite</strong>s Trapped Per Inspection (2008-<strong>2011</strong>).Sector2008 2009 2010total inspections per insp. total inspections per insp. total inspections per insp. total inspections per insp.2 100,316 7 14,331 43,297 7 6,185 117,978 17 6,940 73,536 16 4,5963 - - - - - - - - - 2,864 8 3587 307,782 9 34,198 246,585 8 30,823 389,776 18 21,654 298,183 19 15,6948 37,295 7 5,328 13,120 7 1,874 33,383 14 2,385 10,596 14 75710 0 1 0 1,133 3 378 13,293 9 1,477 15,275 14 1,09112 279 3 93 11,923 5 2,385 8,485 7 1,212 50 7 715 16,753 7 2,393 16,221 6 2,704 32,430 8 4,054 29,633 16 1,85216 23,061 6 3,844 5,573 6 929 32,369 9 3,597 19,626 9 2,18119 0 5 0 0 5 0 0 4 0 0 4 020 26,610 7 3,801 31,406 5 6,281 70,521 10 7,052 34,978 11 3,18021 1,603 6 267 0 5 0 25 7 4 434 7 6222 0 6 0 0 5 0 0 5 0 0 5 023 15,742 8 1,968 4,231 4 1,058 1,241 6 207 4,131 8 51624 0 5 0 1,245 5 249 2,375 6 396 9,487 12 79125 3,985 7 569 3,934 5 787 0 5 0 0 7 027 0 6 0 0 5 0 0 4 0 0 5 030 0 8 0 395 5 79 1,042 5 208 2 8 036 3,542 7 506 3,513 5 703 0 5 0 4,151 8 51937 6,590 6 1,098 4,521 5 904 10,121 7 1,446 22,473 18 1,24941 0 5 0 0 5 0 0 4 0 0 5 042 1,520 7 217 1,693 5 339 741 7 106 0 6 047 160,183 8 20,023 101,020 7 14,431 215,556 16 13,472 156,801 20 7,840<strong>2011</strong>5
Table 7. Tree, Stump or Required Wood RemovalsNo. Sector Address Material1 3 32 Clarence old utility pole & wood debris2 7 457 Woolwich St. 6 stumps & 1 tree3 7 23 Clarence brush pile4 7 162 Dufferin boards & brush5 7 160 Dufferin infested tree6 7 156 Dufferin infested debris & yard wood7 7 166 Dufferin infested demolition debris8 7 adjacent to 166 Duff. upper portions <strong>of</strong> 3 large trees9 7 20 Clarke St infested demolition debris10 7 467 Woolwich infested tree11 7 471 Woolwich boards & wood debris12 7 471 Woolwich old xmas tree13 7 483 Woolwich construction debris14 8 167 Dufferin 6 stumps15 8 adjacent to 167 Duff. wood debris & 5 stumps16 8 behind 167 Duff. dead tree and wood pile17 10 439 Woolwich stump18 10 423 Woolwich retaining wall19 10 128 Dufferin building debris20 10 132 Dufferin stumps21 12 15 John St. wood pile & debris22 14 400 Woolwich St. dead spruce tree23 15 116 Dufferin St. stumps, debris, planters24 16 115 Dufferin infested tree25 19 380 Woolwich St. red wood chip mulch26 19 392 Woolwich St. brown wood chip mulch27 20 22 Kerr St. stump28 21 Marcon X Cardigan 20 trees & stumps29 23 367 Woolwich St. black wood chip mulch30 23 64 Dufferin wood post retaining wall31 23 16 Dufferin tree & debris32 24 77 Dufferin stump33 24 next to 140 Cardigan infested stump34 25 340 Woolwich St. 3 stumps35 25 332 Woolwich woody debris pile36 27 312 Woolwich St. red wood chip mulch37 27 22 McTague stump38 30 14 London Rd. W planter, stump, and boards39 30 16 Londaon Rd. W stump40 37 239 Woolwich St. guard rail posts & planters41 37 265 Woolwich infested fence post42 37 60 Cardigan infested baseboards43 47 263 Metcalfe wood planter/edging boards44 47 271 Metcalfe 3 stumps & 5 planters45 47 126 Emma St. 3 dead trees & wood pile46 47 265 Metcalfe infested boards6
Table 8. Impel Borate Rod Installations in <strong>2011</strong>No. Sector Address No. Rods Installed1 2 Spurline Park 202 3 32 Clarence 103 7 guard rail posts 404 7 473 Woolwich 1005 30 14 London Rd. W. 206 37 62 Cardigan 20Total2107
Figure 4. Average number <strong>of</strong> termites trapped per inspection by sector (2008-<strong>2011</strong>).11
Figure 5. Areas <strong>of</strong> detected termite activity in the Woolwich management area in <strong>2011</strong>.12
Figure 6. Areas <strong>of</strong> detected termite activity in the Emma-Pine management area in <strong>2011</strong>.13
Figure 7. Areas <strong>of</strong> detected termite activity in the Windermere management area in <strong>2011</strong>.14
Figure 8. Trap activity in sector 2 in <strong>2011</strong>.15
Figure 9. Trap activity in sector 3 in <strong>2011</strong>.16
Figure 10. Trap activity in sector 7 in <strong>2011</strong>.17
Figure 11. Trap activity in sector 8 in <strong>2011</strong>.18
Figure 12. Trap activity in sector 10 in <strong>2011</strong>.19
Figure 13. Trap activity in sector 12 in <strong>2011</strong>.20
Figure 14. Trap activity in sector 15 in <strong>2011</strong>.21
Figure 15. Trap activity in sector 16 in <strong>2011</strong>.22
termite trapactive trapactive trap used as release porttermite activity observed outside trapestimated termite foraging territoryFigure 16. Trap activity in sector 19 in <strong>2011</strong>.23
Figure 17. Trap activity in sector 20 in <strong>2011</strong>.24
Figure 18. Trap activity in sector 21 in <strong>2011</strong>.25
Figure 19. Trap activity in sector 22 in <strong>2011</strong>.26
Figure 20. Trap activity in sector 23 in <strong>2011</strong>.27
Figure 21. Trap activity in sector 24 in <strong>2011</strong>.28
Figure 22. Trap activity in sector 25 in <strong>2011</strong>.29
Figure 23. Trap activity in sector 27 in <strong>2011</strong>.30
Figure 24. Trap activity in sector 30 in <strong>2011</strong>.31
Figure 25. Trap activity in sector 36 in <strong>2011</strong>.32
Figure 26. Trap activity in sector 37 in <strong>2011</strong>.33
termite trapactive trapactive trap used as release porttermite activity observed outside trapestimated termite foraging territoryFigure 27. Trap activity in sector 41 in <strong>2011</strong>.34
Figure 28. Trap activity in sector 42 in <strong>2011</strong>.35
Figure 29. Trap activity in sector 47 in <strong>2011</strong>.36
Appendix 1.37
Appendix 2.Laboratory Evaluation <strong>of</strong> Zinc Borate, Disodium Octaborate Tetrahydrate,and Sodium Fluoride in Resinous Formulations at VariousRatios <strong>of</strong> Treated to Untreated <strong>Termite</strong>sTimothy G. Myles, Ph.D.<strong>Termite</strong> Control Officer<strong>City</strong> <strong>of</strong> <strong>Guelph</strong>, 1 Carden St., <strong>Guelph</strong>, Ontario, Canada N1H 3A1Tim.myles@guelph.ca 519-837-5615 ext 2840, 5190827-4383 (cell)Abstract A laboratory test was conducted to evaluate the kill ratios <strong>of</strong> threecompounds: zinc borate, disodium octaborate tetrahydrate (DOT), and sodium fluoride,when applied to termites as resinous formulations, followed by release <strong>of</strong> treatedtermites among untreated termites. The highest kill ratio was obtained with zinc boratewhich registered a maximum kill ratio <strong>of</strong> 1:35 (one treated termite killed 35 untreatedtermites). Disodium octaborate tetrahydrate registered a maximum kill ratio <strong>of</strong> 1:10,and sodium fluoride registered a maximum kill ratio <strong>of</strong> 1:6.Introduction In an ongoing effort to evaluate potential actives for area-wide control <strong>of</strong> theeastern subterranean termite Reticulitermes flavipes, three actives were tested each at fourdifferent ratios <strong>of</strong> treated to untreated termites: 10:100, 5:100, 2:100, and 1:100.Materials and Methods The three test compounds were zinc borate, disodium octaboratetetrahydrate (DOT), and sodium fluoride. Talcum powder served as an inert treatmentcontrol. And there was also an untreated control group. All compounds were applied totermites in a resinous formulation in which the resin to active was 1 part to 6 parts. Absoluteethanol made up 59% and Phthalo Green dye #7 made up 1% <strong>of</strong> the final formulation. Theformulation was applied to the termites with a foam rubber applicator. The formulation wasallowed to completely dry on the treated termites for 5 minutes and then the treated termiteswere introduced by forceps into groups <strong>of</strong> 100 untreated termites. Each replicate had 100treated termites held in a 9 cm plastic petri dish with one water saturated disc <strong>of</strong> filter paper,and the specified number <strong>of</strong> treated termites at the following ratios, treated to untreated:10:100, 5:100, 2:100, and 1:100. Each dish was sealed with Parawax and all dishes held in aplastic sweater box at 95% RH at room temperature. There were three replicates for eachcompound and control at each treatment ratio. <strong>Termite</strong> mortality was counted about every 4days. The test ran for 33 days.Results See Figures 1-4.Conclusion The highest kill ratio was obtained with zinc borate which registered amaximum kill ratio <strong>of</strong> 1:35 (one treated termite killed 35 untreated termites). Disodiumoctaborate tetrahydrate registered a maximum kill ratio <strong>of</strong> 1:10, and sodium fluorideregistered a maximum kill ratio <strong>of</strong> 1:6. The mortality curves are shown in Figs. 1-4.38
Fig. 1. 10 treated to 100 untreated termites.Fig. 2. 5 treated to 100 untreated termites.Fig. 3. 2 treated to 100 untreated termites.Fig 4. 1 treated to 100 untreated termites.39
Appendix 3Laboratory Evaluation <strong>of</strong> Three Species <strong>of</strong> the Bio-control FungusMetarhizium at Various Ratios <strong>of</strong> Treated to Untreated <strong>Termite</strong>sTimothy G. Myles, Ph.D.<strong>Termite</strong> Control Officer<strong>City</strong> <strong>of</strong> <strong>Guelph</strong>, 1 Carden St., <strong>Guelph</strong>, Ontario, Canada N1H 3A1Tim.myles@guelph.ca 519-837-5615 ext 2840, 5190827-4383 (cell)Abstract Three species <strong>of</strong> the entomopathogenic fungus Metarhizium spp. weretested to evaluate their potential to induce transmissible mortality when groups <strong>of</strong> theeastern subterranean termite were exposed at different ratios <strong>of</strong> treated to untreatedtermites. The species tested were M. flavoviride, M. brunneum, and M. robertsii, allfrom Canadian source isolates. The treatment consisted <strong>of</strong> rolling the termites inMetarhizium conidia dust. The conidia-dusted termites were then introduced intogroups <strong>of</strong> 100 untreated termites at the following ratios: 0T: 100UT (control), 1T:100UT, 2T: 100UT, and 4T: 100UT (where T = treated and UT = untreated). All threespecies caused high mortality at all treatment ratios within one week. Metarhiziumflavoviride caused the most rapid mortality, followed by M. brunneum and lastly M.robertsii. This test confirms the bio-control potential <strong>of</strong> Metarhizium spp. for termitecontrol.Introduction In an ongoing effort to identify least-toxic, potential control agents for areawidecontrol <strong>of</strong> the eastern subterranean termite, Reticultiermes flavipes, laboratory testswere conducted to evaluate three locally occuring species <strong>of</strong> the entomopathogenic fungus,Metarhizium, the causal agent <strong>of</strong> green muscardine disease in insects.Materials and Methods Two species <strong>of</strong> Metarhizium were obtained from termite cultures inthe <strong>City</strong> <strong>of</strong> <strong>Guelph</strong> (M. flavoviride and M. robertsii). A third species, M. brunneum, wasobtained from an isolate collected near <strong>Guelph</strong>, using wax moth larvae (Galleria sp.) for fieldbaiting from Pr<strong>of</strong>essor Michael Bidochka <strong>of</strong> Brock University, St. Catharines, Ontario. Allthree species were maintained on lab cultures on Potato Dextrose Agar. Two month oldculture plates were used as sources <strong>of</strong> conidia for the tests. The culture plates were invertedand tapped with forceps to dislodge the conidia into a glass petri dish. The fresh conidiawere then immediately used to dust the treatment termites. The termites were dusted byintroducing them into the petri dish and swirling them in the conidial dust for one minute untilfully coated. The conidia-dusted termites were then picked up with forceps and dropped oneat a time into dishes holding 100 untreated termites on water-saturated filter paper. Theconidia-dusted termites were introduced into groups <strong>of</strong> 100 untreated termites at thefollowing ratios: 0T: 100UT (control), 1T: 100UT, 2T: 100UT, and 4T: 100UT (where T =treated and UT = untreated). There was only one replicate per species and ratio. After the40
specified number <strong>of</strong> treated termites were introduced, the dishes were sealed with Parafilmwax, and all dishes were placed in a closed plastic box at 95% RH at room temperature.Results In all cases, with all three species <strong>of</strong> Metarhizium, it was observed that the conidiadustedtermites elicited grooming, alarm, and aggregation around the dusted termites, biting,and sometimes dismemberment, as has been previously reported (Myles, 2002). Groomingwas very intense and within12 hours all dusted individuals were groomed clean. Most, if notall treated individuals, were killed and cannibalized. A dark area was visible in the cropsand/or anus <strong>of</strong> untreated termites marking the conidia in the guts within 12 hours indicatingthat a high percentage <strong>of</strong> the untreated termites obtained conidia in their guts either bygrooming, cannibalism, or trophallaxis.Metarhizium flavoviride was the dustiest (most powdery) and coated the termites best.Metarhizium robertsii was the least powdery, and tended to remain somewhat in clumps, thusthe dusted termites were only slightly darkened by the dusty powder. Whereas M. flavovirideand M. brunneum dusted termites took on the color <strong>of</strong> the respective conidia, green or brown.Mortality curves for the three Metarhizium species are shown in Figs. 1-3.Conclusions All three species caused high mortality at all treatment ratios within one week.Metarhizium flavoviride caused the most rapid mortality, followed by M. brunneum and lastlyM. robertsii. This test confirms the high kill ratio potential <strong>of</strong> Metarhizium spp. for termitecontrol. Metarhizium species are common locally occurring soil fungi that show greatpotential as natural bio-control agents. It would appear that when used in a trap-treat-releaseapproach in which a small fraction (l% or less) <strong>of</strong> the target termite population is trapped anddusted with conidia, the released termites could cause high levels <strong>of</strong> mortality. Approval forfield testing is urgently needed to confirm this potential advantage over the currentlyapproved chemical treatment methods that use large amounts <strong>of</strong> chemicals in close proximityto human habitations, only to block termite access to structures without causing anysignificant colony level mortality.41
Figure 1. Mortality following conidia dusting with M. flavoviride.Figure 2. Mortality following conidia dusting with M. brunneum.Figure 3. Mortality following conidia dusting with M. robertsii.42
Appendix 4.Laboratory Evaluation <strong>of</strong> Metarhizium flavoviride Conidia in a DustDilution Series at Various Ratios <strong>of</strong> Treated to Untreated <strong>Termite</strong>sTimothy G. Myles, Ph.D.<strong>Termite</strong> Control Officer<strong>City</strong> <strong>of</strong> <strong>Guelph</strong>, 1 Carden St., <strong>Guelph</strong>, Ontario, Canada N1H 3A1Tim.myles@guelph.ca 519-837-5615 ext 2840, 5190827-4383 (cell)Abstract Conidia <strong>of</strong> the entomopathogenic fungus, Metarhizium flavoviride weremixed with talcum powder to give the following formulations: 100% (pure conidia), 50%(1 part conidia to 1 part talcum powder), 25% (1 part conidia to 3 parts talcum powder),12.5% (1 part conidia to 7 parts talcum powder), and 6.25% (1 part conidia to 15 partstalcum powder). Eastern subterranean termites, Reticulitermes flavipes, were thendusting with each <strong>of</strong> these formulations and the dusted termites were then introducedinto groups <strong>of</strong> 100 untreated termites in petri dishes at the following ratios: 0T:100UT(control), 1T:100UT, 2T:100UT, and 4T:100UT. Mortality was recorded daily for 15days. For the 100%, 50%, and 25% formulations at all treatment ratios mortality curveswere similar with a one day lag followed by up to 20% mortality on the second day, 30-80% mortality on the third day and greater than 90% mortality on the fourth dayHowever with the 12.5% and 6.25% dilutions, mortality curves lengthened as thetreatment ratio declined. This suggests that dust dilution <strong>of</strong> conidia serves to lengthenthe lag period and the rate <strong>of</strong> mortality, thus providing more time for treated termites tointeract with untreated termites and thus optimizing transmission from treated tountreated termites. The optimum dust dilution may be about 5% or even lower.Introduction In an ongoing effort to evaluate and refine the use <strong>of</strong> the entomopathogenicfungus Metarhizium flavoviride for termite control, a dust dilution series was set up toevaluate the effect <strong>of</strong> reducing the conidial load on the treated termites.Materials and Methods Conidia <strong>of</strong> the entomopathogenic fungus, Metarhizium flavoviridewere mixed with talcum powder to give the following formulations: 100% (pure conidia), 50%(1 part conidia to 1 part talcum powder), 25% (1 part conidia to 3 parts talcum powder),12.5% (1 part conidia to 7 parts talcum powder), and 6.25% (1 part conidia to 15 parts talcumpowder). Eastern subterranean termites, Reticulitermes flavipes, were then dusting witheach <strong>of</strong> these formulations and the dusted termites were then introduced into groups <strong>of</strong> 100untreated termites in petri dishes at the following ratios: 0T:100UT (control), 1T:100UT,2T:100UT, and 4T:100UT. Mortality was recorded daily for 15 days.43
Results Mortality was recorded daily for 15 days. For the 100%, 50%, and 25% formulationsat all treatment ratios mortality curves were similar with a one day lag followed by up to 20%mortality on the second day, 30-80% mortality on the third day and greater than 90%mortality on the fourth day However with the 12.5% and 6.25% dilutions, mortality curveslengthened as the treatment ratio declined. See Figures 1-5.44
Conclusions The results suggests that dust dilution <strong>of</strong> conidia serves to lengthen the lagperiod and moderate the rate <strong>of</strong> mortality, thus providing more time for treated termites tointeract with untreated termites and thus optimizing transmission from treated to untreatedtermites. The optimum dust dilution may be about 5% or even lower.45
Appendix 5.Laboratory Evaluation <strong>of</strong> Metarhizium flavoviride Conidiain a 5% Dust Formulation for <strong>Termite</strong> ControlTimothy G. Myles, Ph.D.<strong>Termite</strong> Control Officer<strong>City</strong> <strong>of</strong> <strong>Guelph</strong>, 1 Carden St., <strong>Guelph</strong>, Ontario, Canada N1H 3A1Tim.myles@guelph.ca 519-837-5615 ext 2840, 5190827-4383 (cell)Abstract Eastern subterranean termites, Reticulitermes flavipes, were treated bydusting with a formulation consisting <strong>of</strong> 5% conidia <strong>of</strong> the entomopathogenic fungusMetarhizium flavoviride and 95% talcum powder, and then introduced into groups <strong>of</strong>untreated termites in soil cups. The tested ratios <strong>of</strong> treated to untreated termites were0T:500UT (control), 10T:500UT, 20T:500UT, 30T:500UT, 50T:500UT, 100T:500UTwhere T=treated, and UT = untreated. All termites in treatment groups were dead afterone week, indicating a potential control ratio <strong>of</strong> 1:50 in a soil environment. However,mortality in the control was also unusually high at 50% indicating inadvertent exposureand/or an unhealthy test population. The experiment should be repeated with a healthyfield fresh termite population.46
Appendix 6.Laboratory Evaluations <strong>of</strong> N'N-naphthaloylHydroxyl Amine (NHA) for <strong>Termite</strong> ControlTimothy G. Myles, Ph.D.<strong>Termite</strong> Control Officer<strong>City</strong> <strong>of</strong> <strong>Guelph</strong>, 1 Carden St., <strong>Guelph</strong>, Ontario, Canada N1H 3A1Tim.myles@guelph.ca 519-837-5615 ext 2840, 5190827-4383 (cell)Abstract N’N-napththaloyl hydroxyl amine (NHA) has shown some promise in termitebaiting projects recently conducted by USDA researchers at various sites in southernWisconsin. It was therefore <strong>of</strong> interest to obtain a sample and compare it with zincborate as currently being field tested in <strong>Guelph</strong>, Ontario. In the first test NHA was madeup in a resin formulation and compared to sulfluramid and zinc borate at a ratio <strong>of</strong> 3treated to 100 untreated termites. In a second test NHA was used as a dust applied totermites at a ratio <strong>of</strong> 4 treated to 100 untreated, and as a bait toxicant applied to filterpaper. In the second test, NHA was compared with parallel tests <strong>of</strong> zinc borate,disodium octaborate tetrahydrate and Metarhizium flavoviride conidia. NHA was sloweracting than Metarhizium and borates but faster acting than diflubenzuron (based onearlier tests). NHA is a moderately effective active when used as either a dust or baittoxicant for termite control. (see figures below).47
Appendix 7.Laboratory Evaluation <strong>of</strong> Leadas a Potential <strong>Termite</strong> Bait ToxicantTimothy G. Myles, Ph.D.<strong>Termite</strong> Control Officer<strong>City</strong> <strong>of</strong> <strong>Guelph</strong>, 1 Carden St., <strong>Guelph</strong>, Ontario, Canada N1H 3A1Tim.myles@guelph.ca 519-837-5615 ext 2840, 5190827-4383 (cell)Abstract A one-month lab test <strong>of</strong> lead applied to filter paper showed no significanteffect on termite mortality.Introduction Lead in small doses is known to have certain slow-acting toxic effects onmammals. It was therefore <strong>of</strong> interest to evaluate lead as a potential bait toxicant for termitecontrol.Materials and Methods VWR filter paper discs were covered on one side with lead byscratching in pencil-like fashion using a South Bend brand lead casting sinker (10.5 g). Thefilter paper discs were saturated in water and placed on the bottom <strong>of</strong> 9 cm diameter Falconbrand plastic petri dishes. One gram <strong>of</strong> termites (ca. 345 termites) was placed in eachreplicate. The dishes were sealed with ParaFilm wax. There were three replicates <strong>of</strong> thetreatment and control. <strong>Termite</strong> mortality was checked every two or three days for 30 days.Results The lead treated filter paper was observed to be fed upon, and passed through thetermite gut. Lead coloured fecal material was observed. No quantitative difference wasnoticed in the amount <strong>of</strong> filter paper consumed between the treated and untreated filterpaper. After 30 days the treatments showed an average <strong>of</strong> 4.92% mortality and the controlsshowed an average <strong>of</strong> 4.06% mortality.Conclusion It was concluded that lead does not show good potential as a termite baittoxicant.49