2013 Budget - City of Guelph
2013 Budget - City of Guelph
2013 Budget - City of Guelph
- No tags were found...

You also want an ePaper? Increase the reach of your titles
YUMPU automatically turns print PDFs into web optimized ePapers that Google loves.
<strong>2013</strong><strong>Budget</strong>
ContentsChapter 7: <strong>2013</strong> Enterprise Funded <strong>Budget</strong>369 Overview369 <strong>Budget</strong> Approach371 Water and Wastewater Services Rate Overview375 Water and Wastewater Financial Indicators377 <strong>2013</strong> Water Services Operating and Capital <strong>Budget</strong>s395 <strong>2013</strong> Wastewater Services Operating and Capital <strong>Budget</strong>s413 <strong>2013</strong> Court Services Operating and Capital <strong>Budget</strong>s432 <strong>2013</strong> Ontario Building Code Administration <strong>Budget</strong>442 Appendix 1: <strong>2013</strong> Tax Supported Full Time Equivalent (FTE) Summary443 Appendix 2: <strong>City</strong> <strong>of</strong> <strong>Guelph</strong> <strong>2013</strong> Approved Expansion Requests450 Appendix 3: <strong>2013</strong>–2022 Reserve Continuity Schedules457 Appendix 4: Debt Continuity Schedule<strong>City</strong> <strong>of</strong> <strong>Guelph</strong> – <strong>2013</strong> <strong>Budget</strong>
Chief Administrative <strong>of</strong>ficer’s messageOn behalf <strong>of</strong> the executive team and staff, I am pleasedto present the <strong>2013</strong> budget for the <strong>City</strong> <strong>of</strong> <strong>Guelph</strong>.The <strong>City</strong> <strong>of</strong> <strong>Guelph</strong>’s <strong>2013</strong> budget is designed to strengthenhow the <strong>City</strong> works and build a thriving future for <strong>Guelph</strong>.Together, <strong>Guelph</strong>’s tax-supported operating, enterprise,capital and local boards and shared services budgets set apath for us to achieve the <strong>City</strong>’s goals with respect toorganizational excellence, innovation in local governmentand city building—the strategic focus areas <strong>of</strong> the <strong>City</strong>’sCorporate Strategic Plan.Selected highlights are described below:Organizational ExcellenceIn <strong>2013</strong>, <strong>Guelph</strong> will undertake an organizational assessmentdesigned to streamline future corporate work plans andensure we have the capacity to meet our corporate andcommunity objectives.The <strong>City</strong> will continue to pursue <strong>Guelph</strong>’s EmployeeEngagement Strategy. We know that unlocking the fullpotential <strong>of</strong> our workforce requires acting on the factors thatdrive employee engagement.Innovation in Local GovernmentNew to the budget in <strong>2013</strong>, the <strong>City</strong> established a $500,000efficiency target to be achieved through processimprovements, partnerships and other savings throughoutthe organization. This approach gives the organization thefreedom to be more creative and collaborative in findingfinancial and operational efficiencies.The <strong>City</strong> will begin implementing its Corporate TechnologyStrategy this year to provide easier access to <strong>City</strong> information,more opportunities for citizen engagement and modernbusiness systems. The plan highlights open governmentstrategies and other ways to use technology to deliver publicservices better.In <strong>2013</strong> <strong>Guelph</strong> will invest in energy-efficiency projects tosave up to $83,000 next year and $166,000 per year thereafter.The Corporate Energy Management Plan avoids costsassociated with increasing energy prices, reduces greenhousegas emissions and positions <strong>Guelph</strong> as an energy leader.The <strong>Guelph</strong> Municipal Holding Company is a unique,enterprise-based approach created under the OntarioBusiness Corporations Act and working within the confines <strong>of</strong>the Municipal Act. It functions as a for-pr<strong>of</strong>it corporation withshare capital focused on value added public assetsmanagement in support <strong>of</strong> municipal innovation, revenuegeneration and community prosperity.<strong>City</strong> Building<strong>Guelph</strong> is exploring new ways to fund investments to protect,preserve, and deliver the municipal programs, services andinfrastructure which contribute to <strong>Guelph</strong>’s quality <strong>of</strong> life, andensure a safe, inclusive, appealing and sustainable city.In <strong>2013</strong>, the <strong>City</strong> will continue developing <strong>Guelph</strong>’sCommunity Wellbeing Plan—a ten-year action plan that callsfor individuals, community partners and the <strong>City</strong> to worktogether to build <strong>Guelph</strong>’s quality <strong>of</strong> life and create a healthyand safe community where people can live life to the fullest.This year <strong>City</strong> Council approved a 2.04 per cent tax increase over2012 to support existing services, and a further 0.93 per centto implement strategic initiatives to strengthen how the <strong>City</strong>works and delivers public services better in this fast-growing,increasingly diverse and complex community.The <strong>2013</strong> budget demonstrates how the <strong>City</strong> <strong>of</strong> <strong>Guelph</strong> willdeliver on its mission to build an exceptional city byproviding outstanding municipal service and value. We’remaking a difference together.Ann PappertChief Administrative Officer<strong>City</strong> <strong>of</strong> <strong>Guelph</strong> – <strong>2013</strong> <strong>Budget</strong>
chapter 1<strong>2013</strong> Generalbudget overview6
General budget overviewThe <strong>City</strong> <strong>of</strong> <strong>Guelph</strong>’s budgets provide an overview <strong>of</strong> the spending plans for <strong>City</strong> departments for the comingfiscal year and the revenue sources required to fund these expenditures. In 2012, <strong>Guelph</strong> <strong>City</strong> Councilapproved the following budgets for the <strong>2013</strong> fiscal year:Tax -supported Operating and Capital <strong>Budget</strong>s• Planning, Building, Engineering and Environment• Community and Social Services• Operations, Transit and Emergency Services• Corporate and Human Resources• Finance and Enterprise Services• Office <strong>of</strong> the CAOEnterprise Operating and Capital <strong>Budget</strong>s• Water Services• Wastewater Services• Ontario Building Code (OBC) Administration• Court ServicesLocal Boards and Shared Services <strong>Budget</strong>s• <strong>Guelph</strong> Public Library Board• <strong>Guelph</strong> Police Service Board• Public Health• Social Services and Social Housing• Downtown Business Association<strong>City</strong> <strong>of</strong> <strong>Guelph</strong> – <strong>2013</strong> General budget overview7
General budget overview>> <strong>2013</strong> BUDGET BRIEFTax-supported <strong>Budget</strong>The <strong>City</strong> <strong>of</strong> <strong>Guelph</strong>’s <strong>2013</strong> Tax-supported Operating <strong>Budget</strong> was approved by <strong>Guelph</strong> <strong>City</strong> Council with a nettax levy requirement <strong>of</strong> $185,187,614. This represents a $5.35 million or 2.97 per cent year-over-year increaseonce assessment growth is taken into account. Based on a single family detached dwelling with a currentvalue assessment <strong>of</strong> $292,000, this represents an overall increase <strong>of</strong> $97. This funding is used to pay for the<strong>City</strong>’s day-to-day operations as well as fund <strong>City</strong> reserves that are used to fund capital works.Enterprise <strong>Budget</strong>The <strong>City</strong> <strong>of</strong> <strong>Guelph</strong>’s Enterprise budgets are approved separately from the tax-supported budgets and arefunded from revenue raised through water and wastewater rates, fine revenue and building permit sales. In<strong>2013</strong>, <strong>Guelph</strong> <strong>City</strong> Council approved a 0.08/m 3 increase to the volumetric rate for water and a 0.11/m 3 increaseto the volumetric rate for wastewater. Based on an average consumption <strong>of</strong> 200m 3 , this translates into a $58 or8 per cent increase to the residential bill. The <strong>City</strong>’s OBC Administration and Court Services areas are entirelyfunded from the sale <strong>of</strong> building permits and fines and therefore have no direct impact on the average citizen.<strong>City</strong> <strong>of</strong> <strong>Guelph</strong> – <strong>2013</strong> General budget overview8
General budget overview>> <strong>2013</strong> Gross Expenditures and Funding SourcesThe chart below shows the <strong>2013</strong> gross expenditures for all <strong>City</strong> budgets and the funding sources used to payfor these expenditures ($000’s)Taxation User FeesWater andWastewaterRatesProduct Sales,Licenses andPermitsInterest andPenaltiesExternalRecoveries GrantsInternalRecoveriesTransfers fromReserves andReserve Funds194,795.1 32,427.5 48,061.7 7,451.3 4,742.3 11,452.6 9,814.6 33,891.0 6,273.2Planning,CAOOperations,Transit andEmergencyServicesEngineeringandEnvironmentalServicesCommunityand SocialServicesCorporate andHumanResources Local BoardsSharedServicesGeneral andCapitalFinancingFinance andEnterprise Water and WastewaterPOA andOBC Admin2,168.9 100,466.4 32,791.2 27,236.0 12,700.0 45,133.4 27,159.3 37,829.4 5,421.5 51,522.3 6,480.9Gross Operating Expenses348,909.3Total Gross Expenditures425,239.2Gross Capital Expenditures76,329.9PolicyPlanningandCorporateInitiativesCorporateBuildings andRecreationFacilitiesRoads andStormwaterSystemsSolid WasteManagement Public WorksPark DesignandMaintenance TransitCulture andEntertainmentEconomicDevelopmentEmergencyServicesInformationTechnologyLocalBoardsWater andWastewaterServices13,325.0 548.7 5,734.1 4,788.1 1,899.4 3,005.6 343.0 3,842.0 10,198.6 2,707.6 3,405.5 1,672.7 24,772.7 86.9CourtServicesGrants andSubsidiesFederalGas TaxOtherDevelopmentCharges (DCs)DCDebtEquipmentReplacement<strong>City</strong>Reserves Debt User RatesFinesandPermits1,956.6 6,839.7 6,620.4 13,063.9 500.0 12,472.0 13,965.6 3,345.4 17,518.4 47.9<strong>City</strong> <strong>of</strong> <strong>Guelph</strong> – <strong>2013</strong> General budget overview9
General budget overview>> Operating <strong>Budget</strong> HighlightsSimilar to other municipalities, the <strong>City</strong> <strong>of</strong> <strong>Guelph</strong>’s tax-supported and enterprise operating budgets reflectitems that are specific to <strong>Guelph</strong> and contribute significantly to changes in the <strong>City</strong>’s operating budget. Thesefactors include:Social Services and HousingIn 2012, an agreement was reached between the <strong>City</strong> <strong>of</strong> <strong>Guelph</strong> and the County <strong>of</strong> Wellington to fund thecapital costs for Wellington Terrace. These costs increased the overall amount provided to Wellington Terraceby approximately $1M to $1.116M. This is a significant increase to the amount <strong>of</strong> the transfer.Corporate Strategic PlanIn 2012, Council approved a corporate strategic plan to position the <strong>City</strong> to take advantage <strong>of</strong> futureopportunities. Funding for initiatives contained in the Corporate Strategic Plan (CSP) represents a significantfinancial commitment. The Corporate Technology (IT) Strategic Plan and the Community Energy Plan areconsidered critical to the <strong>City</strong> to deliver real time service to citizens and experience significant cost avoidancerelated to future energy cost increases. For <strong>2013</strong>, the funding related to CSP initiatives totalled $973,400representing a 0.54 per cent impact to the tax rate.<strong>City</strong> <strong>of</strong> <strong>Guelph</strong> – <strong>2013</strong> General budget overview10
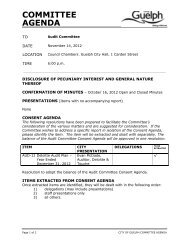
General budget overview>> Overview <strong>of</strong> <strong>City</strong> ExpendituresDebt charges and reserve transfers$54.215%The <strong>City</strong> <strong>of</strong>fers a variety <strong>of</strong> services that are essential to the well-being <strong>of</strong> all residents. The graph belowprovides an overview <strong>of</strong> how <strong>City</strong> dollars are budgeted.Internal charges$33.910% Government Transfers (province and county)Purchased services$33.49%Overal city expenditures by category ($Ms)$348.9 M$26.78%Other transfers (including grants)$6.02%Financial expenses$2.31%Purchased goods$31.39%Salaries, wages and benefits$161.146%Salaries, Wages and BenefitsThe <strong>City</strong>’s human resource costs are made up <strong>of</strong> salary, wages and legislated fringe benefit cost increases andstaffing increases. In <strong>2013</strong>, salary and benefit costs are $161.1 million representing 46 per cent <strong>of</strong> grossexpenditures. This is a $8.1 million or 5.3 per cent increase over 2012 levels.A note about <strong>2013</strong> salaries and benefits: The <strong>City</strong> negotiates with seven different unions. <strong>2013</strong> wage increaseswere determined through union negotiations and are included in the budget averaging at two per cent. Inaddition, employee benefits including statutory increases related to CPP, EI, OMERS and external employeeinsurance rates have increased over 2012.<strong>City</strong> <strong>of</strong> <strong>Guelph</strong> – <strong>2013</strong> General budget overview12
General budget overviewTaxationSimilar to most municipalities, the <strong>City</strong> <strong>of</strong> <strong>Guelph</strong>’s primary source <strong>of</strong> revenue is tax revenues. In <strong>2013</strong>, the <strong>City</strong>has budgeted to receive $194.8 million from taxation representing an $8 million or 4.3 per cent increase over2012. Taxation revenue is derived from several different sources including the general levy, supplementary levyand payments-in-lieu <strong>of</strong> taxes and represents 56 per cent <strong>of</strong> all <strong>City</strong> revenues.User FeesIn <strong>2013</strong>, revenue generated from user fees will amount to $32.4 million which translates into a $2.3 million or7.7 per cent increase over the 2012 budget largely due to new tax notification fees and small increases inparking rates, by-law enforcement fines, waste processing fees and recreation fees. Detailed increases to otheruser fees can be found in Appendix 4 which provides the year over year change in the fees charged for<strong>City</strong> services.Water and Wastewater RatesWater and wastewater rates is revenue generated by the amount <strong>of</strong> water and wastewater used by residentsand businesses within the <strong>City</strong> <strong>of</strong> <strong>Guelph</strong>. The water and wastewater rate structure is comprise <strong>of</strong> a basiccharge – or what you pay just to be connected to the system- and a volumetric charge – or what you paybased on the number <strong>of</strong> cubic metres consumed. In <strong>2013</strong>, $48M in revenue is forecast to come from water andwastewater rates. This represents an 8.5 per cent increase over 2012. A more detailed discussion on water andwastewater rates can be found in Chapter 7 <strong>of</strong> this document.GrantsIn <strong>2013</strong>, revenue from grants is projected to be $9.8 million which represents an increase <strong>of</strong> $0.5 million or5.4 per cent over 2012. This increase is predominantly due to an increased grant from the Province <strong>of</strong> Ontari<strong>of</strong>or Land Ambulance Services. Funding from the province is provided one year in arrears with the province’sagreement to pay 50 per cent <strong>of</strong> all eligible operating expenditures.<strong>City</strong> <strong>of</strong> <strong>Guelph</strong> – <strong>2013</strong> General budget overview16
General budget overviewOther RevenuesWith respect to the <strong>City</strong> <strong>of</strong> <strong>Guelph</strong>’s budget, other revenues refer to such things as:• Product sales• Licences and Permits• Investment income• External Recoveries representing revenues from other levels <strong>of</strong> government and developersIn <strong>2013</strong>, revenue from these sources is projected to be $23.7 million representing an increase <strong>of</strong> $1.8 million, or8.3 per cent, over 2012. The increase in <strong>2013</strong> can be largely attributed to the increased revenue from sale <strong>of</strong>recycled materials, increased permit sales, increased penalty fees and investment revenue.Internal Recoveries and Transfers from Reserve and Reserve FundsInternal recoveries is funding received through a cross charge between <strong>City</strong> departments where as transfersfrom reserves and reserve funds is revenue that comes from the <strong>City</strong>’s reserve and reserve funds to fund anidentified expense. In <strong>2013</strong>, funding from these sources is $40.2 million representing a $3.6 million increaseover 2012. This increase is largely due to an increase to internal recoveries due to inflationary pressures and theon-going transition to full cost recovery <strong>of</strong> the <strong>City</strong>’s support departments against the non-tax supportedbudgets.<strong>City</strong> <strong>of</strong> <strong>Guelph</strong> – <strong>2013</strong> General budget overview17
General budget overview>> Capital <strong>Budget</strong> HighlightsThe <strong>2013</strong>-2022 Capital budget and forecast provide a budget for the upcoming year and projections <strong>of</strong> the<strong>City</strong>’s capital needs for the next nine years. The <strong>City</strong> <strong>of</strong> <strong>Guelph</strong>’s <strong>2013</strong> gross capital budget is $76.3 million andcan be allocated into the following categories:Project coastProject Category($'000s)Roads and Stormwater Systems 13,325.0Policy Planning Studies 548.7Solid Waste Management 5,734.1Public Works 4,586.1By-law and Security 202.0Emergency Services 2,707.6Transit 3,005.6Culture and Entertainment 343.0Corporate Buildings and Recreation Facilities 3,842.0Park Design and Maintenance 1,899.4Economic Development 5,089.3Finance 130.0Downtown Improvements 3,700.0Community Energy 1,279.3Information Technology 3,405.5Local Boards 1,672.7Enterprise $24,859.6Total <strong>2013</strong> $76,329.9<strong>City</strong> <strong>of</strong> <strong>Guelph</strong> – <strong>2013</strong> General budget overview18
General budget overviewBy-law, Security and Licensing• Security infrastructure replacementEmergency Services• Ongoing vehicle and equipment replacement <strong>of</strong> the <strong>City</strong>’s emergency services assets• Mobile communication units<strong>Guelph</strong> Transit• Ongoing vehicle and equipment replacement <strong>of</strong> the <strong>City</strong>’s transit assets• Transit terminal information technology upgrades• Fare box upgrade• Computer Aided Dispatch/Automated Vehicle Location (CAD/AVL) replacementCulture and Tourism• Public Art in Market Square and downtownCorporate Building Maintenance• Life cycle projects at West End Community Centre, Exhibition Park and Sleeman Centre and other mediumriskstructural repairs at various <strong>City</strong> facilitiesParks and Recreation• Implement growth-related trail projects• Invest in park equipment to improve maintenance and service delivery• Initiate plans for south end community centre• Continue developing Eastview Community ParkFinance and Enterprise Services• Hanlon Creek Business Park• Baker Street redevelopment• Implement facility energy measures<strong>City</strong> <strong>of</strong> <strong>Guelph</strong> – <strong>2013</strong> General budget overview20
General budget overviewInformation Technology• Ongoing replacement <strong>of</strong> the <strong>City</strong>’s information technology equipment including computers, s<strong>of</strong>tware,printers and servers• Implement joint wireless design• Implement Corporate Technology Strategy<strong>Guelph</strong> Public Library Board• Implement inventory control and security systemProvincial Offences Court Administration• Review operation <strong>of</strong> AMANDA s<strong>of</strong>tware as part <strong>of</strong> implementing Corporate Technology StrategyWater and Wastewater Services• Ongoing maintenance and replacement <strong>of</strong> water and sewer infrastructure as outlined in the Water/Wastewater Servicing Master Plan including construction <strong>of</strong> the York Trunk Sewer• Update five-year Water Supply Master Plan• Groundwater protection initiatives resulting from the Province’s Clean Water Act and the proposed GrandRiver Source Protection Plan• Annamox side stream treatment and biosolid facility upgrades relating to capacity and the accommodation<strong>of</strong> future growth<strong>City</strong> <strong>of</strong> <strong>Guelph</strong> – <strong>2013</strong> General budget overview21
General budget overviewThe chart below provides an overview <strong>of</strong> the expenditures and funding sources <strong>of</strong> the <strong>City</strong>’s capital budget:External Funding SourcesInternal Funding SourcesProject CategoryProjectCostGrants andSubsidiesFederalGas Tax OtherDevelopmentCharges (DCs)DCDebtEquipmentReplacement<strong>City</strong>Reserves DebtRoads and Stormwater Systems 13,325.0 - 5,560.0 430.0 2,721.6 500.0 - 4,113.4 -Policy Planning Studies 548.7 - - - 234.4 - - 314.3 -Solid Waste Management 5,734.1 596.3 998.4 153.1 - - 2,366.3 420.0 1,200.0Public Works 4,586.1 180.0 - - 81.0 - 3,291.1 1,034.0 -By-law and Security 202.0 - - - - - - 202.0 -Emergency Services 2,707.6 - - 360.8 - - 2,311.8 35.0 -Transit 3,005.6 543.6 - - 415.7 - 1,456.0 590.3 -Culture and Entertainment 343.0 - - - - - - 343.0 -Corporate Buildings and Recreation Facilities 3,842.0 - - - 367.6 - - 3,324.4 150.0Park Design and Maintenance 1,899.4 25.0 - - 1,150.3 - 170.4 553.7 -Economic Development 5,089.3 - - 5,089.3 - - - - -Finance 130.0 - - - 105.3 - - 24.7 -Downtown Improvements 3,700.0 - - - 1,704.6 - - - 1,995.4Community Energy 1,279.3 - - 374.8 2.4 - - 902.1 -Information Technology 3,405.5 - - 85.1 - - 1,418.7 1,901.7 -Local Boards 1,672.7 - - 8.0 - - 1,457.7 207.0 -Enterprise 24,859.6 611.7 281.3 119.3 6,281.0 - - 17,566.3Total <strong>2013</strong> $76,329.9 $1,956.6 $6,839.7 $6,620.4 $13,063.9 $500.0 $12,472.0 $31,531.9 $3,345.4The <strong>City</strong> <strong>of</strong> <strong>Guelph</strong>’s capital reserve funds are divided into two types: obligatory and discretionary. Theprojected balances in these reserves are provided in detail in Appendix 3 <strong>of</strong> this document. The <strong>City</strong>’s debtcontinuity schedule outlining the opening and closing balance <strong>of</strong> the <strong>City</strong>’s debt, debt servicing costs anddebt ratios can be found in Appendix 4.<strong>City</strong> <strong>of</strong> <strong>Guelph</strong> – <strong>2013</strong> General budget overview22
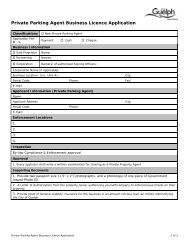
General budget overviewCorporate Buildings, Culture and Recreation Facilities$4.2 - 5%Transit$3.0 - 4%Park Design and Maintenance$1.9 - 2%Public Works, By-law and Security$4.8 - 6%Solid Waste Management$5.7 - 8%Policy Planning and Corporate Initiatives$0.5 - 1%Roads and Stormwater Systems$13.3 - 17%<strong>2013</strong> Capital budget by project category ($Ms)$76.3 millionEconomic Development$5.1 - 7%Downtown Impovements$3.7 - 5%Community Energy$1.3 - 2%Emergency Services$2.7 - 4%Information Technology$3.4 - 4%Local boards$1.7 - 2%Enterprise$24.9 - 33%Other$6.69%Federal Gas Tax$6.89%Grants, Subsidies and other$2.03%Debt$3.34%<strong>2013</strong> Capital budget by funding source ($Ms)$76.3 millionDevelopment Charges and DC Debt$13.617%Equipment Replacement$12.516%<strong>City</strong> Reserves$31.542%<strong>City</strong> <strong>of</strong> <strong>Guelph</strong> – <strong>2013</strong> General budget overview23
chapter 2<strong>2013</strong> Operatingbudget process24
Operating budget processThe <strong>City</strong>’s operating budget process begins with timelines, strategies and guidelines that are presented toCouncil for consideration and approval. Once these items are approved, staff begin the preparation <strong>of</strong> the<strong>City</strong>’s budget.Note that for the <strong>City</strong>’s water and wastewater budgets, Council has previously provided direction regardingthe rate increase that would be considered acceptable. For water and wastewater budgets, a 10% guideline isfollowed in preparing their operating budgets. For Court Services and OBC Administration, the budgets thatare brought forward represent what is affordable given the projected revenues to be collected in the comingyear. The <strong>City</strong>’s Non-Tax Supported departments are subject to the same timelines that the <strong>City</strong>’s tax supporteddepartments follow.For purposes <strong>of</strong> this document, the remainder <strong>of</strong> this chapter will focus largely on the <strong>City</strong>’s Tax SupportedOperating budget; however, the principles and process outlined below and in Chapter 3 also apply to theNon-Tax Supported Departments. Complete details on the <strong>City</strong>’s Non-Tax Supported budgets can be found inChapter X <strong>of</strong> this document.Level <strong>of</strong> <strong>Budget</strong> ReviewFinancial Reporting<strong>Budget</strong> Monitoring and ReportingCouncil Approval <strong>of</strong> <strong>City</strong> <strong>Budget</strong>sCouncil Review <strong>of</strong> <strong>City</strong> <strong>Budget</strong>sPublic DelegationsExecutive Team and Finance ReviewFinance ReviewDepartment Preparation and Review<strong>Budget</strong> Schedule and Council Direction<strong>City</strong> <strong>of</strong> <strong>Guelph</strong> – <strong>2013</strong> Operating budget process25
Operating budget process>> <strong>Budget</strong> ScheduleThe <strong>2013</strong> <strong>Budget</strong> Calendar identifies some <strong>of</strong> the key dates and milestones for the development, review andapproval <strong>of</strong> the <strong>City</strong>’s budgets.WeekJune 5July 17September 17October 3October 24November 6November 22November 27November 29December 5Event<strong>Budget</strong> Process Review<strong>Budget</strong> Guideline Workshop<strong>Budget</strong> WorkshopCapital <strong>Budget</strong> PresentationPresentation/Deliberation and Approval <strong>of</strong> Enterprise <strong>Budget</strong>s<strong>Budget</strong> WorkshopPresentation <strong>of</strong> the Tax-supported Operating <strong>Budget</strong>Presentation <strong>of</strong> Shared Services and Local Board <strong>Budget</strong>sPublic Delegation Night - CouncilDeliberation and approval <strong>of</strong> Operating and Capital <strong>Budget</strong>sUpon completion <strong>of</strong> the <strong>2013</strong> <strong>Budget</strong>, a budget debrief session is scheduled to obtain feedback on thebudget process, including suggestions for improvement.>> Council’s direction for the <strong>2013</strong> Operating <strong>Budget</strong>A budget guideline provides guidance for the preparation <strong>of</strong> the annual budget to ensure the budget processis focused and conducted efficiently, recognizing the need to conserve limited corporate resources. Theguideline provides an estimated tax rate impact resulting from stated assumptions including capital financing(debt servicing and capital reserve contributions), not to exceed 20 per cent <strong>of</strong> the previous year’s net taxrequirement.In July 2012, Council established a budget guideline as part <strong>of</strong> the annual budget process as follows: “THATCouncil direct staff to develop a draft <strong>2013</strong> tax supported operating budget using a tax rate guideline <strong>of</strong> up toa 3 per cent increase.”<strong>City</strong> <strong>of</strong> <strong>Guelph</strong> – <strong>2013</strong> Operating budget process26
Operating budget process>> Finance ReviewFinance is responsible for conducting a review <strong>of</strong> the department’s budget submission. The primary purpose<strong>of</strong> this analysis is to perform a technical review <strong>of</strong> the base budgets and summarize and review growth, newservice and impact from capital submissions in order to provide a clean starting point for the comprehensivereview to be undertaken by the <strong>City</strong>’s Executive Team. As part <strong>of</strong> this review, the Finance team:• Ensures that base budgets are prepared and completed in accordance with the budget guideline andinternal budget instructions that have been provided across the corporation• Monitors proposed budgets for reasonableness and accuracy• Prepares recommendations for the Executive Team to assist in reducing base budget increases andachieving the Council approved budget guideline.>> Finance and the Executive TeamFollowing the technical review by the Finance department, the <strong>City</strong>’s CFO/Treasurer, Financial Planning staffand Executive Team are responsible for performing a comprehensive review <strong>of</strong> the <strong>City</strong>’s budget. The first stepin this process is for the group to receive presentations from each <strong>City</strong> department. During thesepresentations, the team reviews budget packages and hears <strong>of</strong> budget changes that are impacting thedepartment’s individual budget. At this time, the team also reviews requests for growth and new service itemsand participates in the service area prioritization <strong>of</strong> these. Once all presentations have been heard, this team isresponsible for deciding if there is merit in prioritizing growth and new service items at a corporate level.Throughout September and October, this team met extensively and was responsible for making $2.23 millionin budget amendments that resulted in a 1.27 per cent reduction to the tax levy requirement compared towhat was submitted by <strong>City</strong> departments and boards. These amendments are summarized below:<strong>City</strong> <strong>of</strong> <strong>Guelph</strong> – <strong>2013</strong> Operating budget process28
Operating budget processSummary <strong>of</strong> ET amendments to the <strong>2013</strong> Tax Supported Operating <strong>Budget</strong>Description $Reduce Health Care Capital Grant (150,000)Phasing <strong>of</strong> Non-Union Management Employees Economic Increase (103,000)Adjustments to Capital Financing to utilize Federal Gas Tax for Building Infrastructure (400,000)Reduction to the transfer to the Elections reserve (22,000)Reduction to <strong>City</strong>-wide plantings by 10% <strong>of</strong> all shrubs and flowers (25,000)Developer Account Administration Revenue(new fee to recognize Finance support <strong>of</strong> these accounts)(35,000)Downtown Facade Program- Grant reduction by 50% (130,000)Review Business licensing fee criteria - increased rates (By-law Compliance and Security) (6,000)Increase parking fines($5.00 on average per violation) (25,000)Increased Downtown Parking Revenues derived through the current Parking Study (250,000)Eliminate Christmas Tree Collection (Public Works) (22,000)Reduce Catchbasin Cleaning Program from 5 year cycle to 6 year cycle. (Public Works) (41,700)Eliminate Residential Sidewalk Winter Control (Public Works) (100,000)Increase Subdivision Admin Fees (increase fee from 3% to 4% <strong>of</strong> contract cost) (80,000)Introduce a new user fee for Cart Exchange, i.e. Delivery and Cleaning ($35/delivery) (75,000)Reduction to WDGPH Payment equal to the Facility portion <strong>of</strong> the levy (500,000)In camera Items (267,200)Total Amendments (2,231,900)>> Public DelegationsPublic input into the budget process is essential. The <strong>2013</strong> budget process provided for one public delegationnight where members <strong>of</strong> the public could register to address members <strong>of</strong> Council. At this meeting, members<strong>of</strong> Council were able to discuss how the proposed budget impacted members <strong>of</strong> the community and explorehow these impacts might affect the services provided by these organizations and individuals. As a result <strong>of</strong>public delegations, Council has the opportunity to direct staff to bring forward alternatives to some <strong>of</strong> thedecisions reflected in the <strong>City</strong>’s proposed budget prior to final approval.<strong>City</strong> <strong>of</strong> <strong>Guelph</strong> – <strong>2013</strong> Operating budget process29
Operating budget process>> Council Review and ApprovalFollowing the Finance and Executive Team review, the <strong>2013</strong> Proposed Operating <strong>Budget</strong> is prepared andpresented to the <strong>City</strong> Council. As a result <strong>of</strong> the positive feedback received from the 2012 budget process, the<strong>2013</strong> budgets were also presented and approved on separate nights. As a result, Council heard three separatepresentations representing the proposed operating budgets for the <strong>City</strong>’s non-tax supported, tax supported<strong>City</strong> departments and local boards and shared services operating budgets. This facilitated greater Councilinput, streamlined the process and provided more time for review.The chart that follows shows the value <strong>of</strong> budget amendments made by Council.Net $ Tax ImpactCouncil AmendmentsRemove interest for HCBP Loan -296,000 -0.16%Fund Public Affairs work through Strategic Initiatives Reserve -120,000 -0.07%Reduce Library <strong>Budget</strong> (adjustment for benefit markup reduction) -30,200 -0.02%Add back $60K PDO reduction 60,000 0.04%Reduce <strong>City</strong> wide plantings by 20% (vs. 10%) for 1 year -25,000 -0.01%Add back funding for Residential Sidewalk Winter Control 100,000 0.06%No user fee for Cart Exchange at this time 75,000 0.04%$500K for efficiency target and report back in the variance report -500,000 -0.28%Fund internal audit consulting dollars from SI reserve -100,000 -0.06%Fund Organizational Assessment from the SI Reserve -100,000 -0.06%Total Council Amendments (936,200) -0.52%<strong>City</strong> <strong>of</strong> <strong>Guelph</strong> – <strong>2013</strong> Operating budget process30
Operating budget process>> Operating <strong>Budget</strong> MonitoringOnce the <strong>City</strong>’s Operating <strong>Budget</strong> is approved, the <strong>City</strong>’s Financial Planning division, in conjunction with all <strong>City</strong>departments, is responsible for the overall control and monitoring <strong>of</strong> the <strong>City</strong>’s budget through out the year.<strong>Budget</strong>ary performance is monitored monthly through distribution <strong>of</strong> budget reports to all <strong>City</strong> departments.Departments are required to report back to Financial Planning <strong>of</strong> any items that are significantly deviatingfrom plan. This provides staff with an early warning <strong>of</strong> potential areas <strong>of</strong> concern and gives management andCouncil the opportunity to consider appropriate actions. In <strong>2013</strong>, <strong>Guelph</strong> <strong>City</strong> Council is scheduled to receivefive operating variance reports. Two <strong>of</strong> these will relate to the <strong>City</strong>’s 2012 year end position and the remainingthree will provide periodic updates <strong>of</strong> the <strong>City</strong>’s variance position throughout <strong>2013</strong>.The following areas are expected to be monitored on a regular basis by Finance staff:• Compensation related costs• Commodity and energy costs• Winter Control and other seasonal expenses• Expenditures from the <strong>City</strong>’s contingency account• Revenue analysis <strong>of</strong> the <strong>City</strong>’s more volatile revenue sources>> Financial ReportingThe final step in the <strong>City</strong>’s budget process is financial reporting. This function reports on the <strong>City</strong>’s year endposition and provides insight on how the <strong>City</strong> performed throughout the year. When combined and looked atindividually, the following statements provide important information on how well the <strong>City</strong> performed duringthe year:• Consolidated statement <strong>of</strong> financial position which provides information on the <strong>City</strong>’s cash and investmentresources, net financial asset position (calculated as the difference between financial assets and liabilities),non financial assets such as the <strong>City</strong>’s capital assets and the <strong>City</strong>’s accumulated surplus ( or retained earningsin public sector terms)• Consolidated position <strong>of</strong> operations and surplus which provides information on the <strong>City</strong>’s revenues,expenses and the corresponding surplus or deficit resulting from the difference between the two<strong>City</strong> <strong>of</strong> <strong>Guelph</strong> – <strong>2013</strong> Operating budget process31
Operating budget process2011 Performance Measures Report CardLegendPositive:stay the courseCaution: in the rightrange but may bemoving in thewrong directionFinancial indicators 2011findingFinancial positionOperating surplus ratioReceivables as % <strong>of</strong> taxes leviedChange from2010 to 20112010findingNegative: takecorrective actionNet financial assetsPositive changeNet financial asset as % <strong>of</strong> own revenuesNegative changeDebt to total reserve ratioDebt outstanding per weighted assessmentDebt interest as a % <strong>of</strong> own source <strong>of</strong> revenuesOperating reserves as % <strong>of</strong> own source <strong>of</strong> revenueCapital reserve contributions as % <strong>of</strong> asset valueCapital reserve contributions to depreciationLiquid assets to total reserves<strong>City</strong> <strong>of</strong> <strong>Guelph</strong> – <strong>2013</strong> Operating budget process32
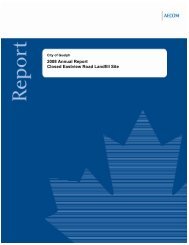
Operating budget process>> <strong>Guelph</strong>’s Municipal ContextThe following information frames the unique economic, social and environmental challenges andopportunities addressed in the <strong>2013</strong> budget which represents a 2.97 per cent tax increase over 2012: 2.04 percent increase to support base services, and a further 0.93 per cent to implement strategic initiatives designedto strengthen how the <strong>City</strong> works.Building a thriving future<strong>Guelph</strong> is preparing today to ensure a safe appealing and sustainable city that will continue to beeconomically viable, resilient, diverse and attractive for business.<strong>Guelph</strong> will continue to grow and we’re expecting that 55,000 more people will come to live and work in thecity by 2031. To maintain <strong>Guelph</strong>’s quality <strong>of</strong> life and continue delivering affordable community services, the<strong>City</strong> is making investments to ensure a healthy, vibrant community and a prosperous local economy.The <strong>City</strong>’s operating and capital budgets include funds to maintain the city’s existing infrastructure, preventservice disruptions and avoid costly emergency repairs, as well as investments in strategic initiatives designedto improve public services and enable <strong>Guelph</strong> to prosper in the years and decades ahead includingCommunity Wellbeing, Corporate Energy Management and Corporate Technology Plans, an EmployeeEngagement Strategy and Open Government framework.<strong>2013</strong> Tax-supported Capital <strong>Budget</strong> Project Distribution($51.5 million)Forward facing<strong>City</strong> Building projects25%Health and Safetyand Infrastructure Renewal56%CSP Initiatives19%<strong>City</strong> <strong>of</strong> <strong>Guelph</strong> – <strong>2013</strong> Operating budget process
Operating budget processCredit rating comparison<strong>Guelph</strong>’s responsible financial policies continue to serve us well as we continue to grow. The <strong>City</strong>’s credit ratingwas recently upgraded from an “AA” stable to “AA” positive outlook and is evidence <strong>of</strong> the <strong>City</strong>’s healthyfinancial position, sensible financial practices and proactive economic development plans.MUNICIPALITY A AA- AA AA+ AAA<strong>Guelph</strong>BarrieKingstonBrantfordWindsorPeterboroughSingle tierMississaugaHalton RegionPeel RegionWellington CountyUpper orlower tierOntarioCanadaPositive Stable Negative<strong>City</strong> <strong>of</strong> <strong>Guelph</strong> – <strong>2013</strong> Operating budget process34
Operating budget processOver the past four years <strong>Guelph</strong>’s tax rate increases have trended downward as has our use <strong>of</strong> the Tax RateStabilization Reserve. <strong>Guelph</strong>’s upgraded credit rating is due in part to more conservative use <strong>of</strong> this reserve asit is intended to manage tax rate increases during truly hard times or exceptional events, and should not berelied upon as a matter <strong>of</strong> course.Tax Levy Increase from:YearBaseGrowth/NewServiceTotal Tax LevyIncrease$ equivalent toa 1% increase intax rate ($M)A B C = A + B2008 2.48% 2.02% 4.50% $1.362009 2.95% 0.79% 3.74% $1.482010 3.66% 0.00% 3.66% $1.562011 -0.86% 2.64% 1.78% $1.602012 3.25% 0.27% 3.52% $1.71<strong>2013</strong> Proposed 2.73% 1.01% 3.74% $1.80<strong>City</strong> <strong>of</strong> <strong>Guelph</strong> – <strong>2013</strong> Operating budget process35
Operating budget processThe <strong>City</strong> is committed to ensuring the total municipal tax burden is no more than five per cent <strong>of</strong> the averagehousehold income in <strong>Guelph</strong>.Total municipal burden as a per cent <strong>of</strong> household income7%6%5%4%3%2%1%0%OakvilleMississaugaBurlingtonMarkhamVaughanGrimsbyBramptonWaterlooRichmond HillWhitbyOttawaLondonPickeringAjaxCambridge<strong>Guelph</strong>KitchenerSault Ste. MarieChatham-KentBarrieThunder BayGreater SudburyBrantfordWindsorOshawaNiagara FallsHamiltonSt. CatharinesKingstonBurden as a % <strong>of</strong> household incomeAverage<strong>City</strong> <strong>of</strong> <strong>Guelph</strong> – <strong>2013</strong> Operating budget process37
Operating budget processProviding outstanding municipal valueThere are many reasons for tax rate increases; some are within our control and others not.About 37 per cent <strong>of</strong> the <strong>City</strong>’s expenditures are set by outside boards and provincial agencies while theremaining 63 per cent is under the <strong>City</strong>’s control, but constrained by various contractual and legislatedresponsibilities.Public Health2%Distribution <strong>of</strong> tax dollarsShared Services13%Municipal63%Library4%Police18%<strong>City</strong> <strong>of</strong> <strong>Guelph</strong> – <strong>2013</strong> Operating budget process39
Operating budget processMeeting financial challengesThe <strong>City</strong>, like any business, is impacted by economic downturns and inflation, but <strong>Guelph</strong> is resilient and ourmunicipal programs and services remain intact.Though we are seeing some downward pressure on public sector salaries at both the provincial and municipallevels, compensation costs including employee benefits and negotiated wages still make up a significantportion ($4.6 million) <strong>of</strong> the increase to the operating budget.Increasing energy prices are also impacting operating costs, and investments in energy-efficiency projects areproposed in <strong>2013</strong> to protect the <strong>City</strong> against continued increases in natural gas and electricity rates in theyears to come.Finally, like other municipalities <strong>Guelph</strong> is impacted by downloaded costs from other levels <strong>of</strong> government.The <strong>City</strong> is exploring innovative funding models to meet these challenges in ways that are affordablefor taxpayers.<strong>City</strong> <strong>of</strong> <strong>Guelph</strong> – <strong>2013</strong> Operating budget process40
Operating budget processMeasuring our performanceKey performance indicators tell us where we stand with respect to our strategic goals and directions, enable usto identify and address areas for improvement and allow us to measure our progress as we enhanceorganizational excellence, innovation in local government and city building.Additional key performance indicators may be added and refined as we implement the plan.Key performance indicatorsOrganizational ExcellenceEmployee EngagementCreative CapacityEffective Work ProcessesInnovation in Local GovernmentInnovation RecognitionEnterprise AgilityService SatisfactionService AffordabilityValue Audit FocusPerformance and Results<strong>City</strong> buildingQuality <strong>of</strong> LifeSafetyEconomic VitalityEngagement and Communications<strong>City</strong> <strong>of</strong> <strong>Guelph</strong> – <strong>2013</strong> Operating budget process41
chapter 3<strong>2013</strong> Financialpolicy framework42
Financial Policy Framework>> Overview and Key PrinciplesThe purpose <strong>of</strong> a financial policy framework is to provide guidance for decision-making in order to secure afinancially sustainable future. Adherence to approved policies will help to avoid short-term budget or financialdecisions that, over time, may affect the <strong>City</strong>’s overall financial condition.The <strong>City</strong> <strong>of</strong> <strong>Guelph</strong> has been working on elements <strong>of</strong> a financial policy framework through developing along-range plan and related policies (budget, debt and reserve management). However, a completeframework formalizing guiding principles, targets, accountabilities, communication and completion <strong>of</strong>additional financial policies related to growth, strategic priorities and user fees for example, is still a work inprogress.Long-term Financial PlanningLong-term financial planning is a key element <strong>of</strong> the financial policy framework. It will allow the <strong>City</strong> toposition itself to maximize its ability to:• Meet current and future challenges• Exploit opportunities• Deliver stable levels <strong>of</strong> essential services• Identify fiscal issues and opportunities• Establish fiscal policies and goals• Examine fiscal trends• Produce a financial forecast• Provide for feasible solutionsLong-term financial planning is about balancing:• Costs and benefits between existing and future ratepayers• Financial stability and a solid credit rating with strategic initiatives and community priorities• The maintenance <strong>of</strong> existing infrastructure with the need to have infrastructure in place to support newgrowth and economic development• The need to address health and safety risk and environmental risks with demand for expanded service levels<strong>City</strong> <strong>of</strong> <strong>Guelph</strong> – <strong>2013</strong> Financial policy framework43
Financial Policy FrameworkThe <strong>City</strong> may borrow by debenture, mortgage or other acceptable debt instrument, to finance the <strong>City</strong> portion<strong>of</strong> growth-related infrastructure, and emerging capital needs to support corporate priorities and approvedstrategic plans under conditions outlined in the debt management policy. The <strong>City</strong> will not use long-term debtto fund current operations. The <strong>City</strong> will not use long-term debt to fund the ongoing rehabilitation <strong>of</strong> existinginfrastructure. This will be funded by reserves.Despite the limits prescribed in the regulations, prudent financial management calls for more stringent criteriato limit debt. These criteria will assist in preserving borrowing capacity for future capital assets whilemaintaining maximum flexibility for current operating funds.Direct Debt to Operating Revenue – This measure identifies the percentage <strong>of</strong> annual operating revenuesthat would be required to retire the <strong>City</strong>’s net debt. It is also the prime measure used by Standard and Poor’swhen assessing the debt burden <strong>of</strong> the municipality. A target rate <strong>of</strong> less than 55 per cent should bemaintained.Debt Service Cost to Net Revenue Fund Revenue – This ratio is a measure <strong>of</strong> the principal and interestpayable annually as a proportion <strong>of</strong> revenue fund revenues. It should not exceed a target <strong>of</strong> 10 per cent.Development Charge to Debt-Servicing Ratio – This ratio is a measure <strong>of</strong> the debt service cost <strong>of</strong> the debtissued to support the development charge reserve funds as a percentage <strong>of</strong> the average revenue forecast, asidentified in the development charge background study. It should not exceed a target <strong>of</strong> 20 per cent for hardservices (roads, storm water, water services. wastewater) and 10 per cent for all other development chargereserve funds. Note: additional capacity has been provided for the hard development charge services inrecognition <strong>of</strong> the substantial front-end financing required.Direct Debt to Reserve Ratio – This ratio compares direct debt to the total <strong>of</strong> all reserves and reserve funds. Agenerally accepted target ratio for municipalities is considered to be 1:1 and this level should be achievedwithin the next five years and maintained thereafter.Reserve and Reserve Fund Management – Reserves and reserve funds are established for planned futurecapital expenditures, unexpected or unpredicted evens, or extraordinary expenditures, which would otherwisecause fluctuations in the operating or capital budgets.In 2009, Council approved the general reserve and reserve fund management policy to address some <strong>of</strong> thelonger term funding strategies for the <strong>City</strong>, and to ensure good financial and cash management for theongoing financial stability <strong>of</strong> the corporation. In conjunction with investment and debt management policies,this policy will inform decisions relating to long-range financial planning for capital projects to minimize bothdebt servicing costs and significant annual budget impacts by allocating costs to benefiting users over anumber <strong>of</strong> years through the prudent use <strong>of</strong> reserves and reserve funds.<strong>City</strong> <strong>of</strong> <strong>Guelph</strong> – <strong>2013</strong> Financial policy framework45
Financial Policy FrameworkTarget Reserve Levels:Reserves and reserve funds are a critical component <strong>of</strong> the <strong>City</strong>’s long-term financing plan and <strong>of</strong>fer liquidity,which enhances the corporation’s flexibility in addressing operating requirements and in permitting thecorporation to fund capital projects internally. Municipal credit rating agencies recommend a debt to reserveratio <strong>of</strong> $1 in reserves for every $1 in debt.The <strong>City</strong> will take steps to:• Limit its reliance on debt for financing infrastructure and to ensure that the total debt burden <strong>of</strong> themunicipality does not exceed the total <strong>of</strong> all reserves and reserve funds• Ensure working and current-purpose reserves and reserve funds are at least eight per cent to 10 per cent <strong>of</strong>operating revenue• Target lifecycle reserve fund annual contributions to be based on a percentage <strong>of</strong> the value <strong>of</strong> the relevantassets (currently assets valued at historical cost)• 3 per cent buildings• 2–3 per cent transportation, storm water, waste water and water• 10 per cent vehicle and equipmentService-based and Multi-year <strong>Budget</strong>ing – Again this year, the <strong>City</strong> presented service-based enterprisebudgets, and <strong>Guelph</strong> introduced multi-year enterprise budgets in <strong>2013</strong>..<strong>Budget</strong>ing – Council is required to approve a balanced budget each calendar year. The budget is approvedbefore the year commences in a non-election year, and must be finalized before the final tax bills can beissued in an election year. Council also approves a capital budget that identifies the projects to be undertakenduring the year and how they will be funded. The capital budget also provides a forecast <strong>of</strong> projects that willproceed within the 10 years. Regular operating and capital variance reporting is prepared on an annual basis.The <strong>2013</strong> budgets have been segmented by:• Tax-supported capital <strong>2013</strong> budget and 2014 -2022 forecast• Enterprise (non-tax-supported) budgets (operating and capital) – Provincial Offences Court, OntarioBuilding Code, Water Services and Wastewater Services• Tax-supported operating budget• Local Boards and Shared Services (Social Services and Housing, Police Board, Library Board, Health Unit,Downtown Business Improvement Area)<strong>City</strong> <strong>of</strong> <strong>Guelph</strong> – <strong>2013</strong> Financial policy framework46
Financial Policy Framework>> <strong>Budget</strong> PolicyIn July 2011, Council approved the operating and capital budget policy incorporating the following budgetprinciples and strategies used by the <strong>City</strong> in making decisions related to short and long-term budget planning.As well, the budget policy identifies the roles and responsibilities <strong>of</strong> Council and staff.1. Corporate Strategic PlanThe corporate strategic plan serves as the guiding document under which all <strong>City</strong> initiatives are aligned. Thebudget will align with the strategic plan and support it.2. Communication with the CommunityThe budget will provide opportunity for community input and will make available reports consistent withCouncil-approved principles for public involvement.3. AffordabilityThe budget will incorporate an integrated approach to the allocation <strong>of</strong> limited resources. The <strong>City</strong> must beable to bear the cost without incurring financial difficulty or risking other undesirable consequences.4. Fiscal CapacityFiscal capacity will be built to respond to emerging community needs by adhering to the long-term financialplan, related debt, and reserve fund management policies. A strong financial position is an importantcomponent <strong>of</strong> the <strong>City</strong>’s corporate strategic plan.5. SustainabilityThe budget will incorporate a long-term focus with the aim <strong>of</strong> achieving a prosperous and sustainablecommunity. It will reflect priorities based on a quadruple bottom line approach, i.e., showing a commitment toeconomic, social, environmental and cultural aspects.<strong>City</strong> <strong>of</strong> <strong>Guelph</strong> – <strong>2013</strong> Financial policy framework47
Financial Policy Framework6. Accountability and TransparencyThe budget will demonstrate accountability to the community through an open and transparent decisionmakingprocess in addition to audited financial statements and other reporting.7. Assertive MaturityThe budget will demonstrate a culture <strong>of</strong> assertive maturity (going beyond the comfortable role <strong>of</strong> beingsubordinate to upper levels <strong>of</strong> government, and seeing the municipality with real and significant powers tomake policies and deliver services) by:• Providing the funding to deliver services and programs residents want, in an efficient manner thatminimizes risk to the community and corporation• Setting priorities based on innovative and effectively managed policies to achieve <strong>City</strong> goals• Managing our financial relationship with other governments in a proactive manner, demonstratingmunicipal leadership, and advocating obtaining the tools needed to deliver services8. Risk ManagementPriority setting and decision-making will be informed by risk management principles with the aim to minimizethe negative effects <strong>of</strong> risk, while also minimizing the cost to accomplish this mitigation.9. InnovationThe budget will incorporate innovative approaches to service delivery and will include funding to allow for thedevelopment and implementation <strong>of</strong> operational efficiencies and cost-saving measures. Cost-sharing andpartnership strategies will be pursued, including the provision <strong>of</strong> matching funding where leveragingopportunities exist.10. StewardshipThe budget will:• Support existing infrastructure using a life-cycle strategy and asset management best practice• Consider new infrastructure required to achieve the strategic plan• Minimize reliance on debentures by focusing on funding reserves to address the infrastructure gap<strong>City</strong> <strong>of</strong> <strong>Guelph</strong> – <strong>2013</strong> Financial policy framework48
Financial Policy Framework11. Addressing Unfunded LiabilitiesThe budget will address identified unfunded liabilities, such as sick leave or WSIB, through reservecontributions.<strong>City</strong> <strong>of</strong> <strong>Guelph</strong> – <strong>2013</strong> Financial policy framework49
Financial Policy Framework>> Roles and ResponsibilitiesThe following roles have budget responsibilities as listed:Accountability RoleMunicipal CouncilChief Administrative OfficerExecutive Team (ET)Direct Report LeadershipTeam (DRLT)Chief Financial Officer,Financial Planning Staff,and Operating TeamsRole Responsibilities• Establish priorities through the strategic plan• Approve guidelines in advance <strong>of</strong> detailed budget preparation• Approve the proposed level <strong>of</strong> public communication and engagement• Review the budget submission in meetings with the entire Council• Adopt the budget by bylaw• Approve the rates required for taxation and user fees by bylaw• Direct the preparation and presentation <strong>of</strong> the operating and capitalbudgets on an annual basis, in co-operation with the chief financial <strong>of</strong>ficerand the executive team• Direct the preparation <strong>of</strong> a budget guideline for approval by Council, inco-operation with the chief financial <strong>of</strong>ficer and the executive team• Exercise financial control over all corporate operations, in conjunction withthe chief financial <strong>of</strong>ficer to ensure compliance with the revenue andexpenditure budgets approved by Council• Review and recommend the budget to the CAO• Support the final approved budget in a unified manner• Recognize the priorities <strong>of</strong> the corporation as a whole, separate from specificdepartmental priorities, during the decision-making process• Conduct the budget review in an open and collaborative manner• Lead the development <strong>of</strong> realistic and responsible departmental budgets inaccordance with the established guideline, timeline, and process as per thebudget policy• Submit budget requests based on supportable facts that can be wellunderstood by the general public and other members <strong>of</strong> the organization• Ensure that the resources and assets under their authority are effectivelymanaged on an ongoing basis• The chief financial <strong>of</strong>ficer will lead and coordinate the overall preparationand administration <strong>of</strong> the <strong>City</strong> budget and capital program plan• Ensure adherence to budget policies and financial policies as approved byCouncil• Provide management and strategic direction to the financing <strong>of</strong> the <strong>City</strong>• Develop a community engagement plan, related recommendations, andcommunication strategies for Council review and approval<strong>City</strong> <strong>of</strong> <strong>Guelph</strong> – <strong>2013</strong> Financial policy framework50
Financial Policy Framework>> Legislated ResponsibilitiesThe municipality is required by statute <strong>of</strong> the Municipal Act, 2001 to prepare and adopt an annual budget thatincludes estimates <strong>of</strong> all sums required. This includes amounts required to pay debts falling due and includingamounts required for boards, etc. The budget sets out the estimated revenues to be raised through propertytaxes and the portion to be paid into reserves. The budget must be a balanced budget in which estimatedrevenues to be raised through property taxes are equal to the estimates <strong>of</strong> all sums required for expendituresand transfers. Estimated revenues must not include debt proceeds for operating expenditures. Other legislatedresponsibilities with respect to the <strong>City</strong>’s budget include:• The yearly budget must take into account any year-end surplus or deficit <strong>of</strong> a previous year, not alreadyaddressed through a reserve transfer• The municipality may require the budget <strong>of</strong> boards due to bylaw requirements, for which a municipality isrequired to levy taxes or provide money, be submitted by a specified date and in a specified form• A municipality may prepare and adopt a multi-year budget covering a period <strong>of</strong> two to five years, but mustreview and re-adopt the budget for a second and subsequent year<strong>City</strong> <strong>of</strong> <strong>Guelph</strong> – <strong>2013</strong> Financial policy framework51
chapter 4<strong>2013</strong> Tax-supportedOperating <strong>Budget</strong>52
<strong>of</strong>fice <strong>of</strong> the Mayor and <strong>City</strong> Council>> Office <strong>of</strong> the MayorThe Office <strong>of</strong> the Mayor leads and represents the <strong>City</strong> <strong>of</strong> <strong>Guelph</strong> in dealings with citizens, elected <strong>of</strong>ficials,dignitaries, media, as well as other levels <strong>of</strong> government and is committed to providing exceptional service tothe community in ways that are respectful, accessible, fair and transparent.The Office <strong>of</strong> the Mayor supports the Mayor in the execution <strong>of</strong> her duties as articulated in theMunicipal Act, 2001.• Act as Chief Executive Officer <strong>of</strong> the municipality• Uphold and promote the purposes <strong>of</strong> the municipality• Promote public involvement in the municipality’s activities• Act as the representative <strong>of</strong> the municipality both within and outside the municipality, and promote themunicipality locally, nationally and internationally• Participate in and foster activities that enhance the economic, social and environmental well-being <strong>of</strong> themunicipality and its residents• Preside over council meetings so that its business can be carried out efficiently and effectively• Provide leadership to the council• Provide information and recommendations to the council with respect to the role <strong>of</strong> council in ensuringthat administrative policies, practices and procedures and controllership policies, practices and proceduresare in place to implement the decisions <strong>of</strong> council and in ensuring the accountability and transparency <strong>of</strong>the operations <strong>of</strong> the municipality, including the activities <strong>of</strong> the senior management• Represent the municipality at <strong>of</strong>ficial functions• Carry out the duties <strong>of</strong> the head <strong>of</strong> council under this or any other Act<strong>City</strong> <strong>of</strong> <strong>Guelph</strong> – <strong>2013</strong> Tax-supported Operating <strong>Budget</strong>53
<strong>of</strong>fice <strong>of</strong> the Mayor and <strong>City</strong> Council>> Organizational StructureOffice <strong>of</strong> the MayorMayorKaren FarbridgeT 519-837-5643E mayor@guelph.caExecutiveAssistantShelly FriesenT 519-822-1260 x 2286E shelly.friesen@guelph.caCommunicationsAssistantPetronilla NdebeleT 519-822-1260 x 2407E petronilla.ndebele@guelph.caThe Executive Assistant and Communications Assistant provide support to the Mayor in executing her dutiesand managing the services provided by the Office <strong>of</strong> the MayorServices provided by the Executive Assistant include: managing the Mayor’s schedule, constituency andstakeholder relations, program management and <strong>of</strong>fice administration.Services provided by the Communications Assistant include: management <strong>of</strong> internal and externalcommunications, communications planning and program management.<strong>City</strong> <strong>of</strong> <strong>Guelph</strong> – <strong>2013</strong> Tax-supported Operating <strong>Budget</strong>54
<strong>of</strong>fice <strong>of</strong> the Mayor and <strong>City</strong> Council$400,000$350,000$300,000$250,000$200,000$150,000$100,000$50,000$02012 <strong>Budget</strong><strong>2013</strong> RequestedDirect Operating ExpensesCompensation<strong>City</strong> <strong>of</strong> <strong>Guelph</strong> – <strong>2013</strong> Tax-supported Operating <strong>Budget</strong>56
<strong>of</strong>fice <strong>of</strong> the Mayor and <strong>City</strong> CouncilKey changes in <strong>2013</strong>• Increase compensation by $5,492 due to economic increases• Increase purchased goods and services by $310• Decrease internal charges by $400 for paper and print shop services to reflect actual projected usagein 2012<strong>2013</strong> Operating <strong>Budget</strong>2012<strong>Budget</strong><strong>2013</strong>Base<strong>Budget</strong><strong>2013</strong>Eff/New/GrowthImpact fromCapital<strong>2013</strong>Requested<strong>Budget</strong><strong>2013</strong><strong>Budget</strong>Change $<strong>2013</strong><strong>Budget</strong>Change %CAO11 MayorRevenueTotal Revenue $0 0 $0 $0 $0 0.0%ExpenditureSalary, Wage & Benefits 308,268 313,760 0 313,760 5,492 1.8%Purchased Goods 20,440 21,900 0 21,900 1,460 7.1%Purchased Services 17,400 16,250 0 16,250 (1,150) (6.6%)Total Expenditure 346,108 351,910 0 351,910 5,802 1.7%Net Before Internal Charges & Recoveries 346,108 351,910 0 351,910 5,802 1.7%Internal Charges & RecoveriesInternal Charges 1,300 900 0 900 (400) (30.8%)Total Internal Charges & Recoveries 1,300 900 0 900 (400) (30.8%)Net <strong>Budget</strong> 347,408 352,810 0 352,810 5,402 1.6%<strong>City</strong> <strong>of</strong> <strong>Guelph</strong> – <strong>2013</strong> Tax-supported Operating <strong>Budget</strong>57
<strong>of</strong>fice <strong>of</strong> the Mayor and <strong>City</strong> Council>> <strong>City</strong> CouncilThe <strong>City</strong> Council budget provides resources to support the role <strong>of</strong> members <strong>of</strong> Council in fulfilling their dutiesunder the Municipal Act and includes compensation, <strong>of</strong>fice supplies, communications and pr<strong>of</strong>essionaldevelopment and training. The role <strong>of</strong> Council is articulated in the Municipal Act, 2001:• Represent the public• Consider the well-being and interests <strong>of</strong> the municipality• Develop and evaluate municipal policies and programs• Determine which services the municipality provides• Ensure administrative and controllership policies, practices and procedures are in place to implement• Council decisions• Ensure accountability and transparency <strong>of</strong> municipal operations• Maintain the financial integrity <strong>of</strong> the municipality• Carry out the duties <strong>of</strong> Council under this and any other ActFinancial Snapshot2012<strong>Budget</strong><strong>2013</strong>RequestedYear/YearIncrease ($)Year/YearIncrease (%)<strong>City</strong> Council $522,250 $533,520 $11,270 2.2% 100.0%Funding SourcesTax-supported % User Fee % Grants %<strong>City</strong> <strong>of</strong> <strong>Guelph</strong> – <strong>2013</strong> Tax-supported Operating <strong>Budget</strong>58
<strong>of</strong>fice <strong>of</strong> the Mayor and <strong>City</strong> CouncilCouncillorsWard 1Bob BellRe-elected Councillor in 2010T 519-822-6152E bob.bell@guelph.caJim J. FurfaroElected Councillor in 2010T 519-822-1260 x 2502E jim.furfaro@guelph.caWard 2Andy Van HellemondElected Councillor in 2010T 519-822-1260 x 2503E andy.vanhellemond@guelph.caIan FindlayRe-elected Councillor in 2010T 519-830-4681E ian.findlay@guelph.caWard 3June H<strong>of</strong>landRe-elected Councillor in 2010T 519-822-1260 x 2505E june.h<strong>of</strong>land@guelph.caMaggie LaidlawRe-elected Councillor in 2010T 519-822-1260 x 2510E maggie.laidlaw@guelph.caWard 4Cam GuthrieElected Councillor in 2010T 519-822-1260 x 2513E cam.guthrie@guelph.caGloria KovachRe-elected Councillor in 2010T 519-822-1260 x 2512E gloria.kovach@guelph.caWard 5Lise BurcherRe-elected Councillor in 2010T 519-822-1260 x 2294E lise.burcher@guelph.caLeanne PiperRe-elected Councillor in 2010T 519-822-1260 x 2295E leanne.piper@guelph.caWard 6Todd DennisElected Councillor in 2010T 519-822-1260 x 2296E todd.dennis@guelph.caKarl WettsteinRe-elected Councillor in 2010T 519-763-5105E karl.wettstein@guelph.ca<strong>City</strong> <strong>of</strong> <strong>Guelph</strong> – <strong>2013</strong> Tax-supported Operating <strong>Budget</strong>59
<strong>of</strong>fice <strong>of</strong> the Mayor and <strong>City</strong> Council2012 Accomplishments• Approved the 2012-2016 Corporate Strategic Plan Framework to guide the corporation for the next fouryears• Approved strategic priorities for 2012• Appointed an Internal Auditor position to strengthen operational performance, risk management andinternal controls<strong>2013</strong> Objectives• Approve strategic priorities for <strong>2013</strong>-2016• Implementation <strong>of</strong> the Corporate Strategic Plan (2012-2016)Key changes in <strong>2013</strong>• Purchased goods and services have decreased by $490 over 2012<strong>City</strong> <strong>of</strong> <strong>Guelph</strong> – <strong>2013</strong> Tax-supported Operating <strong>Budget</strong>60
<strong>of</strong>fice <strong>of</strong> the Mayor and <strong>City</strong> Council$600,000$500,000$400,000$300,000$200,000$100,000$02012 <strong>Budget</strong><strong>2013</strong> Requested<strong>City</strong> <strong>of</strong> <strong>Guelph</strong> – <strong>2013</strong> Tax-supported Operating <strong>Budget</strong>61
<strong>of</strong>fice <strong>of</strong> the Mayor and <strong>City</strong> Council<strong>2013</strong> Operating <strong>Budget</strong>2012<strong>Budget</strong><strong>2013</strong>Base<strong>Budget</strong><strong>2013</strong>Eff/New/GrowthImpact fromCapital<strong>2013</strong>Requested<strong>Budget</strong><strong>2013</strong><strong>Budget</strong>Change $<strong>2013</strong><strong>Budget</strong>Change %CAOCouncilRevenueTotal Revenue $0 0 $0 $0 $0 0.0%ExpenditureSalary, Wage & Benefits 437,760 449,520 0 449,520 11,760 2.7%Purchased Goods 2,200 1,200 0 1,200 (1,000) (45.5%)Purchased Services 82,290 82,800 0 82,800 510 0.6%Total Expenditure 522,250 533,520 0 533,520 11,270 2.2%Net Before Internal Charges & Recoveries 522,250 533,520 0 533,520 11,270 2.2%Internal Charges & RecoveriesInternal Charges 0 0 0 0 0 0.0%Total Internal Charges & Recoveries 0 0 0 0 0 0.0%Net <strong>Budget</strong> 522,250 533,520 0 533,520 11,270 2.2%<strong>City</strong> <strong>of</strong> <strong>Guelph</strong> – <strong>2013</strong> Tax-supported Operating <strong>Budget</strong>62
Office <strong>of</strong> the Chief Administrative OfficerWithin the authorities delegated by <strong>City</strong> Council, this <strong>of</strong>fice leads the administration <strong>of</strong> the <strong>City</strong> <strong>of</strong> <strong>Guelph</strong> toachieve its mission to build an exceptional <strong>City</strong> by providing outstanding municipal service and value. TheOffice <strong>of</strong> the CAO provides leadership and oversight to Strategic Planning and Corporate Initiatives, theInternal Auditor and the Executive Team.• Provide information and advice to Council for the purposes <strong>of</strong> decision making and by-law approvals• Facilitate the implementation <strong>of</strong> Council decisions• Provide leadership and direction to the organization for the purpose <strong>of</strong> administrating the business affairs <strong>of</strong>the corporation and reporting on its performance• Attend to the interests <strong>of</strong> the corporation on federal, provincial, regional or local intergovernmental matters• Build partnerships and pr<strong>of</strong>essional relationships• Develop strategic plans, principles and policies that position the corporation• Address strategic issues and lead special corporate initiatives• Provide independent assurance and consulting function to the corporation for evaluating and improvingthe effectiveness <strong>of</strong> risk management, control, and governance processesOrganizational StructureOffice <strong>of</strong> the Chief Administrative OfficerChief Administrative OfficerAnn PappertT 519-822-1260 x 2221E ann.pappert@guelph.caExecutive AssistantSheila PrickettT 519-822-1260 x 2220E sheila.prickett@guelph.caInternalAuditInternal AuditorLoretta AlonzoT 519-822160 x 2243E loretta.alonzo@guelph.caStrategic Planning andCorporate InitiativesCorporate ManagerBrenda BoisvertT 519-822-1260 x 2255E brenda.boisvert@guelph.ca<strong>City</strong> <strong>of</strong> <strong>Guelph</strong> – <strong>2013</strong> Tax-supported Operating <strong>Budget</strong>63
Office <strong>of</strong> the Chief Administrative OfficerFinancial SnapshotOffice <strong>of</strong> the ChiefAdministrative Officer2012<strong>Budget</strong><strong>2013</strong>RequestedYear/YearIncrease ($)Year/YearIncrease (%)$823,880 $962,600 $138,720 16.8% 100.0%Funding SourcesTax-supported % User Fee % Grants %2012 Accomplishments• Provided leadership and support to the Employee Engagement Survey resulting in 77% participation rate• Completed the Corporate Strategic Plan (CSP) Framework and launched the 2012 Strategic Initiativesensuring the CSP served to meet Council’s vision for <strong>Guelph</strong>• Completed the Corporate Strategic Plan <strong>2013</strong>-16 work plan working collaboratively with Executive Teamand Direct Report Leadership Team subcommittees• Sought administrative alignments across service areas through an extensive review <strong>of</strong> existing service areawork plans, outstanding motions/directions from Council, and general project lists• Established the Enterprise Risk Management Framework• Established the Audit Framework and Internal Auditor Charter• Evaluated and refined the corporation’s organizational structure, creating the Finance and Enterprise ServiceArea• Established key performance measures for the Corporate Strategic Plan Framework• Contributed to Making a difference together: a community and financial report• Developed an approach for corporate performance reporting• Exercised financial control over corporate operations, in conjunction with the Executive Team, to ensurecompliance with annual estimates <strong>of</strong> revenue and expenditure approved by Council• Implemented <strong>Guelph</strong> Municipal Holdings Inc. work plan in conjunction with Finance and EnterpriseServices and Corporate and Human Resources (Legal Services)• Presented corporate perspective and information to a range <strong>of</strong> internal and external stakeholders andcitizensKey Performance MeasuresThe Office <strong>of</strong> the Chief Administrative Officer key performance measures are the Corporate Strategic Plan keyperformance indicators presented to <strong>City</strong> Council.<strong>City</strong> <strong>of</strong> <strong>Guelph</strong> – <strong>2013</strong> Tax-supported Operating <strong>Budget</strong>64
Office <strong>of</strong> the Chief Administrative Officer<strong>2013</strong> Objectives• Successful achievement <strong>of</strong> CSP <strong>2013</strong> key strategic initiatives ensuring employees are engaged and buildingleadership capacity• Further clarify and refine <strong>of</strong> roles <strong>of</strong> the Executive Team and Direct Report Leadership Team to supportcollaborative work teams and the application <strong>of</strong> whole system thinking to deliver creative solutions• Develop a management set <strong>of</strong> principles aligned to the Governance Framework <strong>of</strong> <strong>City</strong> Council• To further the corporate commitment to system optimization and cost avoidance by implementing the2012 approved Audit Review Framework• Provide CSP progress reporting and implementing annual reporting on key performance measures• Further the corporate commitment to accountability and transparency through processes and practicesthat identify and mitigate risk by implementing the Risk Management Framework• Responsive and proactive management <strong>of</strong> issues and appropriate resolutions• Contribute to economic prosperity by enhancing <strong>Guelph</strong>’s image as a leading community in which to resideand locate business• Position the corporation to increase opportunities for innovation, engagement and partnerships byincreasing our communication with citizens, stakeholders and building our intergovernmental networksand relationshipsKey Changes in <strong>2013</strong>• Increase purchased services $301,300 primarily due to the roll out <strong>of</strong> the Corporate Strategic Plan relating topublic affairs and internal audit• Decrease internal charges by $17,050 primarily due to the reduction in transfer to reserves for futureexpenditures relating to Strategic Planning• Increase compensation by $164,370 due to the approval <strong>of</strong> one FTE relating to the CSP as well as economicincreases<strong>City</strong> <strong>of</strong> <strong>Guelph</strong> – <strong>2013</strong> Tax-supported Operating <strong>Budget</strong>65
Office <strong>of</strong> the Chief Administrative Officer$800,000Year/Year Expenditure Comparison$700,000$600,000$500,000$400,000$300,000$200,000$100,000$0Salary, wages and benefitsPurchased goodsPurchased servicesInternal charges2012 <strong>2013</strong><strong>City</strong> <strong>of</strong> <strong>Guelph</strong> – <strong>2013</strong> Tax-supported Operating <strong>Budget</strong>66
Office <strong>of</strong> the Chief Administrative Officer<strong>2013</strong> Operating <strong>Budget</strong>2012<strong>Budget</strong><strong>2013</strong>Base<strong>Budget</strong><strong>2013</strong>Eff/New/GrowthImpact fromCapital<strong>2013</strong>Requested<strong>Budget</strong><strong>2013</strong><strong>Budget</strong>Change $<strong>2013</strong><strong>Budget</strong>Change %CAO10 CAO AdministrationRevenueExternal Recoveries $0 0 $0 $0 $0 0.0%Total Revenue 0 0 0 0 0 0.0%ExpenditureSalary, Wage and Benefits 663,110 711,580 115,900 827,480 164,370 24.8%Purchased Goods 12,700 22,800 0 22,800 10,100 79.5%Purchased Services 126,720 326,520 101,500 428,020 301,300 237.8%Total Expenditure 802,530 1,060,900 217,400 1,278,300 475,770 59.3%Net Before Internal Charges and Recoveries 802,530 1,060,900 217,400 1,278,300 475,770 59.3%Internal Charges and RecoveriesInternal Charges 21,350 1,700 2,600 4,300 (17,050) (79.9%)Internal Recoveries 0 (220,000) (100,000) (320,000) (320,000) (100.0%)Total Internal Charges & Recoveries 21,350 (218,300) (97,400) (315,700) (337,050) (1,578.7%)Net <strong>Budget</strong> 823,880 842,600 120,000 962,600 138,720 16.8%<strong>City</strong> <strong>of</strong> <strong>Guelph</strong> – <strong>2013</strong> Tax-supported Operating <strong>Budget</strong>67
Planning, Building, Engineering and EnvironmentDepartments in the Planning, Building, Engineering and Environment Service Area work to ensure <strong>Guelph</strong> is anappealing, enjoyable, safe and inclusive place to live, study, work and visit. Four tax-supported departments—Planning Services, Building Services, Engineering Services and Solid Waste Resources—manage criticalmunicipal policies, programs, services and infrastructure, designed to build a thriving future for <strong>Guelph</strong>.NOTE: <strong>Guelph</strong>’s Water and Wastewater Services and Ontario Building Code Administration also fall under this service area, and arerepresented in <strong>Guelph</strong>’s enterprise-funded budgets (non tax-supported).Organizational StructurePlanning, Building, Engineering and EnvironmentExecutive DirectorJanet LairdT 519-822-1260 x 2237E janet.laird@guelph.caExecutive AssistantLinda RamseyT 519-822-1260 x 2245E linda.ramsey@guelph.caBuilding ServicesGeneral Manager/Chief Building OfficialBruce PooleT 519-822-1260 x 2375E bruce.poole@guelph.caEngineering ServicesGeneral Manager/<strong>City</strong> EngineerRichard HenryT 519-822-1260 x 2248E richard.henry@guelph.caPlanning ServicesGeneral ManagerTodd SalterT 519-822-1260 x 2395E todd.salter@guelph.caSolid Waste ResourcesGeneral ManagerDean WymanT 519-822-1260 x 2053E dean.wyman@guelph.caWastewater ServicesGeneral ManagerKiran SureshT 519-822-1260 x 2960E kiran.suresh@guelph.caWater ServicesGeneral ManagerPeter BusattoT 519-822-1260 x 2165E peter.busatto@guelph.caPermit and Zoning ServicesInspection ServicesInfrastructure Planning, Designand ConstructionTransportation andDevelopment EngineeringDevelopment PlanningPolicy Planning andUrban DesignIntegrated ServicesMaterial Recovery OperationsOrganic Waste ProcessingWaste CollectionCollection and EnvironmentalProtectionOperationsPlant Maintenance andLaboratory ServicesAdministrationWater ConservationWater DistributionWater Supply<strong>City</strong> <strong>of</strong> <strong>Guelph</strong> – <strong>2013</strong> Tax-supported Operating <strong>Budget</strong>68
Planning, Building, Engineering and EnvironmentFinancial SnapshotPlanning, Building,Engineering andEnvironment2012<strong>Budget</strong><strong>2013</strong>RequestedYear/YearIncrease ($)Year/YearIncrease (%)Funding SourcesTax-supported % User Fee % Grants %$14,527,971 $14,689,890 $161,919 1.1% 54.6% 41.2% 4.2%2012 Accomplishments• Collaboration between Water Services, Planning Services and Building Services departments on the SourceWater Protection initiative, as required under the Clean Water Act• Completed Phase 2 <strong>of</strong> the Joint Operational Review <strong>of</strong> the development application review process asmanaged collaboratively by the Planning, Building, Engineering and Economic Development departments• Collaborated with several <strong>City</strong> departments to investigate options to license, or otherwise address, sharedrental housing issues• Completed Official Plan Update Phase 3, OPA 48 and Downtown Secondary Plan, OPA 43• Substantially completed design-build and commissioning <strong>of</strong> Organic Waste Processing Facility (OWPF)• Implemented Phase 1 <strong>of</strong> conversion to automated cart-based waste collection, reducing annual operatingcosts and greenhouse gas emissions<strong>2013</strong> Objectives• Initiate planning for implementation <strong>of</strong> the Lake Erie Source Water Protection Plan for <strong>Guelph</strong>• Implement recommendations <strong>of</strong> Joint Operational Review to strengthen relationships with thedevelopment community and improve service to the public• Continue collaboration between <strong>City</strong> departments to review and develop Shared Rental Housing licensingoptions• Work towards full approval and implementation <strong>of</strong> all Official Plan Amendments; policies designed topromote economic vitality and innovation, protect preserve and enhance <strong>Guelph</strong>’s natural assets andsupport community well-being• Complete interior renovation <strong>of</strong> VIA Station to integrate <strong>Guelph</strong> Transit, GO Transit, Greyhound Coach Linesand VIA Rail service at <strong>Guelph</strong> Central Station and improve connections between local, regional andnational public transit systems• Implement Phase 2 <strong>of</strong> waste cart roll-out to realize $400,000 annual cost-savings by 2015• Update Solid Waste Master Plan to achieve <strong>Guelph</strong>’s waste diversion target <strong>of</strong> 65% by the end <strong>of</strong> 2016<strong>City</strong> <strong>of</strong> <strong>Guelph</strong> – <strong>2013</strong> Tax-supported Operating <strong>Budget</strong>69
Planning, Building, Engineering and Environment>> AdministrationPlanning, Building, Engineering and Environment Administration provides leadership and oversight to all sixdepartments and encourages employees to find innovative and creative ways to deliver public services better.Financial SnapshotPlanning, Building,Engineering andEnvironmentAdministration2012<strong>Budget</strong><strong>2013</strong>RequestedYear/YearIncrease ($)Year/YearIncrease (%)$345,500 $426,200 $80,700 23.4% 100.0%Funding SourcesTax-supported % User Fee % Grants %Key Changes in <strong>2013</strong>• Increase internal recoveries by $18,700 or 15.5% mainly due to a reallocation <strong>of</strong> a recovery from the OntarioBuilding Code Administration ($16,300)• Increase purchase services by $76,600 or 93.7% to reflect the costs <strong>of</strong> the Joint Operational Review process<strong>City</strong> <strong>of</strong> <strong>Guelph</strong> – <strong>2013</strong> Tax-supported Operating <strong>Budget</strong>70
Planning, Building, Engineering and Environment$450,000$400,000Year/Year Expenditure Comparison$350,000$300,000$250,000$200,000$150,000$100,000$50,000$0Salary, wages and benefitsPurchased goodsPurchased servicesInternal charges2012 <strong>2013</strong><strong>City</strong> <strong>of</strong> <strong>Guelph</strong> – <strong>2013</strong> Tax-supported Operating <strong>Budget</strong>71
Planning, Building, Engineering and EnvironmentYear/Year Revenue Comparison$145,000$140,000$135,000$130,000$125,000$120,000$115,000$110,000Internal recoveries2012 <strong>2013</strong><strong>City</strong> <strong>of</strong> <strong>Guelph</strong> – <strong>2013</strong> Tax-supported Operating <strong>Budget</strong>72
Planning, Building, Engineering and Environment<strong>2013</strong> Operating <strong>Budget</strong>2012<strong>Budget</strong><strong>2013</strong>Base<strong>Budget</strong><strong>2013</strong>Eff/New/GrowthImpact fromCapital<strong>2013</strong>Requested<strong>Budget</strong><strong>2013</strong><strong>Budget</strong>Change $Planning, Building, Engineering, Environment30 PBEE AdministrationRevenueExternal Recoveries $0 0 $0 $0 $0 0%Total Revenue 0 0 0 0 0 0%ExpenditureSalary, Wage & Benefits 372,510 391,710 0 391,710 19,200 5.2%Purchased Goods 11,500 11,900 0 11,900 400 3.5%Purchased Services 81,790 83,390 75,000 158,390 76,600 93.7%Total Expenditure 465,800 487,000 75,000 562,000 96,200 20.7%Net Before Internal Charges & Recoveries 465,800 487,000 75,000 562,000 96,200 20.7%Internal Charges & RecoveriesInternal Charges 500 3,700 0 3,700 3,200 640.0%Internal Recoveries (120,800) (139,500) 0 (139,500) (18,700) 15.5%Total Internal Charges & Recoveries (120,300) (135,800) 0 (135,800) (15,500) 12.9%Net <strong>Budget</strong> 345,500 351,200 75,000 426,200 80,700 23.4%<strong>2013</strong><strong>Budget</strong>Change %<strong>City</strong> <strong>of</strong> <strong>Guelph</strong> – <strong>2013</strong> Tax-supported Operating <strong>Budget</strong>73
Planning, Building, Engineering and Environment>> Planning ServicesPlanning Services works with several <strong>City</strong> departments and engages community stakeholders to ensure<strong>Guelph</strong> continues to be a vibrant, accessible, inclusive and beautiful city that attracts residents, businesses andvisitors. Both the Development Planning and the Policy Planning and Urban Design divisions within thedepartment serve residential and commercial development sectors to build a thriving future for <strong>Guelph</strong>.Development Planning• Process approvals for Official Plan and Zoning By-law amendments• Process approvals for site plans, subdivisions, condominiums• Review and comment on Committee <strong>of</strong> Adjustment applications and minor variances to addresscompliance with relevant planning policies• Part lot control approvals• Provide advice and information to the development community and public regarding <strong>City</strong> land useplanning policies and procedures• Environmental review <strong>of</strong> development applicationsPolicy Planning and Urban Design• Prepare Official Plan updates and Secondary Plans to ensure compliance with provincial and federallegislation and to reflect the community’s values and aspirations• Develop and implement urban design policies and guidelines to ensure new development meets <strong>Guelph</strong>’sgoals for a well-designed, safe, inclusive, appealing and sustainable city• Data and statistical information analysis to support planning projects• Review and prepare environmental policies to protect and enhance <strong>Guelph</strong>’s natural assets including rivers,waterways, urban forest and other naturalized spaces• Heritage planning to protect and preserve <strong>Guelph</strong>’s cultural assets and places <strong>of</strong> historic significanceFinancial Snapshot2012<strong>Budget</strong><strong>2013</strong>RequestedYear/YearIncrease ($)Year/YearIncrease (%)Funding SourcesTax-supported % User Fee % Grants %Planning Services $1,704,822 $1,728,910 $24,088 1.4% 70.1% 29.9%<strong>City</strong> <strong>of</strong> <strong>Guelph</strong> – <strong>2013</strong> Tax-supported Operating <strong>Budget</strong>74
Planning, Building, Engineering and Environment2012 Accomplishments• Completed Official Plan Update Phase 3, OPA 48, and submitted to the Province for approval: the planincludes updated policies to create new neighbourhoods that contain a mix <strong>of</strong> uses, are walkable andtransit supportive; promote economic vitality and innovation; support social well-being, including planningfor a diversity <strong>of</strong> housing types, affordability and tenure• Completed Downtown Secondary Plan, OPA 43, and began development implementation strategy(business plan) to attract more people and jobs to downtown• Released draft <strong>Guelph</strong> Innovation District Secondary Plan and continued to work with Province and otherpartners on overall development strategy to achieve long-term growth management and economicdevelopment objectives• Completed major policy/program initiatives including the <strong>City</strong>’s first Urban Forest Management Plan, andthe Brownfield Redevelopment Community Improvement Plan update• Processed more than 300 subdivision, site plan, zone change, Official Plan Amendment and Committee <strong>of</strong>Adjustment applications• Encouraged remediation and redevelopment <strong>of</strong> potentially contaminated properties to reduceenvironmental impacts, enhance neighbourhoods and increase property values by implementing theBrownfield Redevelopment Community Improvement Plan and processing incentive applications<strong>City</strong> <strong>of</strong> <strong>Guelph</strong> – <strong>2013</strong> Tax-supported Operating <strong>Budget</strong>75
Planning, Building, Engineering and EnvironmentKey Performance MeasuresNumber <strong>of</strong> submissions for every approved application per year20112010Number <strong>of</strong> submisions200920080 24 6 810 12 14 16 18Number <strong>of</strong> applications6 Sub 5 Sub 4 Sub 3 Sub 2 Sub 1 SubTrends from 2008 to 2011:No approved application has taken more than 6 (5%) submissions to achieve Site Plan Approval. The majority<strong>of</strong> applications were approved in 2 (38%) or 3 (41%) submissions. The number <strong>of</strong> submissions depends on thecomplexity <strong>of</strong> the application and the quality <strong>of</strong> the submission.The number <strong>of</strong> applications reviewed by staff in any given year does not significantly affect the number <strong>of</strong>submissions required before granting Site Plan Approval.<strong>City</strong> <strong>of</strong> <strong>Guelph</strong> – <strong>2013</strong> Tax-supported Operating <strong>Budget</strong>76
Planning, Building, Engineering and EnvironmentAverage time (days) to achieve approval2001501005002010 2011Average days toachieve approvalTrends <strong>of</strong> 2010 - 2011:The average time to achieve approval in 2011 was 108 calendar days (i.e. includes holidays and weekends), thisis a reduction <strong>of</strong> 39 days from 2010. Of the 108 calendar days, the submissions spent 52 days with theapplicant, and 56 days with <strong>City</strong> staff.<strong>City</strong> <strong>of</strong> <strong>Guelph</strong> – <strong>2013</strong> Tax-supported Operating <strong>Budget</strong>77
Planning, Building, Engineering and EnvironmentAverage number <strong>of</strong> submissions to achieve approval432102008 2009 2010 2011Average number <strong>of</strong> submissionsTrends from 2008 to 2011:The average number <strong>of</strong> submissions in 2011 was 3 per application, (one preliminary submission; one formalapplication and one resubmission). This is less than the number <strong>of</strong> submissions per application in 2009 and2010. 3 submissions is equivalent to 56 calendar days for review by staff<strong>City</strong> <strong>of</strong> <strong>Guelph</strong> – <strong>2013</strong> Tax-supported Operating <strong>Budget</strong>78
Planning, Building, Engineering and Environment<strong>2013</strong> Objectives• Continue to collaborate with <strong>City</strong> departments to review and develop shared rental housing licensinggroup• Collaborate with other departments to review development applications in an efficient and effectivemanner• Implement recommendations <strong>of</strong> Joint Operational Review for Planning, Building, Engineering andEconomic Development departments to improve service to residential and commercial developmentsectors and the community• Work towards full approval and implementation <strong>of</strong> all Official Plan Amendments either under appeal to theOntario Municipal Board or being reviewed by the Province; Natural Heritage System (OPA 42), DowntownSecondary Plan (OPA 43), and the Official Plan Update Phase 3 (OPA 48)• Collaborate with other departments in the implementation <strong>of</strong> new policies and programs, including theUrban Forest Management Plan (subject to budget), Source Water Protection Planning and the BrownfieldRedevelopment Community Improvement Plan updateKey Changes in <strong>2013</strong>• Increase revenue by $25,300 or 4.3%, consistent with the 2012 increase <strong>of</strong> the DC Inflation Index which istied to the Toronto Construction Index<strong>City</strong> <strong>of</strong> <strong>Guelph</strong> – <strong>2013</strong> Tax-supported Operating <strong>Budget</strong>79
Planning, Building, Engineering and Environment$700,000Year/Year Revenue Comparison$600,000$500,000$400,000$300,000$200,000$100,000$0User fees and service chargesProduct salesExternal recoveries2012 <strong>2013</strong><strong>City</strong> <strong>of</strong> <strong>Guelph</strong> – <strong>2013</strong> Tax-supported Operating <strong>Budget</strong>80
Planning, Building, Engineering and Environment$2,500,000Year/Year Expenditure Comparison$2,000,000$1,500,000$1,000,000$500,000$0Salary, wages and benefitsPurchased goodsPurchased servicesInternal charges<strong>City</strong> <strong>of</strong> <strong>Guelph</strong> – <strong>2013</strong> Tax-supported Operating <strong>Budget</strong>81
Planning, Building, Engineering and Environment>> Building ServicesEssential to city-building and ensuring attractive, safe and well-designed neighbourhoods, the <strong>City</strong>’s BuildingServices department authorizes all building construction and demolition in <strong>Guelph</strong>. The department is activelyassessing and modernizing its business systems to improve service to residential, commercial, industrial andinstitutional building sectors.• Administer and enforce the following <strong>City</strong> by-laws; zoning, property standards, yard maintenance, standingwater, swimming pool, sign and two-unit house registration• Facilitate <strong>Guelph</strong>’s Committee <strong>of</strong> Adjustment with processing requests for variances to the zoning by-lawand consent (severances) applications• Manage <strong>Guelph</strong>’s termite control and backflow prevention programsFinancial Snapshot2012<strong>Budget</strong><strong>2013</strong>RequestedYear/YearIncrease ($)Year/YearIncrease (%)Funding SourcesTax-supported % User Fee % Grants %Building $1,014,760 $1,050,750 $35,990 3.5% 75.9% 24.1%2012 Accomplishments• Collaborated with <strong>City</strong> departments to investigate options to license or otherwise address shared rentalhousing issues• Contributed to Joint Operational Review <strong>of</strong> <strong>Guelph</strong>’s Economic Development, Planning, Building andEngineering Services development application review process• Enhanced existing Building Services Code <strong>of</strong> Conduct by making it more accessible to the public andincluding a formal process for lodging and investigating complaints• Collaborated with Water Services and Planning Services departments on Source Water Protection initiative<strong>City</strong> <strong>of</strong> <strong>Guelph</strong> – <strong>2013</strong> Tax-supported Operating <strong>Budget</strong>83
Planning, Building, Engineering and EnvironmentKey Performance MeasuresProperty standards and yard maintenance complaints1200100080060040020002009 2010 2011 2012Estimated<strong>2013</strong>ProjectedAnnual totalsRemedial work<strong>City</strong> <strong>of</strong> <strong>Guelph</strong> – <strong>2013</strong> Tax-supported Operating <strong>Budget</strong>84
Planning, Building, Engineering and EnvironmentPercentage <strong>of</strong> complaint responses inthree days or less (Service Standard)100%80%83%86%89%94%97%60%40%20%0%2009 2010 2011 2012 <strong>2013</strong>Estimated ProjectedNote: Online services started June, 2009<strong>City</strong> <strong>of</strong> <strong>Guelph</strong> – <strong>2013</strong> Tax-supported Operating <strong>Budget</strong>85
Planning, Building, Engineering and EnvironmentOn-line permit applications(residential building permits, swimming pools and mobile signs)600500576512560 56040030020023310002009 2010 2011 2012 <strong>2013</strong>EstimatedProjected<strong>City</strong> <strong>of</strong> <strong>Guelph</strong> – <strong>2013</strong> Tax-supported Operating <strong>Budget</strong>86
Planning, Building, Engineering and EnvironmentOn-line inspection requests(residential building permits and swimming pools)1,2001,083 1,0901,000926 92680060040026220002009 2010 2011 2012 <strong>2013</strong>EstimatedProjected<strong>City</strong> <strong>of</strong> <strong>Guelph</strong> – <strong>2013</strong> Tax-supported Operating <strong>Budget</strong>87
Planning, Building, Engineering and EnvironmentOn-line page views for permits and inspections(applying and status review)9,0008,0008,500 8,5007,0006,0006,510 6,6835,0004,0003,0003,1372,0001,00002009 2010 2011 2012 <strong>2013</strong>Estimated Projected<strong>City</strong> <strong>of</strong> <strong>Guelph</strong> – <strong>2013</strong> Tax-supported Operating <strong>Budget</strong>88
Planning, Building, Engineering and Environment$2,500,000Year/Year Revenue Comparison$2,000,000$1,500,000$1,000,000$500,000$0User fees and service chargesLicenses and permitsInternal recoveries2012 <strong>2013</strong><strong>City</strong> <strong>of</strong> <strong>Guelph</strong> – <strong>2013</strong> Tax-supported Operating <strong>Budget</strong>90
Planning, Building, Engineering and Environment$4,000,000Year/Year Expenditure Comparison$3,500,000$3,000,000$2,500,000$2,000,000$1,500,000$1,000,000$500,000$0Salary, wages and benefitsPurchased goodsPurchased servicesFinancial expensesInternal charges2012 <strong>2013</strong><strong>City</strong> <strong>of</strong> <strong>Guelph</strong> – <strong>2013</strong> Tax-supported Operating <strong>Budget</strong>91
Planning, Building, Engineering and Environment<strong>2013</strong> Operating <strong>Budget</strong>2012<strong>Budget</strong><strong>2013</strong>Base<strong>Budget</strong><strong>2013</strong>Eff/New/GrowthImpact fromCapital<strong>2013</strong>Requested<strong>Budget</strong><strong>2013</strong><strong>Budget</strong>Change $Planning, Building, Engineering, Environment32 BuildingRevenueUser Fees & Service Charges ($165,500) (199,500) $0 ($199,500) ($34,000) 20.5%Licenses & Permits (130,000) (135,000) 0 (135,000) (5,000) 3.8%Total Revenue (295,500) (334,500) 0 (334,500) (39,000) 13.2%ExpenditureSalary, Wage & Benefits 2,998,508 3,078,450 370,800 3,449,250 450,742 15.0%Purchased Goods 47,432 39,100 5,400 44,500 (2,932) (6.2%)Purchased Services 26,200 30,700 200 30,900 4,700 17.9%Financial Expenses 500 500 0 500 0 0.0%Total Expenditure 3,072,640 3,148,750 376,400 3,525,150 452,510 14.7%Net Before Internal Charges & Recoveries 2,777,140 2,814,250 376,400 3,190,650 413,510 14.9%Internal Charges & RecoveriesInternal Charges 138,900 190,900 3,600 194,500 55,600 40.0%Internal Recoveries (1,901,280) (1,982,800) (351,600) (2,334,400) (433,120) 22.8%Total Internal Charges & Recoveries (1,762,380) (1,791,900) (348,000) (2,139,900) (377,520) 21.4%Net <strong>Budget</strong> 1,014,760 1,022,350 28,400 1,050,750 35,990 3.5%<strong>2013</strong><strong>Budget</strong>Change %<strong>City</strong> <strong>of</strong> <strong>Guelph</strong> – <strong>2013</strong> Tax-supported Operating <strong>Budget</strong>92
Planning, Building, Engineering and Environment>> Engineering ServicesIn collaboration with several <strong>City</strong> departments and community stakeholders, Engineering Services ensures<strong>Guelph</strong> is a well-designed safe, appealing and sustainable city. The department plans, designs, builds andrenews <strong>Guelph</strong>’s roads, storm sewers, watermains, sanitary sewers and sidewalks. The department alsoprovides engineering expertise when building new <strong>City</strong> facilities, and reviewing development plans.Engineering Services also leads <strong>Guelph</strong>’s transportation planning and programs designed to reduce <strong>Guelph</strong>’senergy consumption and greenhouse gas emissions as part <strong>of</strong> the Community Energy Initiative.Financial Snapshot2012<strong>Budget</strong><strong>2013</strong>RequestedYear/YearIncrease ($)Year/YearIncrease (%)Funding SourcesTax-supported % User Fee % Grants %Engineering Services $840,665 $876,015 $35,350 4.2% 22.6% 77.4%2012 Accomplishments• Continued collaboration with GO Transit, Greyhound Coach Lines, VIA Rail to integrate public transportationService at <strong>Guelph</strong> Central Station• Assisted Ministry <strong>of</strong> Transportation reuse 230,000 cubic metres <strong>of</strong> construction fill material to build LairdRoad interchange on the Hanlon Expressway; engaged area residents and Ministry <strong>of</strong> Environment toexplain activities and benefits including reduced trucking distances, greenhouse emissions, and projectcosts• Completed water model calibration to ensure proper water pressure and flow• Completed Inflow and Infiltration study to identify and correct potential blockages or disruptions in storm/sanitary sewers• Completed Cycling Master Plan including recommendations to implement the Bicycle-Friendly <strong>Guelph</strong>Initiative and reach <strong>Guelph</strong>’s goal to triple the number <strong>of</strong> daily cycling trips by 2018• Completed Joint Operational Review for Planning, Building, Engineering and Economic Development tostrengthen relationships with the development community and improve service to the public• Collaborated with <strong>City</strong> departments to encourage low impact development practices that help protect andpreserve <strong>Guelph</strong>’s natural environmental assets• Completed Environmental Assessment York Trunk Sewer and Paisley Clythe Feedermain• Completed stage two Clair Road Zone 3 watermain, and stage three Speedvale Trunk watermain• Completed phase 1 and 2 water and sewer services for Hanlon Creek Business Park<strong>City</strong> <strong>of</strong> <strong>Guelph</strong> – <strong>2013</strong> Tax-supported Operating <strong>Budget</strong>93
Planning, Building, Engineering and Environment• Processed more than 300 subdivision, site plan, zone change, Official Plan Amendment and Committee <strong>of</strong>Adjustment applications• Tendered 34 site services with a total dollar amount <strong>of</strong> approximately one million dollars• Encouraged remediation and redevelopment <strong>of</strong> potentially contaminated properties to reduceenvironmental impacts, enhance neighbourhoods and increase property values using the BrownfieldCommunity Improvement Plan policy and grant agreements• Completed Environmental Assessment for Silvercreek grade separation and Hanlon/Maltby interchangeKey Performance Measures2010 2011 2012 <strong>2013</strong>Road (lane metres) 25,645 21,838 16,683 18,500Storm Sewers 19,946 7,206 6,869 7,100Watermain 15,033 7,294 6,511 6,600Sanitary Sewers 9,894 7,196 6,168 6,300Sidewalk 17,527 10,837 9,014 9,400All measurements in metres<strong>2013</strong> forecast assumes same amount <strong>of</strong> subdivision development as in 2011<strong>2013</strong> forecast assumes approval <strong>of</strong> proposed <strong>2013</strong> capital budget and forecast<strong>2013</strong> Objectives• Complete interior renovation at VIA Station to integrate <strong>Guelph</strong> Transit, GO Transit, Greyhound Coach Linesand VIA Rail service at <strong>Guelph</strong> Central Station and improve connections between local, regional andnational public transit systems• Implement recommendations from the Joint Operational Review <strong>of</strong> development application reviewprocess managed by the Planning, Building, Engineering and Economic Development departments• Implement recommendations <strong>of</strong> Cycling Master Plan (pending Council approval)• Continue developing low impact development strategy• Complete targeted 40 site services with a total dollar amount <strong>of</strong> approximately one-million dollars• Select private developer/consortium to clean up and redevelop the former International Malleable IronCompany (IMICO) site, and continue monitoring and containing <strong>City</strong>-owned brownfield sites• Begin designing York trunk sewer and Paisley Clythe Feedermain project• Design Stevenson trunk sanitary sewer replacement (stage two <strong>of</strong> three), Speedvale Trunk (stage four <strong>of</strong> six)and final stage <strong>of</strong> Clair Road Zone 3 watermains<strong>City</strong> <strong>of</strong> <strong>Guelph</strong> – <strong>2013</strong> Tax-supported Operating <strong>Budget</strong>94
Planning, Building, Engineering and Environment• Begin Environmental Assessment for Wellington/Clair trunk watermain• Implement Stormwater Master Plan initiatives to protect <strong>Guelph</strong>’s streams and rivers and prevent flooding;downspouts disconnection• Initiate stormwater management funding review study• Begin construction on Silvercreek Parkway project to create continuous roadway from Waterloo Avenue toWoodlawn Road to improve transportation connections in the area• Niska Environmental Assessment for bridge improvements• Hanlon Expressway coordination with Province• Assess traffic impact <strong>of</strong> proposed new developments• Update transportation demand forecasting model to guide future investment in traffic infrastructureKey Changes in <strong>2013</strong>• Decrease purchased goods by $126,940 or 58.7% by reducing cost <strong>of</strong> operating the Stone Road MaterialsFacility ($139,400) is partially <strong>of</strong>fset by increases in other purchased goods ($8,350)• Increase purchase services by $3,860 or 4.2% due to increased training costs• Increase internal charges by $6,100 or 4% due to maintenance charges ($3,100) and insurance ($1,300)• Increase internal recoveries by $102,400 or 19.5% mainly due increased recoveries from the Water andWastewater Services for the Risk Management Official ($50,000) and infrastructure engineering services($41,900)• Increase revenue by $68,550 or 2.2% due to increased recoveries from works administered on behalf <strong>of</strong> thirdparties, <strong>of</strong>fset by the decreasing value <strong>of</strong> capital project allocation and completion <strong>of</strong> the InfrastructureStimulus Funding program.<strong>City</strong> <strong>of</strong> <strong>Guelph</strong> – <strong>2013</strong> Tax-supported Operating <strong>Budget</strong>95
Planning, Building, Engineering and Environment$3,500,000Year/Year Revenue Comparison$3,000,000$2,500,000$2,000,000$1,500,000$1,000,000$500,000$0User fees and service chargesProduct salesExternal recoveriesInternal recoveries2012 <strong>2013</strong><strong>City</strong> <strong>of</strong> <strong>Guelph</strong> – <strong>2013</strong> Tax-supported Operating <strong>Budget</strong>96
Planning, Building, Engineering and Environment$4,500,000$4,000,000$3,500,000$3,000,000$2,500,000$2,000,000$1,500,000$1,000,000$500,000$0Year/Year Expenditure ComparisonSalary, wages and benefitsPurchased goodsPurchased servicesInternal charges2012 <strong>2013</strong><strong>City</strong> <strong>of</strong> <strong>Guelph</strong> – <strong>2013</strong> Tax-supported Operating <strong>Budget</strong>97
Planning, Building, Engineering and Environment<strong>2013</strong> Operating <strong>Budget</strong>2012<strong>Budget</strong><strong>2013</strong>Base<strong>Budget</strong><strong>2013</strong>Eff/New/GrowthImpact fromCapital<strong>2013</strong>Requested<strong>Budget</strong><strong>2013</strong><strong>Budget</strong>Change $<strong>2013</strong><strong>Budget</strong>Change %Planning, Building, Engineering, Environment33 EngineeringRevenueUser Fees & Service Charges ($15,500) (16,500) $0 ($16,500) ($1,000) 6.5%Product Sales (500) (250) 0 (250) 250 (50.0%)External Recoveries (3,055,665) (2,986,365) 0 (2,986,365) 69,300 (2.3%)Grants 0 0 0 0 0 #DIV/0!Total Revenue (3,071,665) (3,003,115) 0 (3,003,115) 68,550 (2.2%)ExpenditureSalary, Wage & Benefits 3,940,410 4,126,590 140,200 4,266,790 326,380 8.3%Purchased Goods 216,190 89,250 1,100 90,350 (125,840) (58.2%)Purchased Services 90,930 94,790 6,000 100,790 9,860 10.8%Total Expenditure 4,247,530 4,310,630 147,300 4,457,930 210,400 5.0%Net Before Internal Charges & Recoveries 1,175,865 1,307,515 147,300 1,454,815 278,950 23.7%Internal Charges & RecoveriesInternal Charges 189,200 195,300 14,000 209,300 20,100 10.6%Internal Recoveries (524,400) (576,800) (211,300) (788,100) (263,700) 50.3%Total Internal Charges & Recoveries (335,200) (381,500) (197,300) (578,800) (243,600) 72.7%Net <strong>Budget</strong> 840,665 926,015 (50,000) 876,015 35,350 4.2%<strong>City</strong> <strong>of</strong> <strong>Guelph</strong> – <strong>2013</strong> Tax-supported Operating <strong>Budget</strong>98
Planning, Building, Engineering and Environment>> Solid Waste ResourcesThe Solid Waste Resources Department is delivering public services better by finding innovative ways tomanage <strong>Guelph</strong>’s organic, recyclable, hazardous and other solid waste. The department provides residentialand commercial waste management services in compliance with all provincial legislation and regulationsincluding waste collection, recycling, organics processing, household hazardous waste management, wastedisposal, and waste reduction education programs designed to reduce the amount <strong>of</strong> waste sent to landfill,reduce greenhouse gas emissions, and reach the <strong>City</strong>’s goal to generate the least amount waste per capita <strong>of</strong>any comparable Canadian city.Integrated Services• Plan, develop and implement waste reduction programs• Monitor and maintain the closed Eastview Landfill and operation <strong>of</strong> a Methane Gas Collection System• Ensure all operations and programs comply with provincial legislation and regulationsWaste Resource Innovation Centre (WRIC) Operations• Material Recovery Facility• Household Hazardous Waste Facility• Public Drop-Off Facility• Organic Waste Processing Facility• Transfer Station• Disposal <strong>of</strong> non-recyclable, non-compostable wasteWaste Collection• Collect organic, recyclable and non-recyclable waste• Manage and administer bulky item collection program• Manage and administer yard waste collection services<strong>City</strong> <strong>of</strong> <strong>Guelph</strong> – <strong>2013</strong> Tax-supported Operating <strong>Budget</strong>99
Planning, Building, Engineering and EnvironmentFinancial Snapshot2012<strong>Budget</strong><strong>2013</strong>RequestedYear/YearIncrease ($)Year/YearIncrease (%)Funding SourcesTax-supported % User Fee % Grants %Solid Waste Resources $10,622,224 $10,608,015 ($14,209) (0.1%) 56.6% 37.4% 6.0%2012 Accomplishments• Substantially completed design-build <strong>of</strong> the Organic Waste Processing Facility (OWPF)• Commissioned Organic Waste Processing Facility• Responded to initial odour issues; since reopening in February have ensured facility has operated to thesatisfaction <strong>of</strong> the Ministry <strong>of</strong> the Environment• Formed strong partnership with Wellington Organix; operators <strong>of</strong> the Organic Waste Processing Facility• On track to achieve waste diversion target <strong>of</strong> 55% by the end <strong>of</strong> 2012 per <strong>Guelph</strong>’s Solid Waste Master Plan• Rolled-out automated waste cart collection to one-third <strong>of</strong> the city to increase waste diversion, and reduceannual waste collection costs and greenhouse gas emissions• Reviewed departmental information technology requirements and implemented recommendations toimprove service monitoring and measurement• Implemented in-house waste collection services for Wastewater Services to eliminate cost <strong>of</strong> contractedservices• Introduced three-stream waste sorting at the Sleeman Centre to reduce organic and recyclable materialgoing to disposal• Developed a haul/disposal request for proposals to secure disposal capacity for next decade• Continued efforts to improve relationships with Ministry <strong>of</strong> Environment and residential neighbours nearthe WRIC by addressing odours and other concerns and improving communications<strong>City</strong> <strong>of</strong> <strong>Guelph</strong> – <strong>2013</strong> Tax-supported Operating <strong>Budget</strong>100
Planning, Building, Engineering and EnvironmentKey Performance Measures2.50Residential collection cost per household per week2.00Cost (s)1.501.000.500.002007 2008 2009 2010 2011Cost per household per weekTrend lineThis graph shows the weekly cost per household for collection <strong>of</strong> <strong>Guelph</strong>’s three waste streams; sourceseparated organics (green), recycling (blue), and waste (clear). The downward trend line reflects theefficiencies implemented over the last five years including reduced staffing requirements, reduced overtime,and reduced discretionary spending.Future Forecast – as the conversion to fully-automated cart collection is phased in from 2012 to 2014, the costper household per week will continue decreasing as further operating efficiencies are realized. Once fullyimplemented in 2015, the <strong>City</strong> estimates annual savings <strong>of</strong> $400,000 or another 10% reduction from the <strong>2013</strong>requested budget for waste collection.<strong>City</strong> <strong>of</strong> <strong>Guelph</strong> – <strong>2013</strong> Tax-supported Operating <strong>Budget</strong>101
Planning, Building, Engineering and Environment60Residential diversion5040Diversion (%)30201002005 2006 2007 2008 2009 2010 2011 2012DiversionTrend line<strong>Guelph</strong>’s residential diversion rate (i.e. waste diverted from disposal) will continue increasing as new wastereduction, waste minimization, and reuse programs are implemented. Some new programs include: a bicyclereuse program, dedicated construction and demolition recycling, and three-stream waste sorting at theSleeman Centre.Future Forecast – The <strong>City</strong>’s waste diversion rate will continue to increase with the new Organic WasteProcessing Facility contributing the most significant increases. The <strong>City</strong> will meet its diversion target <strong>of</strong> 55% bythe end <strong>of</strong> 2012. The Solid Waste Management Master Plan will be updated during <strong>2013</strong>, including a review <strong>of</strong>the plan to achieve the second diversion target <strong>of</strong> 65% by the end <strong>of</strong> 2016.<strong>City</strong> <strong>of</strong> <strong>Guelph</strong> – <strong>2013</strong> Tax-supported Operating <strong>Budget</strong>102
Planning, Building, Engineering and Environment3.5Annual revenue from sale <strong>of</strong> recyclables3Sales revenue (Millions $)2.521.510.502005 2006 2007 2008 2009 2010 2011 2012Impact <strong>of</strong> the 2008/2009 recession is shown in revenues from the sale <strong>of</strong> recyclables over the last eight years.Commodity prices for sale <strong>of</strong> recyclable material are expected to remain stable in <strong>2013</strong>. Unfortunately, strongprices have led to an increase in the number <strong>of</strong> material recovery facilities that will be competing with the <strong>City</strong>to attract business during 2012 and <strong>2013</strong>. The <strong>City</strong> will continue to monitor the impact <strong>of</strong> increasedcompetition during <strong>2013</strong> and will report to Council on options during 2014.Future Forecast – To predict commodity prices more than eighteen months into the future is a risky anddifficult task and attempting to anticipate changes in the waste industry compounds this uncertainty, whichmakes it difficult to accurately predict annual revenue figures more than one year into the future.<strong>City</strong> <strong>of</strong> <strong>Guelph</strong> – <strong>2013</strong> Tax-supported Operating <strong>Budget</strong>103
Planning, Building, Engineering and EnvironmentSolid Waste Resouces budget increase compared to property tax increase8.00%6.00%Yearly percentage increase4.00%2.00%0.00%-2.00%-4.00%2007 2008 2009 2010 2011 2012Trendline Linear (% tax increase)Trendline Linear (% budget increase)Annual property tax rate increase compared to the percentage annual increase in the Solid Waste Resourcesbudget. The gap between the two trend lines is a testament to the ongoing efforts to find efficiencies.Future Forecast – Operational efficiencies will continue to be explored, along with new sources <strong>of</strong> funding.<strong>City</strong> <strong>of</strong> <strong>Guelph</strong> – <strong>2013</strong> Tax-supported Operating <strong>Budget</strong>104
Planning, Building, Engineering and Environment350Household hazardous waste, e-waste, clothes and tires recycled300Recycled tonnes2502001501005002005 2006 2007 2008 2009 2010 2011Houshold hazardous wasteE-waste, clothes and tiresAnnual number <strong>of</strong> tonnes <strong>of</strong> hazardous waste, electronic waste, clothing and tires recycled at the <strong>City</strong>’s PublicDrop-Off facility. Increases due to new programs include e-waste and clothing recycling.Future Forcast – The next few years will see consistently small increases in the tonnage recycled as morecitizens learn about programs through ongoing promotion.<strong>City</strong> <strong>of</strong> <strong>Guelph</strong> – <strong>2013</strong> Tax-supported Operating <strong>Budget</strong>105
Planning, Building, Engineering and Environment<strong>2013</strong> Objectives• Implement fully-automated waste cart collection roll-out to another one-third <strong>of</strong> the city (phase two <strong>of</strong>three) to realize $400,000 annual cost-savings starting 2015• Review contracted waste collection services at <strong>City</strong> facilities to determine potential cost savings <strong>of</strong> in-housewaste collection• Implement and evaluate three-stream waste sorting pilot project in a large <strong>City</strong> park to determine potentialsuccess in other public spaces and further reduce waste going to landfill• Explore opportunity to quantify, verify and sell greenhouse gas credits from composting source separatedorganic material as a new source <strong>of</strong> revenue• Collaborate with Finance department to develop Green Purchasing Policy• Negotiate and award a new Haul/Disposal contract to secure disposal capacity for next decade• Begin construction <strong>of</strong> new Public Drop-Off facility to improve customer service and address health andsafety concerns• Review and update Solid Waste Management Master Plan as scheduled and continue working to achieve<strong>Guelph</strong>’s waste management goals including a diversion target <strong>of</strong> 65% by the end <strong>of</strong> 2016Key Changes in <strong>2013</strong>• Increase purchased goods by $445,200 or 16.9% due to increased utility costs ($462,800) and property taxes($38,500) is partially <strong>of</strong>fset by decreases in planned expenditures• Increase purchased services by $152,994 or 2.9% driven by increased tipping fees ($305,500), and is partially<strong>of</strong>fset by decreases in repairs and maintenance ($117,620) and consulting services ($25,586)• Increase internal charges by $131,605 or 2.6% mainly due to increases in MM equipment usage charges($61,105), Public Works chargeback ($44,400) and increased insurance costs ($18,200)• Increase revenues by $731,600 or 12.9% mainly due to increased organics processing fees ($630,000) andsales <strong>of</strong> recyclable materials ($122,600)<strong>City</strong> <strong>of</strong> <strong>Guelph</strong> – <strong>2013</strong> Tax-supported Operating <strong>Budget</strong>106
Planning, Building, Engineering and Environment$4,500,000$4,000,000$3,500,000$3,000,000$2,500,000$2,000,000$1,500,000$1,000,000$500,000$0Year/Year Revenue ComparisonUser fees and service chargesProduct salesExternal recoveriesGrantsInternal recoveries2012 <strong>2013</strong><strong>City</strong> <strong>of</strong> <strong>Guelph</strong> – <strong>2013</strong> Tax-supported Operating <strong>Budget</strong>107
Planning, Building, Engineering and Environment$9,000,000$8,000,000$7,000,000$6,000,000$5,000,000$4,000,000$3,000,000$2,000,000$1,000,000$0Year/Year Expenditure ComparisonSalary, wages and benefitsPurchased goodsPurchased servicesFinancial expensesInternal charges2012 <strong>2013</strong><strong>City</strong> <strong>of</strong> <strong>Guelph</strong> – <strong>2013</strong> Tax-supported Operating <strong>Budget</strong>108
Planning, Building, Engineering and Environment<strong>2013</strong> Operating <strong>Budget</strong>2012<strong>Budget</strong><strong>2013</strong>Base<strong>Budget</strong><strong>2013</strong>Eff/New/GrowthImpact fromCapital<strong>2013</strong>Requested<strong>Budget</strong><strong>2013</strong><strong>Budget</strong>Change $Planning, Building, Engineering, Environment34 Solid WasteRevenueUser Fees & Service Charges ($3,082,500) (3,822,500) $0 ($3,822,500) ($740,000) 24.0%Product Sales (2,663,400) (2,786,000) 0 (2,786,000) (122,600) 4.6%External Recoveries (373,000) (392,000) 0 (392,000) (19,000) 5.1%Grants (1,075,000) (1,125,000) 0 (1,125,000) (50,000) 4.7%Total Revenue (7,193,900) (8,125,500) 0 (8,125,500) (931,600) 12.9%ExpenditureSalary, Wage & Benefits 7,543,918 7,725,790 0 7,725,790 181,872 2.4%Purchased Goods 2,640,000 3,085,200 0 3,085,200 445,200 16.9%Purchased Services 5,261,606 5,414,600 0 5,414,600 152,994 2.9%Financial Expenses 2,000 2,000 0 2,000 0 0.0%Total Expenditure 15,447,524 16,227,590 0 16,227,590 780,066 5.0%Net Before Internal Charges & Recoveries 8,253,624 8,102,090 0 8,102,090 (151,534) (1.8%)Internal Charges & RecoveriesInternal Charges 5,013,500 5,145,105 0 5,145,105 131,605 2.6%Internal Recoveries (2,644,900) (2,639,180) 0 (2,639,180) 5,720 (0.2%)Total Internal Charges & Recoveries 2,368,600 2,505,925 0 2,505,925 137,325 5.8%Net <strong>Budget</strong> 10,622,224 10,608,015 0 10,608,015 (14,209) (0.1%)<strong>2013</strong><strong>Budget</strong>Change %<strong>City</strong> <strong>of</strong> <strong>Guelph</strong> – <strong>2013</strong> Tax-supported Operating <strong>Budget</strong>109
Operations, transit and Emergency servicesThe service area includes some <strong>of</strong> the <strong>City</strong>’s most visible public services including by-law compliance, transit,fire suppression and prevention, land ambulance service, road maintenance, winter control and parking.Operations, Transit and Emergency Services contributes to the quality <strong>of</strong> life in our city by ensuring <strong>Guelph</strong> is aclean, safe and enjoyable place to live, work or visit.Organizational StructureOperations, Transit and Emergency ServicesExecutive DirectorDerek McCaughanT 519-822-1260 x 2018E derek.mccaughan@guelph.caExecutive AssistantCoralee BarfootT 519-822-1260 x 2033E coralee.barfoot@guelph.caBy-law Compliance,Security and LicensingEmergencyServices<strong>Guelph</strong>TransitPublicWorksManagerDoug GodfreyT 519-822-1260 x 2520E doug.godfrey@guelph.caGeneral Manager/Fire ChiefShawn ArmstrongT 519-822-1260 x 2125E shawn.armstrong@guelph.caGeneral ManagerMichael AndersT 519-822-1260 x 2795E michael.anders@guelph.caGeneral ManagerRodney KellerT 519-822-1260 x 2949E rodney.keller@guelph.caBy-law Complianceand SecurityLicensingAdministration andEmergency Preparedness<strong>Guelph</strong> Wellington EmergencyMedical ServicesFire OperationsBusiness ServicesOperationsQuality Assurance andContinuous ImprovementService Planning andCommunicationsAdministrationFleet and EquipmentManagementForestryRoads and Right <strong>of</strong> WaysTraffic and Parking<strong>City</strong> <strong>of</strong> <strong>Guelph</strong> – <strong>2013</strong> Tax-supported Operating <strong>Budget</strong>110
Operations, transit and Emergency servicesFinancial SnapshotOperations, Transit andEmergency Services2012<strong>Budget</strong><strong>2013</strong>RequestedYear/YearIncrease ($)Year/YearIncrease (%)Funding SourcesTax-supported % User Fee % Grants %$49,133,650 $52,579,308 $3,445,658 7.01% 68.04% 23.51% 8.44%2012 Accomplishments• Increased integration and collaboration to deliver public services better• Enhanced community engagement practices to find creative and collaborative solutions that addressconcerns <strong>of</strong> citizens<strong>2013</strong> Objectives• Continue to develop sound reporting frameworks that ensure accountability and transparency to Counciland the community• Establish key performance measures clearly demonstrating sound management <strong>of</strong> resources and value fortax dollars• Continue to pursue internal synergies to improve customer service• Pursue innovative ways to reduce the cost <strong>of</strong> public service>> AdministrationAdministration provides leadership and strategic direction to service area and leads its efforts to engageemployees, measure and improve departmental performance. It ensures Operations, Transit and EmergencyServices’ systems, structures and frameworks are aligned with the <strong>City</strong>’s mission to provide outstandingmunicipal service and value.<strong>City</strong> <strong>of</strong> <strong>Guelph</strong> – <strong>2013</strong> Tax-supported Operating <strong>Budget</strong>111
Operations, transit and Emergency servicesFinancial SnapshotOperations, Transit andEmergency ServicesAdministration2012<strong>Budget</strong><strong>2013</strong>RequestedYear/YearIncrease ($)Year/YearIncrease (%)$407,040 $527,500 $120,460 29.6% 100.0%Funding SourcesTax-supported % User Fee % Grants %Key Change in <strong>2013</strong>• Addition <strong>of</strong> Technical Assistant for the Service Area<strong>City</strong> <strong>of</strong> <strong>Guelph</strong> – <strong>2013</strong> Tax-supported Operating <strong>Budget</strong>112
Operations, transit and Emergency services$600$500$400‘000s$300$200$100$0Salary, wages and benefitsPurchased goodsPurchased servicesInternal charges<strong>City</strong> <strong>of</strong> <strong>Guelph</strong> – <strong>2013</strong> Tax-supported Operating <strong>Budget</strong>113
Operations, transit and Emergency services<strong>2013</strong> Operating <strong>Budget</strong>2012<strong>Budget</strong><strong>2013</strong>Base<strong>Budget</strong><strong>2013</strong>Eff/New/GrowthImpact fromCapital<strong>2013</strong>Requested<strong>Budget</strong><strong>2013</strong><strong>Budget</strong>Change $<strong>2013</strong><strong>Budget</strong>Change %Operations, Transit and Emergency Services20 OTES AdministrationRevenueTotal Revenue $0 0 $0 $0 $0 0.0%ExpenditureSalary, Wage and Benefits 393,090 414,250 88,300 502,550 109,460 27.8%Purchased Goods 4,000 5,400 0 5,400 1,400 35.0%Purchased Services 9,750 7,950 1,000 8,950 (800) (8.2%)Financial Expenses 0 0 0 0 0 0.0%Total Expenditure 406,840 427,600 89,300 516,900 110,060 27.1%Net Before Internal Charges and Recoveries 406,840 427,600 89,300 516,900 110,060 27.1%Internal Charges and RecoveriesInternal Charges 200 0 10,600 10,600 10,400 5,200.0%Internal Recoveries 0 0 0 0 0 0.0%Total Internal Charges and Recoveries 200 0 10,600 10,600 10,400 5,200.0%Net <strong>Budget</strong> 407,040 427,600 99,900 527,500 120,460 29.6%<strong>City</strong> <strong>of</strong> <strong>Guelph</strong> – <strong>2013</strong> Tax-supported Operating <strong>Budget</strong>114
Operations, transit and Emergency services>> By-law Compliance, Security and Licensing<strong>Guelph</strong> is one <strong>of</strong> Canada’s safest cities, and the By-law Compliance, Security and Licensing department iscommitted to the safety <strong>of</strong> <strong>Guelph</strong> citizens and staff. The department provides 24-hour service to ensurecompliance with <strong>City</strong> by-laws designed to protect and enhance <strong>Guelph</strong>’s quality <strong>of</strong> life and communitywell-being.By-law Compliance and Security• Achieve compliance with <strong>City</strong> by-laws including parking, noise, anti-fouling, idling, business licensing, tree,outside water use and encroachment• Collaborate with other <strong>City</strong> departments to achieve compliance with zoning (parking-related), sign (a-frame,posters), fire prevention (outside burning) and animal control by-laws• Process requests for by-law exemptions including noise (special events), traffic (overnight parking) andexotic animal by-laws• Provide 24-hour security service in the civic precinct and at <strong>City</strong> facilities to ensure staff and public safetyand orderly, respectful use <strong>of</strong> the facilities• Respond to intrusion alarms or calls for assistance at <strong>City</strong> facilities and <strong>City</strong>-owned lands• Contract security services for special events, construction projects and other situations requiring enhancedor additional safety measures for staff and community• Counsel other departments on safety and/or security precautions such as conducting audits <strong>of</strong> facilities toidentify security gaps.• Collaborate with contracted provider <strong>of</strong> animal control services on public safety matters including publicservice announcements regarding coyote sightingsLicensing• Administration and approval <strong>of</strong> business licences, lottery licences and group home registrations includingcoordination <strong>of</strong> inspections• Administration <strong>of</strong> liquor licence clearance applications<strong>City</strong> <strong>of</strong> <strong>Guelph</strong> – <strong>2013</strong> Tax-supported Operating <strong>Budget</strong>115
Operations, transit and Emergency servicesFinancial SnapshotBy-law Compliance,Security and Licensing2012<strong>Budget</strong><strong>2013</strong>RequestedYear/YearIncrease ($)Year/YearIncrease (%)Funding SourcesTax-supported % User Fee % Grants %$1,235,832 $1,154,058 ($81,774) (6.6%) 44.1% 55.9%2012 Accomplishments• Coordinated a multi-agency response to neighbourhood concerns regarding unwanted behaviours andengaged community to gather feedback on performance• Implemented online parking complaint system to improve how the department manages and responds toconcerns from citizens• Reviewed fire route and idling by-laws and business licensing categories• Reviewed business licensing fees to maintain cost recovery status• Drafted public nuisance by-law and initiated community engagement plan to ensure the by-law addressescommunity concerns and reflects the needs <strong>of</strong> the people it is intended to serve and protect• Improved administration <strong>of</strong> downtown sign permits• Initiated fireworks awareness campaign for vendors• Initiated a public safety campaign on coyote awareness• Held lottery licensing information sessions in partnership with the County <strong>of</strong> Wellington to educate seniorsabout bingo operations• Assumed administration <strong>of</strong> animal control services agreement and strengthened working relationship with<strong>Guelph</strong> Humane Society enforcement personnel• Created a central, automated by-law telephone number• Created centralized security camera monitoring system for <strong>City</strong> facilities to improve efficiencies• Relocated staff to new workstations to improve working conditions and create efficiencies<strong>City</strong> <strong>of</strong> <strong>Guelph</strong> – <strong>2013</strong> Tax-supported Operating <strong>Budget</strong>116
Operations, transit and Emergency servicesKey Performance MeasuresPerformance MeasureTargetBenchmark 20112012EstimatedNet operating costs <strong>of</strong> general by-law compliance per resident TBD $8.95 $10.83 $9.6475% 70% 72% 72%Actual By-law patrol time percentage, per <strong>of</strong>ficer: amount <strong>of</strong> time spent by an <strong>of</strong>ficerproactively patrolling or responding to By-law concerns and indicates the level <strong>of</strong>compliance service the public receives; the remaining amount <strong>of</strong> time is spent on clerical,non-enforcement duties.Percentage <strong>of</strong> expenditure recovered through fine revenue N/A 45% 47% 54%Number <strong>of</strong> noise complaint calls the measurement can help show the effectiveness <strong>of</strong> the N/A 2,565 2,400 2,400Enhanced Enforcement Program in which By-law staff proactively address on-goingneighbourhood concerns related to noise and other unwanted activityBusiness licences – applications/renewals processed: varies based on market andeconomic conditions, but can help show effectiveness <strong>of</strong> enforcement and routinebusiness inspections.N/A 795 768 775<strong>2013</strong> ObjectivesProjected<strong>2013</strong>• Implement and enforce <strong>Guelph</strong>’s Public Nuisance By-law to improve public safety• Implement new licensing categories to address public concerns• Review administrative monetary penalties options for parking enforcement and business licensing• Prepare and begin process to stagger business licence renewals to improve efficiencies with inspectionagencies and provide better service to businesses• Improve lottery licence inspections and audit processes to adhere to Alcohol Gaming Commission Ontarioguidelines• Continue reviewing by-laws including sign, animal control and accessible parking• Evaluate and identify security infrastructure (cctv cameras, panic alarms, intrusion alarms, access controls)in need <strong>of</strong> maintenance and repair, and prioritize repairs• Continue integrating <strong>City</strong> facility security systems to protect staff and corporate assets by increasing andimproving response times<strong>City</strong> <strong>of</strong> <strong>Guelph</strong> – <strong>2013</strong> Tax-supported Operating <strong>Budget</strong>117
Operations, transit and Emergency servicesKey Changes in <strong>2013</strong>• Increase user fees and service charges by 5.7 per cent due to expected increase in licensing revenue fromgrowth and parking fine enforcement• Increase internal recoveries due to annualization <strong>of</strong> <strong>Guelph</strong> Central Station• Increase transfers to <strong>Guelph</strong> Humane Society by 2 per cent due to contractual obligationsYear/Year Revenue Comparison$1,400$1,200$1,000‘000s$800$600$400$200$0User fees and service chargesExternal recoveriesLicence and permits2012 <strong>2013</strong>Internal recoveries<strong>City</strong> <strong>of</strong> <strong>Guelph</strong> – <strong>2013</strong> Tax-supported Operating <strong>Budget</strong>118
Operations, transit and Emergency services$2,500Year/Year Expenditure Comparison$2,000‘000s$1,500$1,000$500$0Salary, wages and benefitsPurchased goodsPurchased servicesOther transfersInternal charges2012 <strong>2013</strong><strong>City</strong> <strong>of</strong> <strong>Guelph</strong> – <strong>2013</strong> Tax-supported Operating <strong>Budget</strong>119
Operations, transit and Emergency services<strong>2013</strong> Operating <strong>Budget</strong>2012<strong>Budget</strong><strong>2013</strong>Base<strong>Budget</strong><strong>2013</strong>Eff/New/GrowthImpact fromCapital<strong>2013</strong>Requested<strong>Budget</strong><strong>2013</strong><strong>Budget</strong>Change $Operations, Transit and Emergency Services25 By-law Compliance and SecurityRevenueUser Fees and Service Charges ($1,193,500) (1,261,000) $0 ($1,261,000) ($67,500) 5.7%Licenses and Permits (173,000) (188,500) 0 (188,500) (15,500) 9.0%External Recoveries (14,000) (14,000) 0 (14,000) 0 0.0%Total Revenue (1,380,500) (1,463,500) 0 (1,463,500) (83,000) 6.0%ExpenditureSalary, Wage and Benefits 1,903,922 1,952,448 0 1,952,448 48,526 2.5%Purchased Goods 69,850 64,350 0 64,350 (5,500) (7.9%)Purchased Services 94,360 94,760 0 94,760 400 0.4%Government Transfers 65,000 66,300 0 66,300 1,300 2.0%Other Transfers 564,000 575,300 0 575,300 11,300 2.0%Total Expenditure 2,697,132 2,753,158 0 2,753,158 56,026 2.1%Net Before Internal Charges and Recoveries 1,316,632 1,289,658 0 1,289,658 (26,974) (2.0%)Internal Charges and RecoveriesInternal Charges 32,800 38,200 0 38,200 5,400 16.5%Internal Recoveries (113,600) (173,800) 0 (173,800) (60,200) 53.0%Total Internal Charges and Recoveries (80,800) (135,600) 0 (135,600) (54,800) 67.8%Net <strong>Budget</strong> 1,235,832 1,154,058 0 1,154,058 (81,774) (6.6%)<strong>2013</strong><strong>Budget</strong>Change %<strong>City</strong> <strong>of</strong> <strong>Guelph</strong> – <strong>2013</strong> Tax-supported Operating <strong>Budget</strong>120
Operations, transit and Emergency services>> Emergency Services<strong>Guelph</strong>’s Emergency Services department contributes to community well-being and peace <strong>of</strong> mind byproviding land ambulance and fire protection, emergency preparedness planning and education programsdesigned to keep people safe in their homes and businesses.<strong>Guelph</strong> Fire Department• Provide fire fighting/suppression, public assistance, rescue, public education, hazardous material response,medical response, fire related planning, fire prevention and inspections and fire investigations from six firestations across the city• Provide fire protection to <strong>Guelph</strong>-Eramosa Township; executive leadership through <strong>Guelph</strong> Fire Chief anddirect fire fighting/suppression• Contribute to mutual aid structure with Wellington County and provide assistance to neighbouringcommunities in times <strong>of</strong> crisis• Provide communications (dispatching) to <strong>Guelph</strong> and County <strong>of</strong> WellingtonEmergency Preparedness• Prevent, mitigate, prepare for, respond to and recover from emergencies through public education andtraining programs• Train and encourage <strong>City</strong> staff and community partners in business continuity planning to minimizedisruption to public services in times <strong>of</strong> crisis• Train <strong>City</strong> staff and community partners to manage emergencies and provide necessary support, facilitiesand equipment• Continuously strive to become a more disaster-resilient community<strong>Guelph</strong> – Wellington Emergency Medical Service (EMS)Provide emergency pre-hospital medical care to <strong>Guelph</strong> and Wellington County; serve a resident population<strong>of</strong> over 200,000 across more than 2,600 square kilometres from eight ambulance bases<strong>City</strong> <strong>of</strong> <strong>Guelph</strong> – <strong>2013</strong> Tax-supported Operating <strong>Budget</strong>121
Operations, transit and Emergency servicesFinancial Snapshot2012<strong>Budget</strong><strong>2013</strong>RequestedYear/YearIncrease ($)Year/YearIncrease (%)Funding SourcesTax-supported % User Fee % Grants %Emergency Services $24,714,683 $25,756,764 $1,042,081 4.2% 72.6% 9.0% 18.4%2012 Accomplishments• Updated primary dispatch centre and opened a new back-up centre at the Clair Road Emergency ServicesCentre providing a redundant communication network for dispatching emergencies• Added mobile computers to Fire Apparatus and Fire Prevention vehicles to enhance dispatching andmonitoring capabilities, on-scene access to database and complete inspections• Community Emergency Management launched projects dealing with business continuity planning and theEmergency Operations Control Group (make-up and usage <strong>of</strong> Incident Management System) to coordinateand plan for large-scale emergencies while maintaining provision <strong>of</strong> critical city services• Participated in a legislatively required land ambulance accreditation service review with the Ministry <strong>of</strong>Health and Long-Term Care to ensure a quality provision <strong>of</strong> emergency medical services within legislatedstandards• Established the first comprehensive response time performance plan for land ambulance• Initiated a pilot communication system for simultaneous notification and dispatch <strong>of</strong> responders toemergency medical incidents; collaborate with Province <strong>of</strong> Ontario Central Ambulance CommunicationCentre (CACC), Fire and EMS<strong>City</strong> <strong>of</strong> <strong>Guelph</strong> – <strong>2013</strong> Tax-supported Operating <strong>Budget</strong>122
Operations, transit and Emergency servicesKey Performance Measures2010actual2011actual<strong>Guelph</strong> Fire Department response time percentages – Representing emergency incidents for first arriving unit measured against thebenchmark total response time <strong>of</strong> equal or less than 6.5 minutes 90% <strong>of</strong> the timeFire 68.11% 81.81% 85%Medical 83.73% 82.36% 85%Rescue 82.14% 87.89% 85%Hazardous 64.38% 59.55% 60%<strong>Guelph</strong> – Wellington EMS response times – Representing Code 4 (potential life threatening) incidents across the coverage area. 12:20min/secOperating costs for <strong>Guelph</strong> Fire Department per $1,000 <strong>of</strong> weighted assessment – for measurement against other divisions /departmentsOperating costs for <strong>Guelph</strong> – Wellington EMS per $1,000 <strong>of</strong> weighted assessment – for measurement against other divisions /departments12:46min/sec2012projected12:30min/sec$1.13 $1.21 $1.21$0.22 $0.26 $0.24<strong>2013</strong> Objectives• Maintain accredited status by submitting second annual compliance report to the Commission on FireAccreditation International (CFAI)• Assess and consider the Fire Community Assistance Registration Entry System (CARES) program; communitymembers could register potential risks or hazards in their homes or businesses allowing the Fire Departmentto better prepare and address situations when responding• Introduce the Community Referrals by EMS (CREMS) system; allows paramedics to make a referral to theCommunity Care Access Centre (CACC) on behalf <strong>of</strong> a patient and can reduce repeat calls• Continue business continuity planning and implement Incident Management System; scalablemanagement <strong>of</strong> emergencies within nationally recognized standards• Develop the framework necessary to allow Council to consider the appropriate level <strong>of</strong> land ambulanceresponse for the service area• Negotiate fair and reasonable new collective agreement with the <strong>Guelph</strong> Pr<strong>of</strong>essional Firefighters’Association• Develop the terms <strong>of</strong> reference for a land ambulance base location optimization study to project the needs<strong>of</strong> the service area to the year 2032; study to be carried out in 2014 pending budget approval• Enhance the level and appropriateness <strong>of</strong> reporting to <strong>City</strong> Council and the community<strong>City</strong> <strong>of</strong> <strong>Guelph</strong> – <strong>2013</strong> Tax-supported Operating <strong>Budget</strong>123
Operations, transit and Emergency servicesKey Changes in <strong>2013</strong>• Increase revenue by $651,600 primarily due to increase in funding from the Ontario government ($233,700)and amount owing from Wellington County contribution ($405,400); the province funds 50 per cent <strong>of</strong> alleligible land ambulance expenditures from the prior year and the County’s contribution is based onoperational costs apportioned based on location• Increase interfund recoveries by $180,000 to reflect an estimated transfer from reserve to fund Fire sick leavecoverage• Increase computing services chargeback by $134,300 due to the acquisition <strong>of</strong> twenty laptops for theelectronic patient care reporting system in 2011• Increase fuel and maintenance charge backs by $187,359 to align the <strong>2013</strong> budget with actual spending• Increase hydro by $33,700 due to increasing energy costs<strong>City</strong> <strong>of</strong> <strong>Guelph</strong> – <strong>2013</strong> Tax-supported Operating <strong>Budget</strong>124
Operations, transit and Emergency services$7,000Year/Year Revenue Comparison$6,000$5,000‘000s$4,000$3,000$2,000$1,000$0User fees and service chargesExternal recoveriesGrants2012 <strong>2013</strong>Internal recoveries<strong>City</strong> <strong>of</strong> <strong>Guelph</strong> – <strong>2013</strong> Tax-supported Operating <strong>Budget</strong>125
Operations, transit and Emergency services$35,000Year/Year Expenditure Comparison$30,000$25,000‘000s$20,000$15,000$10,000$5,000$0Salary, wages and benefitsPurchased goodsPurchased servicesInternal charges2012 <strong>2013</strong><strong>City</strong> <strong>of</strong> <strong>Guelph</strong> – <strong>2013</strong> Tax-supported Operating <strong>Budget</strong>126
Operations, transit and Emergency services>> <strong>Guelph</strong> TransitIn serving riders <strong>of</strong> all ages, incomes and physical abilities, <strong>Guelph</strong> Transit provides safe, affordable andinclusive public transportation to connect people in communities throughout the city. By implementing theTransit Growth Strategy, moving into <strong>Guelph</strong> Central Station and collaborating on initiatives like the AffordableBuss Pass pilot project, <strong>Guelph</strong> Transit contributes to community well-being, and strives to become thepreferred mode <strong>of</strong> transportation for residents, employers and visitors in <strong>Guelph</strong>.Transit Business Services• Manage <strong>Guelph</strong> Transit’s business functions including budget preparation, financial reporting, and contractadministration• Maintain all communication channels and monitor the implementation and performance <strong>of</strong> marketing andsales programs, pilots and initiatives• Oversee the customer service and manage protocols, benchmarks and responses to route planningrequests, public comments and inquiries using traditional and social mediaTransit Operations• Conventional service employs 69 fully accessible low-floor buses operating every 15 minutes during peakperiods and every 30 minutes during <strong>of</strong>f-peak periods serving neighbourhoods throughout the city• Transit’s fleet <strong>of</strong> 9 mobility buses provide door-to-door service for passengers who may or may not usepersonal mobility devices such as walkers or wheelchairs; after-hours service <strong>of</strong>fered to registered usersthrough a third-party contractor• <strong>Guelph</strong>’s Community Bus is a fully accessible vehicle serving two routes for passengers who may or may notuse personal mobility devices such as walkers or wheelchairs; routes travel to key destinations such asseniors’ centres, hospitals and shopping areasPlanning and Scheduling• Prepare annual Service Standard and Benchmarking Report to ensure <strong>Guelph</strong> Transit maintains adequateservice levels, financial performance and route efficiency• Assess route performance and develop route and service adjustments• Work with various <strong>City</strong> departments and external agencies on long-term planning to ensure <strong>Guelph</strong> Transitservice supports the <strong>City</strong>’s growth and planning objectives<strong>City</strong> <strong>of</strong> <strong>Guelph</strong> – <strong>2013</strong> Tax-supported Operating <strong>Budget</strong>128
Operations, transit and Emergency servicesQuality Assurance and Continuous Improvement• Maintain the administration facility used to store, clean and fuel all mobility and conventional buses at 170Watson Road• Operate <strong>Guelph</strong> Central Station; multi-modal transportation hub downtown <strong>Guelph</strong> connecting local,regional and national public transitFinancial Snapshot2012<strong>Budget</strong><strong>2013</strong>RequestedYear/YearIncrease ($)Year/YearIncrease (%)Funding SourcesTax-supported % User Fee % Grants %<strong>Guelph</strong> Transit $10,124,770 $11,701,435 $1,576,665 15.6% 52.9% 47.1%2012 Accomplishments• Implemented <strong>Guelph</strong> Transit Growth Strategy and Plan to increase efficiency and better match service withdemand; new routes, 15-minute peak and 30-minute <strong>of</strong>f-peak service, improved Mobility Services throughextended community bus service and expanded TaxiScrip program• Moved to <strong>Guelph</strong> Central Station - a centralized transportation hub integrating local, regional and nationaltransit services• Completed infrastructure upgrades at the University Centre to provide much-needed operational capacityon campus• <strong>Guelph</strong> Transit and Community and Social Services staff collaborated to develop an Affordable Bus Passprogram to improve access to transportation for low income families• Worked through the Ontario Public Transit Association (OPTA) to satisfy requirements <strong>of</strong> Accessibility forOntarians with Disabilities Act (AODA)• Upgraded 33 bus stops in accordance with AODA standards as part <strong>of</strong> ongoing accessibility upgrades• Fare parity was introduced for mobility riders which provides for the same fare schedule as users <strong>of</strong>conventional transit• Announced a joint project with the Ontario government to implement rainwater harvesting system for thebus wash facility to reduce water use by 35 per cent and lower operating costs by about $7,000 a year• Completed security and energy-efficiency building upgrades estimated to reduce energy consumption by20 per cent for an annual savings <strong>of</strong> approximately $35,000• Based on the Transit Technology Plan recommendations approved by Council, <strong>Guelph</strong> Transit developeddetailed specifications and retained a qualified vendor to implement phase 1 <strong>of</strong> the plan including<strong>City</strong> <strong>of</strong> <strong>Guelph</strong> – <strong>2013</strong> Tax-supported Operating <strong>Budget</strong>129
Operations, transit and Emergency serviceson-vehicle hardware and s<strong>of</strong>tware, CAD/AVL upgrades, automated stop calling and scheduling s<strong>of</strong>tware forconventional and mobility services• Introduced a magnetic stripe on the monthly pass to increase the accuracy <strong>of</strong> ridership data• Provided new lunchroom facilities for staff at the University Centre terminal to support implementation <strong>of</strong>new routes as part <strong>of</strong> Transit Growth Strategy• Implemented a GO Fare integration program with GO Transit; encourages the use <strong>of</strong> local transit as part <strong>of</strong>daily commute• Reintroduced the Transit Advisory Committee to engage citizens and stakeholders and ensure serviceevolves to meet the needs <strong>of</strong> increasingly diverse ridershipKey Performance Measures2011Actual2012EstimatePerformance MeasureSchedule adherence85% 85% 85%How frequently buses meet scheduled arrivals at specified timing points on the routes. Withimplementation <strong>of</strong> new routes recommended in the Transit Growth Strategy, schedule adherence willshow further improvement over previous years.Revenue/cost ratio58% 55% 55%The portion <strong>of</strong> operating costs that are recovered via the fare box and other commercial revenues. Theratio will be sustained in the range <strong>of</strong> 55% reflecting higher operating costs partially <strong>of</strong>fset by additionalrevenue.Annual ridership6.3M 6.7M 6.9MThe number <strong>of</strong> single-route boardings <strong>of</strong> <strong>Guelph</strong> Transit conventional buses, excluding transfers.Implementation <strong>of</strong> new routes and greater frequency during peak service hours will result in increasedridership.Trips per capita52.6 55.8 57.5The number <strong>of</strong> revenue trips on conventional buses versus population. Greater frequency <strong>of</strong> buses duringpeak periods should result in increased ridership and trips per capita.<strong>2013</strong>Projected<strong>City</strong> <strong>of</strong> <strong>Guelph</strong> – <strong>2013</strong> Tax-supported Operating <strong>Budget</strong>130
Operations, transit and Emergency services<strong>2013</strong> Objectives• Upgrade technology systems including vehicle hardware and s<strong>of</strong>tware systems for vehicle managementand customer information; automated stop calling and automatic passenger counting• Negotiate an affordable, fair and equitable new collective agreement with Amalgamated Transit Unionmembers• Meet legislated requirements for services and facilities under the Accessibility for Ontarians with DisabilitiesAct• Continue to monitor the swipe card system and assess the feasibility <strong>of</strong> adding this capability to theUniversity <strong>of</strong> <strong>Guelph</strong> student card• Implement rainwater harvesting and rinse-water the bus wash in partnership with the Ontario Ministry <strong>of</strong>the Environment• Continue accessibility upgrades at 35 more bus stops in <strong>2013</strong>• Prepare a business case for interregional service between <strong>Guelph</strong> and Kitchener-Waterloo for considerationduring the 2014 budget cycle• Conduct additional planning and scheduling studies to refine service based on customer needs and marketdemand• Negotiate new UPass and late night service agreements with University <strong>of</strong> <strong>Guelph</strong>• Continue to monitor financial and ridership impact <strong>of</strong> Affordable Bus Pass pilot project and report to Council• Complete bus shelter and bus bench relocation program reflecting user requests and market demand• Implement the Bus Mobility Supervisor role within the organization establishing clear objectives to enhancethe serviceKey Changes in <strong>2013</strong>• Internal charges (MM) for fuel and maintenance costs are forecasted to increase by approximately $1.1M(14%) due to commodity price increases and increased vehicle mileage. This reflects in part the acquisitionand deployment <strong>of</strong> four additional used buses in 2012 to address capacity issues along Gordon Street.• Costs for <strong>Guelph</strong> Central Station are forecast to increase by $233,000 (50 per cent) due to the annualization<strong>of</strong> the facility’s budget in <strong>2013</strong>.• Addition <strong>of</strong> a Mobility Supervisor<strong>City</strong> <strong>of</strong> <strong>Guelph</strong> – <strong>2013</strong> Tax-supported Operating <strong>Budget</strong>131
Operations, transit and Emergency servicesYear/Year Revenue Comparison$12,000$10,000$8,000‘000s$6,000$4,000$2,000$0User fees and service chargesInternal recoveries2012 <strong>2013</strong><strong>City</strong> <strong>of</strong> <strong>Guelph</strong> – <strong>2013</strong> Tax-supported Operating <strong>Budget</strong>132
Operations, transit and Emergency services$18,000$16,000$14,000$12,000Year/Year Expenditure Comparison‘000s$10,000$8,000$6,000$4,000$2,000$0Salary, wages and benefitsPurchased goodsPurchased servicesFinancial expensesInternal charges2012 <strong>2013</strong><strong>City</strong> <strong>of</strong> <strong>Guelph</strong> – <strong>2013</strong> Tax-supported Operating <strong>Budget</strong>133
Operations, transit and Emergency services<strong>2013</strong> Operating <strong>Budget</strong>2012<strong>Budget</strong><strong>2013</strong>Base<strong>Budget</strong><strong>2013</strong>Eff/New/GrowthImpact fromCapital<strong>2013</strong>Requested<strong>Budget</strong><strong>2013</strong><strong>Budget</strong>Change $Operations, Transit and Emergency Services26 TransitRevenueUser Fees and Service Charges ($10,757,000) (10,387,400) $0 ($10,387,400) $369,600 (3.4%)Product Sales (1,000) (1,000) 0 (1,000) 0 0.0%External Recoveries (18,000) (18,000) 0 (18,000) 0 0.0%Total Revenue (10,776,000) (10,406,400) 0 (10,406,400) 369,600 (3.4%)ExpenditureSalary, Wage and Benefits 14,389,550 15,254,780 84,500 15,339,280 949,730 6.6%Purchased Goods 797,300 785,200 0 785,200 (12,100) (1.5%)Purchased Services 586,410 681,380 500 681,880 95,470 16.3%Financial Expenses 65,000 70,000 0 70,000 5,000 7.7%Total Expenditure 15,838,260 16,791,360 85,000 16,876,360 1,038,100 6.6%Net Before Internal Charges and Recoveries 5,062,260 6,384,960 85,000 6,469,960 1,407,700 27.8%Internal Charges and RecoveriesInternal Charges 7,929,110 9,074,475 3,200 9,077,675 1,148,565 14.5%Internal Recoveries (2,866,600) (3,846,200) 0 (3,846,200) (979,600) 34.2%Total Internal Charges and Recoveries 5,062,510 5,228,275 3,200 5,231,475 168,965 3.3%Net <strong>Budget</strong> 10,124,770 11,613,235 88,200 11,701,435 1,576,665 15.6%<strong>2013</strong><strong>Budget</strong>Change %<strong>City</strong> <strong>of</strong> <strong>Guelph</strong> – <strong>2013</strong> Tax-supported Operating <strong>Budget</strong>134
Operations, transit and Emergency services>> Public WorksResidents, businesses and visitors can count on the <strong>City</strong>’s Public Works department 24 hours a day, all yearround to maintain and sustain <strong>Guelph</strong>’s roads and sidewalks, public parking, the urban forest, and corporatefleet assets. The department provides first responders to assist Police and Emergency Services during naturalor man-made emergencies. Public Works helps ensure a safe, inclusive, appealing and sustainable city throughits work in Fleet Services, Forestry, Roads and Right <strong>of</strong> Ways, and Traffic and Parking divisions.Fleet Services• Purchase, commission, assess, maintain, repair, decommission and dispose <strong>of</strong> all <strong>City</strong> vehicles andequipmentForestry• Maintain <strong>Guelph</strong>’s urban forest year-round, including street and park trees, and <strong>City</strong>-owned wood lotsRoads and Right <strong>of</strong> Ways• Maintain roads, storm collection systems, sidewalks and boulevards to ensure safe, efficient travel formotorists, cyclists and pedestrians• Maintain downtown properties; sidewalk cleaning, public waste receptacle pick-up on weekends, parkinglots, and <strong>Guelph</strong> Central Station• Coordinate and manage annual programs such as winter control and loose leaf collectionTraffic and Parking• Install and maintain traffic signals and signs to ensure safe and efficient traffic flow• Analyze motorist, cyclist and pedestrian flow to identify and resolve potential network deficiencies• Administer <strong>Guelph</strong>’s adult school crossing guard program• Operate and administer public parking facilities• Operate <strong>Guelph</strong> Farmers’ Market<strong>City</strong> <strong>of</strong> <strong>Guelph</strong> – <strong>2013</strong> Tax-supported Operating <strong>Budget</strong>135
Operations, transit and Emergency servicesFinancial Snapshot2012<strong>Budget</strong><strong>2013</strong>RequestedYear/YearIncrease ($)Year/YearIncrease (%)Funding SourcesTax-supported % User Fee % Grants %Public Works $12,651,325 $13,439,551 $788,226 6.2% 81.3% 18.7%2012 Accomplishments• Refined key performance measures and delivered the first Public Works annual report• Increased number <strong>of</strong> downtown parking spaces by opening the Wyndham Street Lot and re-allocatingspaces in St. George’s Square• Collaborated with Finance department to review and improve model used to manage Fleet costs• Deployed effective anti-graffiti coating to conspicuous <strong>City</strong>-owned infrastructure downtown to preservearchitecture, aesthetics, and reduce clean-up costs• Introduced new governance model in collaboration with the <strong>Guelph</strong> Farmers’ Market Executive• Collaborated with Engineering Services to develop a sustainable infrastructure report card• Established a new business performance system to monitor performance <strong>of</strong> downtown maintenanceactivities• Collaborated with Planning Services and Parks and Recreation to deliver the Urban Forest Management Plan• Won a Canadian Public Works Association national award for public outreach during 2012 Public WorksWeek<strong>City</strong> <strong>of</strong> <strong>Guelph</strong> – <strong>2013</strong> Tax-supported Operating <strong>Budget</strong>136
Operations, transit and Emergency servicesKey Performance MeasuresPerformance Measure 20112012EstimatedAnnual cost <strong>of</strong> roadway maintenance per lane kilometre: The overall cost <strong>of</strong> roadway maintenance $3,804 $3,960 $4,973†including winter control. It varies year-to-year based on severity <strong>of</strong> storms, extreme temperatures, heavyrains, snow, ice etc.$2,287 $2,107 $3,405†Cost <strong>of</strong> winter maintenance per lane kilometre: Varies based on potential severity <strong>of</strong> the winter season,and provides a guideline to adhere to the Federal Salt Management Plan guidelines to reduce use <strong>of</strong> salt(damage to environment) while maintaining public safety.Vehicle/equipment availability: This value represents the percentage <strong>of</strong> the total fleet assets that wereavailable to internal customers to meet their needs.Total parking spaces on and <strong>of</strong>f-street downtown: downtown parking is a key component to attractbusinesses, residents and visitors to <strong>Guelph</strong>’s vibrant and growing downtown core.Number <strong>of</strong> reportable collisions per 1,000 population: The <strong>City</strong> does not control all factors that couldcontribute to collisions, but this measurement helps show how Public Works initiatives can affect thenumber <strong>of</strong> collisions on <strong>City</strong> roadways.Forestry work order attainment: This value represents the percentage <strong>of</strong> all work orders completed forthe year compared to what was planned.98% 97% 97%2,290 2,290 2,33513.4 13.6 13.698% 98% 98%<strong>2013</strong>ProjectedNote: Key performance measures include winter control activities budgeted for the historical average <strong>of</strong> 23 weather events per season. In both 2011 and 2012 the <strong>City</strong> <strong>of</strong><strong>Guelph</strong> experienced milder than average weather which has resulted in lower costs than budgeted.<strong>2013</strong> Objectives• Continue refining resource planning and performance management frameworks for core activities• Issue a comprehensive Corporate Fleet Policy to operate all fleet assets in a safe, environmentallyresponsible and cost-effective manner• Continue refining fleet costing models across the corporation to find additional efficiencies• Complete the downtown parking study and implement recommendations• Establish Corporate Driver and Safety Trainer in Fleet Services division to address the <strong>City</strong>’s CommercialVehicle Operator’s Registration requirements• Collaborate with <strong>Guelph</strong> Transit to review traffic flow and improve route timing• Complete policy development in the areas <strong>of</strong> on-street overnight parking, speed zoning, neighbourhoodtraffic management and traffic signal operating procedures• Begin process for E3 (Energy, Environment, Excellence) recertification <strong>of</strong> the corporate fleet• Implement <strong>2013</strong> recommendations for the Urban Forest Management Plan• Investigate the treatment <strong>of</strong> freeze-thaw cycle on <strong>City</strong> sidewalks to achieve efficiencies<strong>City</strong> <strong>of</strong> <strong>Guelph</strong> – <strong>2013</strong> Tax-supported Operating <strong>Budget</strong>137
Operations, transit and Emergency servicesKey Changes in <strong>2013</strong>• Increase expenditures mainly due to fleet, equipment and vehicle-related costs such as fuel, repairs andmaintenance• Increase in street lighting hydro costs by $500,000• Revenue increase is mainly due to a proposed 5% increase in monthly parking permit fees and anticipatedadditional revenue from the parking study• Increase internal recoveries due to increasing fuel prices, change in accounting policy for equipmentreplacements and 12 full months maintaining Market Square and <strong>Guelph</strong> Central Station (annualization costs)• Additional staff: Crossing Guards and Fleet Asset Trainer<strong>City</strong> <strong>of</strong> <strong>Guelph</strong> – <strong>2013</strong> Tax-supported Operating <strong>Budget</strong>138
Operations, transit and Emergency services$20,000$18,000$16,000$14,000Year/Year Revenue Comparison‘000s$12,000$10,000$8,000$6,000$4,000$2,000$0User fees and service chargesExternal recoveriesInternal recoveries2012 <strong>2013</strong><strong>City</strong> <strong>of</strong> <strong>Guelph</strong> – <strong>2013</strong> Tax-supported Operating <strong>Budget</strong>139
Operations, transit and Emergency services<strong>2013</strong> Operating <strong>Budget</strong>2012<strong>Budget</strong><strong>2013</strong>Base<strong>Budget</strong><strong>2013</strong>Eff/New/GrowthImpact fromCapital<strong>2013</strong>Requested<strong>Budget</strong><strong>2013</strong><strong>Budget</strong>Change $<strong>2013</strong><strong>Budget</strong>Change %Operations, Transit and Emergency Services27 Public WorksRevenueUser Fees and Service Charges ($2,240,179) (2,595,989) $0 ($2,595,989) ($355,810) 15.9%Product Sales (11,000) (15,500) 0 (15,500) (4,500) 40.9%External Recoveries (649,800) (489,300) 0 (489,300) 160,500 (24.7%)Grants 0 0 0 0 0 0.0%Total Revenue (2,900,979) (3,100,789) 0 (3,100,789) (199,810) 6.9%ExpenditureSalary, Wage and Benefits 11,521,794 11,837,465 383,100 12,220,565 698,771 6.1%Purchased Goods 9,492,732 10,869,175 (41,300) 10,827,875 1,335,143 14.1%Purchased Services 3,665,909 3,728,840 70,900 3,799,740 133,831 3.7%Other Transfers 0 0 0 0 0 0.0%Financial Expenses 3,900 4,800 0 4,800 900 23.1%Total Expenditure 24,684,335 26,440,280 412,700 26,852,980 2,168,645 8.8%Net Before Internal Charges and Recoveries 21,783,356 23,339,491 412,700 23,752,191 1,968,835 9.0%Internal Charges and RecoveriesInternal Charges 8,990,770 8,517,790 33,900 8,551,690 (439,080) (4.9%)Internal Recoveries (18,122,801) (18,861,430) (2,900) (18,864,330) (741,529) 4.1%Total Internal Charges and Recoveries (9,132,031) (10,343,640) 31,000 (10,312,640) (1,180,609) 12.9%Net <strong>Budget</strong> 12,651,325 12,995,851 443,700 13,439,551 788,226 6.2%<strong>City</strong> <strong>of</strong> <strong>Guelph</strong> – <strong>2013</strong> Tax-supported Operating <strong>Budget</strong>141
Community and Social ServicesThe Community and Social Services Service Area strengthens citizen and stakeholder engagement to ensure<strong>City</strong> policies, programs and services continue to reflect the needs <strong>of</strong> <strong>Guelph</strong>’s increasingly diverse and complexcommunity. The service area includes <strong>Guelph</strong>’s Business Services, Community Engagement, CorporateBuilding Maintenance, Culture and Tourism, and Parks and Recreation departments which provide facilities,programs and services for residents <strong>of</strong> all ages, incomes, physical abilities and backgrounds to enhancecommunity well-being.Organizational StructureCommunity and Social ServicesExecutive DirectorColleen BellT 519-822-1260 x 2665E colleen.bell@guelph.caExecutive AssistantSusan O’TooleT 519-822-1260 x 2662E susan.otoole@guelph.caBusinessServicesManagerPeter AvgoustisT 519-822-1260 x 2594E peter.avgoustis@guelph.caCommunityEngagementGeneral ManagerBarbara PowellT 519-822-1260 x 2675E barbara.powell@guelph.caCorporate BuildingMaintenanceGeneral ManagerMario PetricevicT 519-822-1260 x 2668E mario.petricevic@guelph.caCulture andTourismGeneral ManagerColleen ClackT 519-822-1260 x 2588E colleen.clack@guelph.caParks andRecreationGeneral ManagerMurray CameronT 519-822-1260 x 2007E murray.cameron@guelph.caAdministrationFacility Bookings andProgram RegistrationService<strong>Guelph</strong>Accessibility ServicesCommunity EngagementImmigration Portal ProjectLocal Immigration PartnershipSenior ServicesSocial Service Policyand LiaisonYouth ServicesCivic PrecinctCorporate PropertyCultural Development<strong>Guelph</strong> MuseumsRiver Run CentreSleeman CentreTourismRecreation FacilitiesPark Planning and DevelopmentParks Infrastructureand HorticultureTurf and Sports Fields<strong>City</strong> <strong>of</strong> <strong>Guelph</strong> – <strong>2013</strong> Tax-supported Operating <strong>Budget</strong>142
Community and Social ServicesFinancial SnapshotCommunity andSocial Services2012<strong>Budget</strong><strong>2013</strong>RequestedYear/YearIncrease ($)Year/YearIncrease (%)Funding SourcesTax-supported % User Fee % Grants %$15,725,255 $16,255,267 $530,012 3.37% 62.05% 35.71% 2.24%2012 Accomplishments• Led Corporate Strategic Plan projects assigned to Community and Social Services• Implemented an issues management model for Community and Social Services including agendaforecasting, and communication• Led the intergovernmental relations strategy development with the County <strong>of</strong> Wellington, Board <strong>of</strong> Health,and other orders <strong>of</strong> government• Oversaw planning for the <strong>City</strong>/County Economic Summit<strong>2013</strong> Objectives• Lead the <strong>2013</strong> Corporate Strategic Plan projects assigned to Community and Social Services as the leadservice area• Lead the implementation <strong>of</strong> the intergovernmental relations strategy with the County <strong>of</strong> Wellington, Board<strong>of</strong> Health, and other orders <strong>of</strong> government• Successfully deliver the January <strong>2013</strong> <strong>City</strong>/County Economic Summit• Develop and implement employee engagement strategies<strong>City</strong> <strong>of</strong> <strong>Guelph</strong> – <strong>2013</strong> Tax-supported Operating <strong>Budget</strong>143
Community and Social Services>> AdministrationCommunity and Social Services Administration engages employees, provides oversight, strategic planning,direction and leadership for the service area. Administration encourages, supports and develops collaborativework teams and applies whole systems thinking to deliver creative solutions and measure performance.Financial SnapshotCommunity and SocialServices Administration2012<strong>Budget</strong><strong>2013</strong>RequestedYear/YearIncrease ($)Year/YearIncrease (%)$975,757 $930,485 ($45,272) (4.6%) 100.0%Funding SourcesTax-supported % User Fee % Grants %Key Changes in <strong>2013</strong>• Decrease compensation by $59,610 or 6.3% due to re-classification• Increase purchased services due to consulting expenses, and an <strong>of</strong>fsetting increase in internal recoveriesdue to a one-time transfer from reserves to <strong>of</strong>fset consulting fees for Community Wellbeing Initiative work<strong>City</strong> <strong>of</strong> <strong>Guelph</strong> – <strong>2013</strong> Tax-supported Operating <strong>Budget</strong>144
Community and Social ServicesTrend AnalysisYear/Year Expenditure Comparison$1,000$900$800$700‘000s$600$500$400$300$200$100$0Salary, wages and benefitsPurchased servicesInternal charges2012 <strong>2013</strong><strong>City</strong> <strong>of</strong> <strong>Guelph</strong> – <strong>2013</strong> Tax-supported Operating <strong>Budget</strong>145
Community and Social Services<strong>2013</strong> Operating <strong>Budget</strong>2012<strong>Budget</strong><strong>2013</strong>Base<strong>Budget</strong><strong>2013</strong>Eff/New/GrowthImpact fromCapital<strong>2013</strong>Requested<strong>Budget</strong><strong>2013</strong><strong>Budget</strong>Change $Community and Social Services40 CSS AdministrationRevenueUser Fees and Service Charges $0 0 $0 $0 $0 0External Recoveries 0 0 0 0 0 0Grants 0 0 0 0 0 0Total Revenue 0 0 0 0 0 0ExpenditureSalary, Wage and Benefits 947,540 887,930 0 887,930 (59,610) (6.3%)Purchased Goods 2,000 2,000 0 2,000 0 0.0%Purchased Services 235,742 273,555 0 273,555 37,813 16.0%Other Transfers 0 0 0 0 0 0Financial Expenses 0 0 0 0 0 0Total Expenditure 1,185,282 1,163,485 0 1,163,485 (21,797) (1.8%)Net Before Internal Charges and Recoveries 1,185,282 1,163,485 0 1,163,485 (21,797) (1.8%)Internal Charges and RecoveriesInternal Charges 12,100 13,200 0 13,200 1,100 9.1%Internal Recoveries (221,625) (246,200) 0 (246,200) (24,575) 11.1%Total Internal Charges and Recoveries (209,525) (233,000) 0 (233,000) (23,475) 11.2%Net <strong>Budget</strong> 975,757 930,485 0 930,485 (45,272) (4.6%)<strong>2013</strong><strong>Budget</strong>Change %<strong>City</strong> <strong>of</strong> <strong>Guelph</strong> – <strong>2013</strong> Tax-supported Operating <strong>Budget</strong>146
Community and Social Services>> Business ServicesThe Business Services department leads the <strong>City</strong>’s efforts to provide outstanding customer service and value.Three divisions within the department – Administration; Facility Bookings, Program Registration and SpecialEvents Coordination; and Service<strong>Guelph</strong> – provide front-line customer service support for several <strong>of</strong> the <strong>City</strong>’sprograms and services.Administration• Administer low-income fee assistance for recreation programs, and the Affordable Bus Pass pilot program insupport <strong>of</strong> local residents• Perform trend analysis, track key performance indicators and provide administrative support for Communityand Social Services• Assess operational effectiveness and efficiencies, provide work planning support, financial oversight andbudget coordinationFacility Bookings, Program Registration and Special Events Coordination• Coordinate permits and reservation bookings for arenas, community rooms and outdoor sports fields• Manage and administer registration for recreation programs and courses <strong>of</strong>fered through the <strong>Guelph</strong>Community Guide• Process applications for all special event permits on <strong>City</strong>-owned property including weddings, festivals,tournaments, parades, fundraising races and runs and film shoots, and ensure compliance with legislationand by-laws• Provide user-level support for 140 CLASS s<strong>of</strong>tware users in several <strong>City</strong> departmentsService<strong>Guelph</strong>• Provide front-line counter customer service at <strong>City</strong> Hall, general email support and distribution, andadminister the main switchboard line• Provide internal mail service to the corporation<strong>City</strong> <strong>of</strong> <strong>Guelph</strong> – <strong>2013</strong> Tax-supported Operating <strong>Budget</strong>147
Community and Social ServicesFinancial Snapshot2012<strong>Budget</strong><strong>2013</strong>RequestedYear/YearIncrease ($)Year/YearIncrease (%)Funding SourcesTax-supported % User Fee % Grants %Business Services $1,292,440 $1,332,338 $39,898 3.1% 99.5% 0.5%Indicator 20112012 Accomplishments• Implemented two-year pilot to determine how <strong>Guelph</strong> can <strong>of</strong>fer an Affordable Bus Pass program forlow-income families in need <strong>of</strong> public transportation services• Improved customer service by implementing new phone queue technology; callers can connect with astaff member rather than leaving voicemail• Implemented new mail stamp processing hardware equipment for greater corporate efficiency• Developed and implemented new <strong>City</strong> Card; pre-paid gift card can be used for recreation passes andprograms, transit passes, publications, maps and more• Reviewed and realigned CLASS system administration to improve data and trend analysis• Completed rates and fees full costing study to set appropriate fee structuresKey Performance Measures2012Projected<strong>2013</strong>TargetCommentsNumber <strong>of</strong> special event applications processed 433 458 460 Trend toward hosting community events in outdoor park lands andopen spacesNumber <strong>of</strong> adult low-income assistance recreationapplications processedNumber <strong>of</strong> customer interactions processed atService<strong>Guelph</strong> counter174 260 260 Increasing participation in income assistance programs for recreation<strong>of</strong>ferings27,910 32,432 33,000 Number <strong>of</strong> walk-in transactions at <strong>City</strong> Hall is increasing due toAffordable Bus Pass applications needing in–person validationNumber <strong>of</strong> bookings for all facilities 30,514 32,200 32,200 Most sports facilities and community spaces are near capacity duringprime timeNumber <strong>of</strong> program registrations 17,286 18,000 18,250 Registration in recreation programs is increasing (we are recoveringfrom the loss <strong>of</strong> registrations during economic slow-down in 2010)Number <strong>of</strong> Affordable Bus Pass applicants processedNotapplicable1800 1800 This metric highlights the initial uptake during pilot program whichexceeded expectations<strong>City</strong> <strong>of</strong> <strong>Guelph</strong> – <strong>2013</strong> Tax-supported Operating <strong>Budget</strong>148
Community and Social Services<strong>2013</strong> Objectives• Develop and implement pricing strategy for all rates and fees including the cost and recovery structure forall community programs, bookings and services, to facilitate better cost recovery while ensuringaffordability for our citizens• Develop allocation policy for all sports and recreational facilities, to ensure equity, fairness and accessibilityKey ChangesDecreased purchased services by $18,920 or 5.8 per cent mainly due to elimination <strong>of</strong> shared serviceagreement (i.e. University <strong>of</strong> <strong>Guelph</strong> ice subsidy for sports groups)<strong>City</strong> <strong>of</strong> <strong>Guelph</strong> – <strong>2013</strong> Tax-supported Operating <strong>Budget</strong>149
Community and Social ServicesTrend AnalysisYear/Year Revenue Comparison$300$270$240$210‘000s$180$150$120$90$60$30$0User fees and service chargesExternal recoveriesInternal recoveries2012 <strong>2013</strong><strong>City</strong> <strong>of</strong> <strong>Guelph</strong> – <strong>2013</strong> Tax-supported Operating <strong>Budget</strong>150
Community and Social ServicesYear/Year Expenditure Comparison$1,050$900$750‘000s$600$450$300$150$0Salary, wages and benefitsPurchased goodsPurchased servicesOther transfersFinancial expensesInternal charges2012 <strong>2013</strong><strong>City</strong> <strong>of</strong> <strong>Guelph</strong> – <strong>2013</strong> Tax-supported Operating <strong>Budget</strong>151
Community and Social Services<strong>2013</strong> Operating <strong>Budget</strong>2012<strong>Budget</strong><strong>2013</strong>Base<strong>Budget</strong><strong>2013</strong>Eff/New/GrowthImpact fromCapital<strong>2013</strong>Requested<strong>Budget</strong><strong>2013</strong><strong>Budget</strong>Change $<strong>2013</strong><strong>Budget</strong>Change %Community and Social Services45 Business ServicesRevenueUser Fees and Service Charges ($5,900) (6,400) $0 ($6,400) ($500) 8.5%Licenses and Permits 0 0 0 0 0 0External Recoveries (4,500) 0 0 0 4,500 (100.0%)Total Revenue (10,400) (6,400) 0 (6,400) 4,000 (38.5%)ExpenditureSalary, Wage and Benefits 972,272 1,014,020 0 1,014,020 41,748 4.3%Purchased Goods 16,600 17,400 0 17,400 800 4.8%Purchased Services 328,760 309,840 0 309,840 (18,920) (5.8%)Other Transfers 25,000 25,000 0 25,000 0 0.0%Financial Expenses 92,858 96,358 0 96,358 3,500 3.8%Total Expenditure 1,435,490 1,462,618 0 1,462,618 27,128 1.9%Net Before Internal Charges and Recoveries 1,425,090 1,456,218 0 1,456,218 31,128 2.2%Internal Charges and RecoveriesInternal Charges 165,950 168,300 0 168,300 2,350 1.4%Internal Recoveries (298,600) (292,180) 0 (292,180) 6,420 (2.2%)Total Internal Charges and Recoveries (132,650) (123,880) 0 (123,880) 8,770 (6.6%)Net <strong>Budget</strong> 1,292,440 1,332,338 0 1,332,338 39,898 3.1%<strong>City</strong> <strong>of</strong> <strong>Guelph</strong> – <strong>2013</strong> Tax-supported Operating <strong>Budget</strong>152
Community and Social Services>> Corporate Building MaintenanceThe department plays a central role in city building maintenance and ensures all <strong>City</strong>-owned facilities are safe,clean, accessible and enjoyable.• Administer legislated facilities management activities including backflow prevention, annual fire alarm andelevator inspections, Electrical Safety Authority (ESA) inspections, fire safety plans, and hazardous materialsinventory• Perform preventative and on-demand maintenance in more than 80 facilities• Contribute to structural assessments for more than 150 <strong>City</strong>-owned structures and plan for remediation asrequired• Ensure <strong>City</strong> facilities remain in good condition throughout their life cycle and recommend replacement asappropriate• Implement energy-efficiency upgrades to reduce facility operating costs as part <strong>of</strong> Corporate EnergyManagement Plan• Review proposals for new <strong>City</strong> facilities to ensure operational considerations are taken into accountFinancial SnapshotCorporate BuildingMaintenance2012<strong>Budget</strong><strong>2013</strong>RequestedYear/YearIncrease ($)Year/YearIncrease (%)Funding SourcesTax-supported % User Fee % Grants %$2,665,419 $2,677,590 $12,171 0.5% 95.3% 4.7%<strong>City</strong> <strong>of</strong> <strong>Guelph</strong> – <strong>2013</strong> Tax-supported Operating <strong>Budget</strong>153
Community and Social ServicesIndicator 2011Hours spent on preventativemaintenanceGross floor area <strong>of</strong> buildingsmaintainedDollars spent on life cyclereplacement projectsDollars spent on utilities (gas andelectricity) at <strong>City</strong> Hall2012 Accomplishments• Completed $700,000 worth <strong>of</strong> structural repairs to more than 20 high and medium priority buildings• Continued life cycle replacements and repairs to address three-year backlog; extended the life <strong>of</strong> theseassets and improved energy-efficiency• Established commissioning team to facilitate initial operation <strong>of</strong> new facilities including Clair RoadEmergency Services Centre, the <strong>Guelph</strong> Civic Museum, and the Market Square Pavilion; ensures facilities areenergy-efficient from the start and that staff are trained in their operation and maintenance to minimizedown time for repairs and reduce impact on users• Commissioned rink and interactive water feature in Market Square, operated the facility and providedoperational support when hosting community events and performances• Established centralized call centre for Corporate Building Maintenance service requests and beganimplementing service level agreements with other <strong>City</strong> departments to manage workload and make iteasier to address a spill or equipment breakdown; agreements ensure maintenance items don’t get missedand help staff budget appropriately for maintenanceKey Performance MeasuresProjected2012Projected<strong>2013</strong> Comments2,200 2,500 2,500 Increased focus on preventive maintenance to avoiddisruptions and emergency repairs1,110,000square feet1,110,000square feet1,115,500square feet$1,700,000 $2,100,000 $2,210,000 Increase due to corporate investment in life cyclereplacement$271,216 $275,000 $297,000 Plan to mitigate impact <strong>of</strong> increasing energy prices byimplementing efficiency upgrades<strong>City</strong> <strong>of</strong> <strong>Guelph</strong> – <strong>2013</strong> Tax-supported Operating <strong>Budget</strong>154
Community and Social Services<strong>2013</strong> Objectives• Continued focus on preventive maintenance (2,500 hours) to prevent equipment disruptions and costlyemergency repairs• Complete required structural repairs on high-risk buildings, continue performing structural repairs onmedium-risk buildings, and begin assessment <strong>of</strong> low-risk buildings• Develop and implement a building asset database to improve forecasting and budgeting for life cyclereplacement and repairs• Develop and implement standard operating procedures for emergency generator service, after hoursservice calls, and preservation <strong>of</strong> stranded assets; minimize disruptions and improve service outside <strong>of</strong>typical operating hours• Optimize energy use by increasing in-house knowledge <strong>of</strong> building automation systems and improvedenergy tracking as part <strong>of</strong> Corporate Energy Management Plan• Establish a benchmark for energy use at <strong>City</strong> Hall and encourage energy conservation to reduce operatingcosts as part <strong>of</strong> Corporate Energy Management Plan• Complete $2.2 million dollars in life cycle replacements including the South End Community ParkWashroom Facility• Implement service level agreements to ensure accountability and transparency in our administrativeprocesses with departmental partnersKey changes in <strong>2013</strong>• Decreased internal charges due to reduced chargeback from Operations, Transit and Emergency Services forservices in Market Square, no service reduction<strong>City</strong> <strong>of</strong> <strong>Guelph</strong> – <strong>2013</strong> Tax-supported Operating <strong>Budget</strong>155
Community and Social ServicesTrend AnalysisYear/Year Revenue Comparison$135$120$105$90‘000s$75$60$45$30$15$0User fees and service chargesExternal recoveriesInternal recoveries2012 <strong>2013</strong><strong>City</strong> <strong>of</strong> <strong>Guelph</strong> – <strong>2013</strong> Tax-supported Operating <strong>Budget</strong>156
Community and Social ServicesYear/Year Expenditure Comparison$1,800$1,600$1,400$1,200‘000s$1,000$800$600$400$200$0Salary, wages and benefitsPurchased goodsPurchased servicesInternal charges2012 <strong>2013</strong><strong>City</strong> <strong>of</strong> <strong>Guelph</strong> – <strong>2013</strong> Tax-supported Operating <strong>Budget</strong>157
Community and Social Services<strong>2013</strong> Operating <strong>Budget</strong>2012<strong>Budget</strong><strong>2013</strong>Base<strong>Budget</strong><strong>2013</strong>Eff/New/GrowthImpact fromCapital<strong>2013</strong>Requested<strong>Budget</strong><strong>2013</strong><strong>Budget</strong>Change $<strong>2013</strong><strong>Budget</strong>Change %Community and Social Services44 Corporate Building MaintenanceRevenueUser Fees and Service Charges $0 (2,500) $0 ($2,500) ($2,500) 0External Recoveries (126,000) (129,800) 0 (129,800) (3,800) 3.0%Total Revenue (126,000) (132,300) 0 (132,300) (6,300) 5.0%ExpenditureSalary, Wage and Benefits 1,622,690 1,661,573 0 1,661,573 38,883 2.4%Purchased Goods 639,299 640,227 0 640,227 928 0.1%Purchased Services 250,330 244,230 0 244,230 (6,100) (2.4%)Financial Expenses 0 0 0 0 0 0Total Expenditure 2,512,319 2,546,030 0 2,546,030 33,711 1.3%Net Before Internal Charges and Recoveries 2,386,319 2,413,730 0 2,413,730 27,411 1.1%Internal Charges and RecoveriesInternal Charges 343,400 315,700 0 315,700 (27,700) (8.1%)Internal Recoveries (64,300) (51,840) 0 (51,840) 12,460 (19.4%)Total Internal Charges and Recoveries 279,100 263,860 0 263,860 (15,240) (5.5%)Net <strong>Budget</strong> 2,665,419 2,677,590 0 2,677,590 12,171 0.5%<strong>City</strong> <strong>of</strong> <strong>Guelph</strong> – <strong>2013</strong> Tax-supported Operating <strong>Budget</strong>158
Community and Social Services>> Community EngagementThe department researches, develops, implements and enhances ways to inform, educate, engage andcollaborate with citizens and develops policies and programs that reflect the needs <strong>of</strong> an increasingly diverseand complex community. The six divisions within the department strive to improve community well-beingand strengthen citizen and stakeholder engagement to ensure inclusive and responsive local government.Accessibility Services• Ensure programs, services and facilities are inclusive, accessible and compliant with the Accessibility forOntarians with Disabilities Act (AODA), and adhere to the Ontario Human Rights Code as it relates topersons with disabilities• Facilitate <strong>Guelph</strong>’s Accessibility Advisory Committee and support individual citizens in advocating forincreased accessibilityCommunity Engagement• Develop <strong>City</strong>-wide framework to <strong>of</strong>fer more consistent, transparent, inclusive and compelling ways toinform, educate, engage and collaborate with community members when researching and developingmunicipal policies and programs• Show residents and community groups how to provide more accessible and inclusive events and programsthough training, mentoring, facilitation, funding and in-kind supportLocal Immigration Partnership• Convene and support community partnerships to promote economic and social inclusion <strong>of</strong> immigrants• Develop an online Immigration Portal to support the economic and social inclusion <strong>of</strong> newcomers bothpre-and post-arrivalSeniors Services• Manage a 24,000 square-foot facility (Evergreen Seniors Community Centre) and <strong>of</strong>fer events, programs,volunteer management and dining room services in partnership with the <strong>Guelph</strong> Wellington SeniorsAssociation• Ensure older adults have opportunities to participate in <strong>City</strong> events, programs, initiatives, and policydecisions impacting the lives <strong>of</strong> seniors and other community members in <strong>Guelph</strong><strong>City</strong> <strong>of</strong> <strong>Guelph</strong> – <strong>2013</strong> Tax-supported Operating <strong>Budget</strong>159
Community and Social ServicesSocial Services Policy and Liaison• Develop, implement and evaluate policies and programs to support vibrant and inclusive communitiesincluding the <strong>Guelph</strong> Community Wellbeing Initiative, <strong>Guelph</strong> Investment Strategy and the Affordable BusPass• Provide oversight, research and program expertise; review social services delivered by the County <strong>of</strong>Wellington and non-pr<strong>of</strong>it health and social service providers including <strong>Guelph</strong>’s emergency youth shelterand long-term care services to ensure they meet community needs and expectationsYouth Services• Coordinate youth services and advocate for <strong>City</strong> programs and policies designed to engage, consider andreflect the needs <strong>of</strong> youth in <strong>Guelph</strong>Financial Snapshot2012<strong>Budget</strong><strong>2013</strong>RequestedYear/YearIncrease ($)Year/YearIncrease (%)Funding SourcesTax-supported % User Fee % Grants %Community Engagement $2,087,211 $2,349,145 $261,934 12.5% 66.0% 22.6% 11.4%<strong>City</strong> <strong>of</strong> <strong>Guelph</strong> – <strong>2013</strong> Tax-supported Operating <strong>Budget</strong>160
Community and Social Services2012 Accomplishments• Developed and introduced <strong>Guelph</strong>’s Community Engagement Framework to improve citizen participationin <strong>City</strong> decision-making• Established a cross-departmental team to evaluate the <strong>City</strong>’s options to provide high-quality and costeffectivelong-term care services for <strong>Guelph</strong>• Celebrated 20 years <strong>of</strong> successful partnership with <strong>Guelph</strong> Wellington Seniors Association• Developed Community Investment Strategy to improve how the <strong>City</strong> provides financial support for localnot-for-pr<strong>of</strong>it organizations and community groups using existing Council-approved $3 million in fundingfor <strong>2013</strong>• Processed 1,800 applications for <strong>Guelph</strong>’s Affordable Bus Pass pilot project• Engaged 292 stakeholders to develop <strong>Guelph</strong>’s Older Adult Strategy and 10-year implementation plan toensure the highest possible quality <strong>of</strong> life for <strong>Guelph</strong>’s aging population• Engaged local youth and key stakeholders in developing <strong>Guelph</strong>’s <strong>2013</strong>-18 Youth Strategy to increasemeaningful youth engagement and participation in local government• Monitored all municipally-funded programs administered by the County <strong>of</strong> Wellington to increaseaccountability and transparency in the provision <strong>of</strong> these services• Completed design and costing for a permanent skatepark to support the proposed development <strong>of</strong> apermanent facility by 2016• STEPS (support through engagement, programming and sport) program partnership with WyndhamHouse youth shelter provided 926 underserved or marginalized young people with free recreational andsocial programming including yoga, beach volleyball, pottery, videography, basketball, and indoor rockclimbing• Updated <strong>Guelph</strong>’s Facility Accessibility Design Manual (FADM) to ensure a transparent process whenapplying the FADM standards• Engaged over 70 individuals representing various groups in the community, including newcomers,ethno-cultural organizations, service providers, businesses and the public in creating a more welcomingand inclusive community for immigrants• Gathered more than 3,000 citizen inputs to be used in developing <strong>Guelph</strong>’s 10-year Community WellbeingPlan<strong>City</strong> <strong>of</strong> <strong>Guelph</strong> – <strong>2013</strong> Tax-supported Operating <strong>Budget</strong>161
Community and Social ServicesKey Performance MeasuresPerformance MeasureDepartmental customer/participant/partner satisfaction2011Actual2012Estimated<strong>2013</strong>TargetsComments90% 91.9% 92% Satisfaction <strong>of</strong> our customers, partners and participants is a goodindicator <strong>of</strong> their level <strong>of</strong> engagement, their likelihood to continue toparticipate and impacts our revenuesVolunteer hours 6,1679 60,000 40,000 Anticipate a decrease as neighbourhood groups are incorporated andwill not be included in our statsProgram/training attendees 5,000 33,066 28,066 This year’s estimated included increased activities in Local ImmigrationPartnership (LIP) and Youth Services. <strong>2013</strong> Targets relate toincorporation <strong>of</strong> neighbourhood groups and potential end <strong>of</strong> LIPfunding in March <strong>2013</strong>.<strong>2013</strong> Objectives• Implement Community Engagement Framework in all <strong>City</strong> departments including staff training, supportsystems and tools• Recommend high-quality, cost-effective option for long-term care services that <strong>of</strong>fers financialaccountability, transparency and sustainability for the <strong>City</strong>• Improve Community Grant program and develop innovation fund to better respond to community needsin a more transparent and accountable way; implement in 2014• Continue Affordable Bus Pass pilot project, evaluate the pilot project and recommend appropriate action in2014• Implement Council-approved Older Adult Strategy implementation plan to ensure the highest possiblequality <strong>of</strong> life for <strong>Guelph</strong> seniors• Implement Council-approved <strong>2013</strong>-18 Youth Strategy and recommendations for engaging youth inmunicipal government• Implement community benefit agreements for key service partners such as the youth shelter, the <strong>Guelph</strong>Wellington Senior’s Association to outline shared goals, outcomes and mutual responsibilities• Partner with County <strong>of</strong> Wellington and several key stakeholders to develop Housing and Homelessness Planwhich meets a legislated requirement, highlighting community priorities and actions with an emphasis onaffordable housing• Develop response to provincial funding changes for social service recipients to ensure services meet localneeds• Present community skatepark design and budget to <strong>City</strong> Council for endorsement<strong>City</strong> <strong>of</strong> <strong>Guelph</strong> – <strong>2013</strong> Tax-supported Operating <strong>Budget</strong>162
Community and Social Services• Explore funding opportunities to continue STEPS partnership with Wyndham House to continue <strong>of</strong>feringrecreation and social programming to marginalized youth after <strong>2013</strong>• Complete 10 budgeted Facility Accessibility Audits in high-traffic facilities to ensure accessibility inaccordance with the Corporate FADM• Develop and launch Immigration Portal as a centralized source <strong>of</strong> information for new immigrants,established residents, and local service providers on local services and activities that support immigrantattraction, settlement and retention in <strong>Guelph</strong> and Wellington County.• Implement recommendations <strong>of</strong> Community Wellbeing Plan to improve the quality <strong>of</strong> life inneighbourhoods, communities and across the entire cityKey Changes in <strong>2013</strong>• Increase by $214,350 to operate the Affordable Bus Pass project for a full 12 months in <strong>2013</strong>• Increase compensation by $119,765 or 7.7% due in part to additional temporary staff creating ImmigrationPortal ($75,000) and <strong>of</strong>fset by $119,350 increase in grant funding for the project<strong>City</strong> <strong>of</strong> <strong>Guelph</strong> – <strong>2013</strong> Tax-supported Operating <strong>Budget</strong>163
Community and Social ServicesTrend AnalysisYear/Year Revenue Comparison$700$600$500‘000s$400$300$200$100$0User fees and service chargesProduct salesExternal recoveriesGrants2012 <strong>2013</strong>Internal recoveries<strong>City</strong> <strong>of</strong> <strong>Guelph</strong> – <strong>2013</strong> Tax-supported Operating <strong>Budget</strong>164
Community and Social ServicesYear/Year Expenditure Comparison$1,800$1,600$1,400$1,200‘000s$1,000$800$600$400$200$0Salary, wages and benefitsPurchased goodsPurchased servicesOther transfersInternal charges2012 <strong>2013</strong><strong>City</strong> <strong>of</strong> <strong>Guelph</strong> – <strong>2013</strong> Tax-supported Operating <strong>Budget</strong>165
Community and Social Services<strong>2013</strong> Operating <strong>Budget</strong>2012<strong>Budget</strong><strong>2013</strong>Base<strong>Budget</strong><strong>2013</strong>Eff/New/GrowthImpact fromCapital<strong>2013</strong>Requested<strong>Budget</strong><strong>2013</strong><strong>Budget</strong>Change $<strong>2013</strong><strong>Budget</strong>Change %Community and Social Services42 Community Engagement and Social Services LiaisonRevenueUser Fees and Service Charges ($221,600) (662,100) $0 ($662,100) ($440,500) 198.8%Product Sales (90,100) (90,100) 0 (90,100) 0 0.0%External Recoveries (52,900) (52,900) 0 (52,900) 0 0.0%Grants (284,067) (405,305) 0 (405,305) (121,238) 42.7%Total Revenue (648,667) (1,210,405) 0 (1,210,405) (561,738) 86.6%ExpenditureSalary, Wage and Benefits 1,557,437 1,677,202 0 1,677,202 119,765 7.7%Purchased Goods 188,240 210,142 0 210,142 21,902 11.6%Purchased Services 719,488 768,278 0 768,278 48,790 6.8%Other Transfers 288,038 53,088 0 53,088 (234,950) (81.6%)Total Expenditure 2,753,203 2,708,710 0 2,708,710 (44,493) (1.6%)Net Before Internal Charges and Recoveries 2,104,536 1,498,305 0 1,498,305 (606,231) (28.8%)Internal Charges and RecoveriesInternal Charges 64,275 927,740 0 927,740 863,465 1,343.4%Internal Recoveries (81,600) (76,900) 0 (76,900) 4,700 (5.8%)Total Internal Charges and Recoveries (17,325) 850,840 0 850,840 868,165 (5,011.1%)Net <strong>Budget</strong> 2,087,211 2,349,145 0 2,349,145 261,934 12.5%<strong>City</strong> <strong>of</strong> <strong>Guelph</strong> – <strong>2013</strong> Tax-supported Operating <strong>Budget</strong>166
Community and Social Services>> Culture and TourismThe department develops and delivers creative, compelling and innovative programs that improve <strong>Guelph</strong>’squality <strong>of</strong> life and community well-being. Culture and Tourism activities make the city more inclusive andappealing for residents, businesses and visitors and allow <strong>Guelph</strong> to bring in revenue from outside the city. Thedepartment coordinates programming, marketing, fundraising and other activities to support events, exhibitsand performances in <strong>Guelph</strong>’s Market Square, River Run Centre, Sleeman Centre, <strong>Guelph</strong> Civic Museum andJohn McCrae House.Cultural Development• Manage volunteer services at <strong>Guelph</strong>’s culture and heritage facilities which minimizes staffing costs• Coordinate and promote arts and culture programs and initiatives in partnership with the arts community• Liaise with and provide support for community arts and cultural organizations and individuals contributingto a vibrant, creative and inclusive community<strong>Guelph</strong> Museums• Manage operation <strong>of</strong> the new <strong>Guelph</strong> Civic Museum; the facility has three times the square footage tostore, archive, program and exhibit <strong>Guelph</strong>’s collection <strong>of</strong> more than 30,000 artefacts celebrating the<strong>Guelph</strong>’s social, cultural and industrial history• Manage operations <strong>of</strong> <strong>Guelph</strong>’s National Historic Site John McCrae House including exhibits and educationprogramsRiver Run Centre• Manage and promote events and performances at River Run Centre’s 785 seat theatre, 225 seat theatre andmulti-purpose reception space• Offer high-quality performances and events designed to attract and delight audiences <strong>of</strong> all ages and tastesSleeman Centre• Manage all operations <strong>of</strong> the Sleeman Centre; the 4,500 seat arena is home ice for <strong>Guelph</strong>’s Ontario HockeyLeague team, the <strong>Guelph</strong> Storm, and the premiere location for sports and entertainment in the city<strong>City</strong> <strong>of</strong> <strong>Guelph</strong> – <strong>2013</strong> Tax-supported Operating <strong>Budget</strong>167
Community and Social ServicesTourism• Deliver front-line visitor information services at <strong>City</strong> Hall and online via visitguelphwellington.ca to ensurevisitors feel welcome and enjoy their experience in the city• Provide destination marketing programs for tourism industry partners through the Tourism PartnershipProgram; promote <strong>Guelph</strong> as an attractive tourist destination (cost recovery program)Financial Snapshot2012<strong>Budget</strong><strong>2013</strong>RequestedYear/YearIncrease ($)Year/YearIncrease (%)Funding SourcesTax-supported % User Fee % Grants %Culture and Tourism $2,132,001 $2,088,367 ($43,634) (2.0%) 32.5% 65.3% 2.2%2012 Accomplishments• Opened the new <strong>Guelph</strong> Civic Museum in the former Loretto Convent; increased attendance and revenue• Opened Market Square and hosted donor reception to engage and thank community members forcontributing to the success <strong>of</strong> the new facility• Hosted several well-attended community events at Market Square including the Mayor’s New Year’s Levee,movie nights, Fourth Friday events, John Galt Day, RBC Market Day skates• Improved Arts and Culture section on guelph.ca to raise community awareness about programs andservices• Improved service to Sleeman Centre guests through <strong>Guelph</strong>’s Fan Experience program; spectators use smartphones to access promotional <strong>of</strong>fers or report concerns in real-time• Introduced three-stream recycling at the Sleeman Centre to help reach <strong>Guelph</strong>’s waste diversion goals• Secured funding to purchase stage equipment for Market Square and other event spaces• Celebrated National Culture Days including River Run’s 15th Anniversary open house and tours• Exceeded revenue targets for Visit <strong>Guelph</strong> tourism partnership and marketing programs; establishing amembership <strong>of</strong> over 150 industry partners including destinations, hotels, restaurants and other hospitalityvenues• Used Ontario Market Investment Fund to deliver the Taste Real Culinary Tourism program for <strong>Guelph</strong> andWellington County, and provided marketing benefits to increase business for more than 120 partners in theregion• Raised more than $40,000 for three food access and food security organizations in <strong>Guelph</strong> through the TasteReal Field Dinner• Launched <strong>Guelph</strong>’s first mobile application—Visit <strong>Guelph</strong>—highlighting local features and events; one <strong>of</strong>only five mobile tourism apps in Ontario<strong>City</strong> <strong>of</strong> <strong>Guelph</strong> – <strong>2013</strong> Tax-supported Operating <strong>Budget</strong>168
Community and Social ServicesKey Performance MeasuresPerformance Measure2011Actual2012Estimated<strong>2013</strong>TargetPer capita revenue from food and beverage at Storm Games $7.34 $7.51 $7.65The <strong>City</strong> does not have direct control over number <strong>of</strong> attendees at <strong>Guelph</strong> Storm games. The success <strong>of</strong> those events greatly impacts the Sleeman Centre bottom line. Animportant performance measure is the per capita revenue from food and beverage sales.Total number <strong>of</strong> River Run Centre attendees 116,705 118,000 120,000Total attendance at River Run-presented shows, combined with rental events and performances, is a good indicator <strong>of</strong> overall usage as well as earned revenue.Museum research requests 1,028 2,500 2,600Research requests are a strong indicator <strong>of</strong> museum activity, staff time and interest from the community. Requests are up significantly from both 2010 and 2011, followingthe relocation to the new Civic Museum.Gross earned revenues ticket sales and admissions charges, food and beverage revenue, revenues for third party services$4,023,000 $4,218,000 $4,265,000provided to clients, sponsorship and fundraising, and tourism revenuesExpected to exceed $ 4,250,000 in <strong>2013</strong> as earned revenues increase with opening <strong>of</strong> new museum, Market Square and increased activity in other facilities along withincreased tourism revenues.<strong>2013</strong> Objectives• Deliver cultural mapping portal; a website identifying, recording, and classifying <strong>Guelph</strong>’s cultural resourcesto support long-term cultural planning and grow <strong>Guelph</strong>’s creative economy• Review Tourism’s operations to ensure <strong>Guelph</strong> is using best business model to deliver exceptional customerservice to visitors, and marketing benefits to our tourism industry partners• Complete a corporate mural policy to govern the selection and installation <strong>of</strong> murals on public property;beautification and anti-graffiti initiative• Develop new revenue generating opportunities for the <strong>Guelph</strong> Civic Museum• Introduce the Sweet Seat program at the Sleeman Centre allowing guests to order and pay for concessionfare from their seat; improve service to guests and increase revenue from sales• Continue developing and expanding events and programs in Market Square to encourage communityusage• Host the <strong>2013</strong> OFSSA wrestling championships at the Sleeman Centre with support from Tourism;substantial economic impact for the area including hotels, restaurants, and local shopping• Implement recommended upgrades to reduce energy consumption and costs as part <strong>of</strong> the CorporateEnergy Management Plan<strong>City</strong> <strong>of</strong> <strong>Guelph</strong> – <strong>2013</strong> Tax-supported Operating <strong>Budget</strong>169
Community and Social ServicesKey Changes in <strong>2013</strong>• Increase purchased goods by $96,590 or 8.1% due to increasing utility costs ($36,100) and operating costs($69,560) <strong>of</strong>fset by a reduction in promotional materials• Increase user fees and service charges revenue by $98,926 or 5.1%• Increase product sales revenues by $118,094 due to increased food and beverage sales. This increase is<strong>of</strong>fset by higher operating costs• Decrease grant revenue and associated expenditures by $80,000 each as no grant is expected from theCreative Communities Prosperity Fund• Based on a full year <strong>of</strong> operating the new <strong>Guelph</strong> Civic Museum, increased revenue and decreased expenseswill result in overall reduction <strong>of</strong> $42,868 in operating costs<strong>City</strong> <strong>of</strong> <strong>Guelph</strong> – <strong>2013</strong> Tax-supported Operating <strong>Budget</strong>170
Community and Social ServicesTrend AnalysisYear/Year Revenue Comparison$2,500$2,000‘000s$1,500$1,000$500$0User fees and service chargesProduct salesExternal recoveriesGrants2012 <strong>2013</strong>Internal recoveries<strong>City</strong> <strong>of</strong> <strong>Guelph</strong> – <strong>2013</strong> Tax-supported Operating <strong>Budget</strong>171
Community and Social ServicesYear/Year Expenditure Comparison$4,000$3,500$3,000$2,500‘000s$2,000$1,500$1,000$500$0Salary, wages and benefitsPurchased goodsPurchased servicesFinancial expensesInternal charges2012 <strong>2013</strong><strong>City</strong> <strong>of</strong> <strong>Guelph</strong> – <strong>2013</strong> Tax-supported Operating <strong>Budget</strong>172
Community and Social Services<strong>2013</strong> Operating <strong>Budget</strong>2012<strong>Budget</strong><strong>2013</strong>Base<strong>Budget</strong><strong>2013</strong>Eff/New/GrowthImpact fromCapital<strong>2013</strong>Requested<strong>Budget</strong><strong>2013</strong><strong>Budget</strong>Change $<strong>2013</strong><strong>Budget</strong>Change %Community and Social Services43 Culture and Tourism DivisionRevenueUser Fees and Service Charges ($1,943,574) (2,042,500) $0 ($2,042,500) ($98,926) 5.1%Product Sales (1,101,306) (1,219,400) 0 (1,219,400) (118,094) 10.7%External Recoveries (954,046) (933,550) 0 (933,550) 20,496 (2.1%)Grants (219,000) (139,000) 0 (139,000) 80,000 (36.5%)Total Revenue (4,217,926) (4,334,450) 0 (4,334,450) (116,524) 2.8%ExpenditureSalary, Wage and Benefits 3,422,359 3,461,717 0 3,461,717 39,358 1.2%Purchased Goods 1,197,325 1,293,915 0 1,293,915 96,590 8.1%Purchased Services 1,323,198 1,251,800 0 1,251,800 (71,398) (5.4%)Long Term Debt Charges 0 0 0 0 0 0.0%Financial Expenses 80,150 83,650 0 83,650 3,500 4.4%Total Expenditure 6,023,032 6,091,082 0 6,091,082 68,050 1.1%Net Before Internal Charges and Recoveries 1,805,106 1,756,632 0 1,756,632 (48,474) (2.7%)Internal Charges and RecoveriesInternal Charges 357,500 366,140 0 366,140 8,640 2.4%Internal Recoveries (30,605) (34,405) 0 (34,405) (3,800) 12.4%Total Internal Charges and Recoveries 326,895 331,735 0 331,735 4,840 1.5%Net <strong>Budget</strong> 2,132,001 2,088,367 0 2,088,367 (43,634) (2.0%)<strong>City</strong> <strong>of</strong> <strong>Guelph</strong> – <strong>2013</strong> Tax-supported Operating <strong>Budget</strong>173
Community and Social Services>> Parks and Recreation<strong>Guelph</strong>’s parks, trails, recreation spaces and programs are essential to the quality <strong>of</strong> life in our city. The Parksand Recreation department ensures <strong>Guelph</strong>’s parks and open spaces are well-designed, safe and appealing,and its two divisions—Parks and Open Space, and Recreation and Facility Programming—boost communitywell-being by promoting affordable ways to enjoy a healthy, active lifestyle.NOTE: For the purpose <strong>of</strong> this report, a financial snapshot, 2012 accomplishments, key performance measures, <strong>2013</strong> objectives andkey changes are included for each division.Parks and Open Space• Design and build new parks and trails• Review development applications to ensure adequate parkland or cash-in-lieu to acquire new park land• Renew and redevelop existing parks and infrastructure, i.e., playground retr<strong>of</strong>its• Maintain parks and trails to ensure public safety and enjoyment <strong>of</strong> public spaces; grass cutting and sportsfield, playground and trail maintenance, horticulture services and park sanitation• Operate splash pads, wading pools and amusement rides• Provide operational support for hundreds <strong>of</strong> community events including festivals and sports tournamentsFinancial Snapshot2012<strong>Budget</strong><strong>2013</strong>RequestedYear/YearIncrease ($)Year/YearIncrease (%)Funding SourcesTax-supported % User Fee % Grants %Parks $4,847,419 $5,059,132 $211,713 4.4% 89.3% 10.7%<strong>City</strong> <strong>of</strong> <strong>Guelph</strong> – <strong>2013</strong> Tax-supported Operating <strong>Budget</strong>174
Community and Social Services2012 Accomplishments• Implemented master plans for Castlebury and Wilson Farm Parks, and initiated the second phase <strong>of</strong>construction for Eastview sports fields including four lit and irrigated full-sized sports fields• Retr<strong>of</strong>itted Norm Jary and Hanlon Creek Park splash pads using ultra violet water treatment systems to meetprovincial public health guidelines• Retr<strong>of</strong>itted and modernized playground equipment at Wolfond Park East and Eramosa River Park, andupgraded the resilient base surface at Colonial, Dakota and Gosling Gardens Parks to meet CanadianStandards Association safety standards• Collaborated with Engineering Services to implement four kilometres <strong>of</strong> multi-use trail in the Hanlon CreekBusiness Park as part <strong>of</strong> the <strong>Guelph</strong> Trails Master Plan• Upgraded irrigation systems to be compatible with a centralized computer-controlled irrigation system for<strong>City</strong> sports fieldsKey Performance MeasuresPerformance MeasureOperating costs <strong>of</strong> parks, per hectareParks are public open areas used for recreation and leisure while preserving our natural heritage. Thisfigure includes active, programmable, bookable and passive spaces.Total kilometres <strong>of</strong> trail per 1000 residentsTrails provide for leisure opportunities, alternate transportation routes and linkages for local wildlife.Hectares <strong>of</strong> parks and open spaceOutdoor public open spaces that are generally accessible and provide opportunities and benefits <strong>of</strong>recreation, while contributing to the protection <strong>of</strong> the open space and the environment.2011Actual2012EstimatedProjected<strong>2013</strong>$3,762 $3,823 $3,7830.345 0.346 0.3681184 1268 1310<strong>City</strong> <strong>of</strong> <strong>Guelph</strong> – <strong>2013</strong> Tax-supported Operating <strong>Budget</strong>175
Community and Social Services<strong>2013</strong> Objectives• Develop business case and explore alternative funding sources and partnerships to support the South EndCommunity Centre• Implement centralized irrigation control system in partnership with Information Technology and WaterServices to reduce irrigation water consumption and associated energy costs by about 30 per cent, whileproviding optimum growing conditions for natural sports turf• Retr<strong>of</strong>it playground equipment at Bathgate, Dakota, Franchetto, Golfview, Hartsland, Macalister and PineRidge Parks• Build 2.25 kilometres <strong>of</strong> trail at Castlebury Park/Northwest drainage channel, Eastview, Watson CreekSubdivision Northern Heights• Design 2.2 kilometres <strong>of</strong> the Waterfall Trail along the Speed River between Silvercreek Park and ImperialRoad• Continue assessing park infrastructure as part <strong>of</strong> park infrastructure gap analysis and capital budget forecast;not including required life cycle playground equipment replacement• Explore innovative recreational, cultural and educational programs to create parks as living communitycentres to enhance the park experienceKey Changes in <strong>2013</strong>• Increase compensation by $366,637 or 11.4% <strong>of</strong> which $185,400 is associated with new parks, includingEastview Sports Park, Wilson Farm Park and Castlebury Parks, becoming operational and increase staff cost<strong>of</strong> $ 117,000 for winter control• Increased internal recoveries by $126,600 or 213.1% mainly due to an increase <strong>of</strong> recoveries from wintercontrol <strong>of</strong>fsetting $117,000 increase in compensation expenditures• Internal charges increase <strong>of</strong> $19,500 or 1.4% through maintenance management charges by Fleet• Increase user fees and service charges revenue by $71,600 or 18.8% <strong>of</strong> which $49,000 is associated with newparks, including Eastview Sports Park, Wilson Farm Park and Castlebury Parks, become operational<strong>City</strong> <strong>of</strong> <strong>Guelph</strong> – <strong>2013</strong> Tax-supported Operating <strong>Budget</strong>176
Community and Social ServicesTrend AnalysisYear/Year Revenue Comparison$500$450$400$350‘000s$300$250$200$150$100$50$0User fees and service chargesProduct salesExternal recoveriesInternal recoveries2012 <strong>2013</strong><strong>City</strong> <strong>of</strong> <strong>Guelph</strong> – <strong>2013</strong> Tax-supported Operating <strong>Budget</strong>177
Community and Social ServicesYear/Year Expenditure Comparison$4,000$3,500$3,000$2,500‘000s$2,000$1,500$1,000$500$0Salary, wages and benefitsPurchased goodsPurchased servicesOther transfersInternal charges2012 <strong>2013</strong><strong>City</strong> <strong>of</strong> <strong>Guelph</strong> – <strong>2013</strong> Tax-supported Operating <strong>Budget</strong>178
Community and Social Services<strong>2013</strong> Operating <strong>Budget</strong>2012<strong>Budget</strong><strong>2013</strong>Base<strong>Budget</strong><strong>2013</strong>Eff/New/GrowthImpact fromCapital<strong>2013</strong>Requested<strong>Budget</strong><strong>2013</strong><strong>Budget</strong>Change $Community and Social Services46 ParksRevenueUser Fees and Service Charges ($381,400) (404,000) ($49,000) ($453,000) ($71,600) 18.8%Product Sales (28,000) (28,600) 0 (28,600) (600) 2.1%External Recoveries (122,600) (123,100) 0 (123,100) (500) 0.4%Total Revenue (532,000) (555,700) (49,000) (604,700) (72,700) 13.7%ExpenditureSalary, Wage and Benefits 3,219,269 3,400,501 185,400 3,585,901 366,632 11.4%Purchased Goods 642,678 590,940 44,100 635,040 (7,638) (1.2%)Purchased Services 158,672 174,091 15,100 189,191 30,519 19.2%Other Transfers 25,000 27,000 0 27,000 2,000 8.0%Financial Expenses 0 0 0 0 0 #DIV/0!Total Expenditure 4,045,619 4,192,532 244,600 4,437,132 391,513 9.7%Net Before Internal Charges and Recoveries 3,513,619 3,636,832 195,600 3,832,432 318,813 9.1%Internal Charges and RecoveriesInternal Charges 1,393,200 1,412,700 0 1,412,700 19,500 1.4%Internal Recoveries (59,400) (186,000) 0 (186,000) (126,600) 213.1%Total Internal Charges and Recoveries 1,333,800 1,226,700 0 1,226,700 (107,100) (8.0%)Net <strong>Budget</strong> 4,847,419 4,863,532 195,600 5,059,132 211,713 4.4%<strong>2013</strong><strong>Budget</strong>Change %<strong>City</strong> <strong>of</strong> <strong>Guelph</strong> – <strong>2013</strong> Tax-supported Operating <strong>Budget</strong>179
Community and Social ServicesRecreation and Facility Programming• Operate and maintain safe, clean and affordable recreational facilities including indoor and outdoor poolsand arenas• Develop and provide recreation programming <strong>of</strong> interest to people <strong>of</strong> all ages and skill levels includingaquatic lessons for all skill levels and summer camp programs• Liaise with sports groups and associations using <strong>City</strong> parks and facilities• Develop policies regarding use <strong>of</strong> <strong>City</strong> parks and facilities to ensure safe, consistent and equitable practices• Recreation facility development including Victoria Road Community Centre renovation, South EndCommunity Centre business case developmentFinancial SnapshotRecreation and FacilityProgramming2012<strong>Budget</strong><strong>2013</strong>RequestedYear/YearIncrease ($)Year/YearIncrease (%)Funding SourcesTax-supported % User Fee % Grants %$1,725,008 $1,818,210 $93,202 5.4% 33.2% 66.0% 0.8%2012 Accomplishments• Contributed to Corporate Energy Management Plan and developed recommendations to reduce energycosts at recreation facilities• Reviewed and improved recreation program <strong>of</strong>ferings to increase participation and revenue• Installed and began commissioning cogeneration system at the West End Community Centre (WECC);provide emergency power at the WECC as part <strong>of</strong> <strong>Guelph</strong>’s emergency preparedness planning, and plan toreduce operating costs• Upgraded refrigeration unit at the Victoria Road Recreation Centre as part <strong>of</strong> scheduled life cycle facilitywork<strong>City</strong> <strong>of</strong> <strong>Guelph</strong> – <strong>2013</strong> Tax-supported Operating <strong>Budget</strong>180
Community and Social ServicesIndicator 2011Number <strong>of</strong> hours used at arenas 14,453.75(including drypad usage)Key Performance Measures2012Estimated <strong>2013</strong> Target Comments14,500 14,520 Ice market is generally static in prime time hours due t<strong>of</strong>ixed supply.Number <strong>of</strong> hours used at pools 10,515 10,565 10,575 Only four primary rental groups for pools. Limited rentalpotential at WECC and Centennial due to existing jointuse agreements and facility programmingNumber <strong>of</strong> swim lessonparticipantsNumber <strong>of</strong> communityprogram participantsNumber <strong>of</strong> admissions inpublic skating and shinnyNumber <strong>of</strong> admissions inpublic swimming10,863 12,340 12,500 Anticipated slower growth driven by demographics -youth are our principal clients for swim lessons, and thepercentage <strong>of</strong> youth in <strong>Guelph</strong> is declining4,352 4,400 4,400 Potential for growth, but limited by lack <strong>of</strong> suitableprogramming space15,591 16,100 16,300 Potential for growth75,403 77,000 77,300 Some potential for growth but times compete withexisting private rentals<strong>2013</strong> Objectives• Transition wading pools and splash pad programming from Park Operations to Recreation Aquatics to alignwith operational expertise• Implement energy conservation initiatives to reduce operating costs as part <strong>of</strong> the Corporate EnergyManagement Plan• Fully commission the cogeneration system at the West End Community Centre; reduce operating costs bycapturing waste heat and using it to heat water at the facility• Initiate background study to renovate the Victoria Road Recreation Centre as the average lifespan <strong>of</strong> amulti-purpose recreational facility is approximately 40 years; 2014 will be the facility’s 40th anniversaryKey Changes in <strong>2013</strong>Increase revenue by $59,843 or 1.7% due to increased user fees, service charges and provincial grants<strong>City</strong> <strong>of</strong> <strong>Guelph</strong> – <strong>2013</strong> Tax-supported Operating <strong>Budget</strong>181
Community and Social ServicesTrend AnalysisYear/Year Revenue Comparison$3,600$3,200$2,800$2,400‘000s$2,000$1,600$1,200$800$400$0User fees and service chargesProduct salesExternal recoveries2012 <strong>2013</strong>GrantsInternal recoveries<strong>City</strong> <strong>of</strong> <strong>Guelph</strong> – <strong>2013</strong> Tax-supported Operating <strong>Budget</strong>182
Community and Social ServicesYear/Year Expenditure Comparison$4,000$3,500$3,000$2,500‘000s$2,000$1,500$1,000$500$0Salary, wages and benefitsPurchased goodsPurchased servicesInternal charges2012 <strong>2013</strong><strong>City</strong> <strong>of</strong> <strong>Guelph</strong> – <strong>2013</strong> Tax-supported Operating <strong>Budget</strong>183
Community and Social Services<strong>2013</strong> Operating <strong>Budget</strong>2012<strong>Budget</strong><strong>2013</strong>Base<strong>Budget</strong><strong>2013</strong>Eff/New/GrowthImpact fromCapital<strong>2013</strong>Requested<strong>Budget</strong><strong>2013</strong><strong>Budget</strong>Change $Community and Social Services41 Recreation Programs and FacilitiesRevenueUser Fees and Service Charges ($3,428,482) (3,477,275) $0 ($3,477,275) ($48,793) 1.4%Product Sales (19,600) (19,600) 0 (19,600) 0 0.0%External Recoveries (111,900) (112,250) 0 (112,250) (350) 0.3%Grants (32,000) (42,700) 0 (42,700) (10,700) 33.4%Total Revenue (3,591,982) (3,651,825) 0 (3,651,825) (59,843) 1.7%ExpenditureSalary, Wage and Benefits 3,482,220 3,621,975 0 3,621,975 139,755 4.0%Purchased Goods 1,239,200 1,230,400 0 1,230,400 (8,800) (0.7%)Purchased Services 385,670 389,460 0 389,460 3,790 1.0%Financial Expenses 0 0 0 0 0 0Total Expenditure 5,107,090 5,241,835 0 5,241,835 134,745 2.6%Net Before Internal Charges and Recoveries 1,515,108 1,590,010 0 1,590,010 74,902 4.9%Internal Charges and RecoveriesInternal Charges 371,700 381,300 0 381,300 9,600 2.6%Internal Recoveries (161,800) (153,100) 0 (153,100) 8,700 (5.4%)Total Internal Charges and Recoveries 209,900 228,200 0 228,200 18,300 8.7%Net <strong>Budget</strong> 1,725,008 1,818,210 0 1,818,210 93,202 5.4%<strong>2013</strong><strong>Budget</strong>Change %<strong>City</strong> <strong>of</strong> <strong>Guelph</strong> – <strong>2013</strong> Tax-supported Operating <strong>Budget</strong>184
Corporate and Human ResourcesThe service area supports all <strong>City</strong> departments in providing outstanding municipal service and value to thecommunity. The <strong>City</strong> Clerk’s Office, Corporate Communications, Human Resources, Information Technologyand Legal and Realty Services provide proactive advisory, information and service functions to ensure accountabilityand transparency, manage corporate risk, ensure legislative compliance and provide services aligned with the<strong>City</strong>’s values <strong>of</strong> integrity, excellence and wellness to enhance employee and community well-being.NOTE: <strong>Guelph</strong>’s Provincial Court Administration also fall under this service area, and is represented in <strong>Guelph</strong>’s Enterprise budget(non tax-supported).Organizational StructureCorporate and Human ResourcesExecutive DirectorMark AmorosiT 519-822-1260 x 2281E mark.amorosi@guelph.caExecutive AssistantMary ConnerT 519-822-1260 x 2235E mary.oconner@guelph.ca<strong>City</strong> Clerk’sO ffi c e<strong>City</strong> ClerkBlair LabelleT 519-822-1260 x 2232E blair.labelle@guelph.caCorporateCommunicationsCorporate ManagerTara SpriggT 519-822-1260 x 2610E tara.sprigg@guelph.caCourtServicesManagerBrad CouttsT 519-822-1260 x 2909E brad.coutts@guelph.caHumanResourcesGeneral ManagerDavid GodwaldtT 519-822-1260 x 2848E david.godwaldt@guelph.caInformationTechnologyGeneral ManagerGilles DupuisT 519-822-1260 x 5644E gilles.dupuis@guelph.caLegal andRealty ServicesGeneral ManagerDonna JaquesT 519-822-1260 x 2288E donna.jaques@guelph.caAdministrationProsecutionsCompensation, Benefits,HRIS and PayrollStaffing and Workforce PlanningLabour Relations/Healthand SafetyOrganizational DevelopmentClient ServicesCorporate ApplicationsNetwork ServicesProject Management andBusiness SystemsLegal ServicesRealty ServicesNote: Total non-union management staff and CUPE local 973 staff includes 70 full-time employees (excludes FTE from CourtServices which are included in the Enterprise budget)<strong>City</strong> <strong>of</strong> <strong>Guelph</strong> – <strong>2013</strong> Tax-supported Operating <strong>Budget</strong>185
Corporate and Human ResourcesFinancial SnapshotCorporate andHuman Resources2012<strong>Budget</strong><strong>2013</strong>RequestedYear/YearIncrease ($)Year/YearIncrease (%)Funding SourcesTax-supported % User Fee % Grants %$8,664,860 $9,453,111 $788,251 9.10% 96.89% 2.55% 0.56%2012 Accomplishments• Completed an Open Government Framework to define a program designed to make it easier for residents,businesses and visitors to access <strong>City</strong> information and participate in decision-making and use technology toencourage and support public innovation and engage the community• Achieved 77% participation in the employee engagement survey; 2% higher than the participation rate <strong>of</strong>Canada’s best employers and will use results to build employee engagement strategy and implementationplan• Developed Corporate Technology Strategic Plan including recommendations for open government,technology governance, service standards and sustainability• Give Waste a New Life: cart roll out; award-winning community education program supported transition tocart-based waste collection system designed to reduce <strong>City</strong>’s operating costs and greenhouse gasemissions<strong>2013</strong> Objectives• Review level <strong>of</strong> service and investigate use <strong>of</strong> alternative voting channels for the 2014 municipal election• Continue implementing the Employee Engagement Strategy and ensure compliance with employmentstandards under the Accessibility for Ontarians with Disabilities Act• Implement Corporate Technology Strategic Plan and recommendations to improve access to <strong>City</strong>information, increase opportunities for citizen engagement and enhance public services using modernbusiness systems<strong>City</strong> <strong>of</strong> <strong>Guelph</strong> – <strong>2013</strong> Tax-supported Operating <strong>Budget</strong>186
Corporate and Human Resources>> <strong>City</strong> Clerk’s OfficeThe department ensures accountability, transparency and engagement by administering legislative processes,maintaining and managing public records and conducting elections.• Advise <strong>City</strong> departments and Council on matters <strong>of</strong> procedure, policy and federal, provincial and municipallegislation• Manage calendar <strong>of</strong> Council and Committee meetings, a forecast calendar and the appointment process foradvisory committees, agencies, boards and commissions• Manage and publish Council and Committee meeting agendas, minutes and a formal record <strong>of</strong> decisions• Preserve the integrity <strong>of</strong> the local legislative process by promoting opportunities for the public toparticipate in Council and Committee meetings pursuant to the Planning Act, the Municipal Act, theDevelopment Charges Act and the Heritage Act• Process marriage license applications, perform marriage ceremonies, process burial permits, deathcertificates and register deaths under the Vital Statistics Act• Execute <strong>City</strong> By-laws and agreements and prepare documents pursuant to the Commissioner for TakingAffidavits Act• Coordinate and respond to all requests received under the Municipal Freedom <strong>of</strong> Information andProtection <strong>of</strong> Privacy Act and provides corporate support regarding access and privacy issues• Provide efficient and effective operation <strong>of</strong> the corporate print room by managing requisitions andchargebacks• Act as the Returning Office to manage local elections for <strong>of</strong>fices on <strong>City</strong> Council and local school boardsFinancial Snapshot2012<strong>Budget</strong><strong>2013</strong>RequestedYear/YearIncrease ($)Year/YearIncrease (%)Funding SourcesTax-supported % User Fee % Grants %Clerk Services $700,239 $711,340 $11,101 1.6% 83.3% 16.7%<strong>City</strong> <strong>of</strong> <strong>Guelph</strong> – <strong>2013</strong> Tax-supported Operating <strong>Budget</strong>187
Corporate and Human Resources2012 Accomplishments• Developed a rolling calendar for all Committees <strong>of</strong> Council to increase accountability and serve as aperformance measurement tool• Enhanced procedural and governance-related processes by revising and implementing a new ProceduralBy-law and Closed Meeting Protocol• Implemented a corporate meeting forecast calendar to improve management <strong>of</strong> Council business• Reassessed and modified the agenda preview process to use staff resources more efficiently and free upinternal capacity• Consolidated and published a reference tool for accountability and transparency measures to enhanceaccessibility <strong>of</strong> the <strong>City</strong>’s governance processes• Updated the <strong>City</strong>’s Governance Manual to capture changes made to Council procedure and to reflectorganizational changes• Conducted a Council governance survey and reported the summary <strong>of</strong> results to inform continuousimprovement efforts• Completed an Open Government Framework to define a program designed to make it easier for residents,businesses and visitors to access <strong>City</strong> information and participate in decision-making and use technology toencourage and support public innovation and engage the communityKey Performance MeasuresNumber <strong>of</strong> Council / Committee meetings 2007 2008 2009 2010* 20112012ProjectedOpen Council 35 47 36 27 45 36Closed Council 34 30 27 21 23 28Standing Committees 53 61 46 41 51 50Total 122 138 109 89 119 114*A year in which there were approximately three less council cycles due to a municipal election<strong>City</strong> <strong>of</strong> <strong>Guelph</strong> – <strong>2013</strong> Tax-supported Operating <strong>Budget</strong>188
Corporate and Human Resources2012Number <strong>of</strong> by-laws processed 2007 2008 2009 2010 2011 Projected298 258 263 265 190* 185*Reduced number partially due to delegation <strong>of</strong> authority2012Number <strong>of</strong> FOI Applications Processed 2010 2011 Projected40 25 100**Increase attributed to the number <strong>of</strong> privacy awareness education sessions and a greater commitment to ensure that relevant information requests are subject to review bythe Privacy and Access Specialist<strong>2013</strong> Objectives• Improve efficiency <strong>of</strong> meeting management by reviewing current practices• Assess the <strong>City</strong>’s current records management processes to support the development <strong>of</strong> an action plan toimprove and enhance records management systems• Review and update Access and Privacy-related policies, processes and procedures and develop stafforientation and training program• Review level <strong>of</strong> service and investigate use <strong>of</strong> alternative voting channels for the 2014 municipal electionKey Changes• Increased revenues by $9,000 in commissioner fees and marriage services• Increased compensation by $100,000 for the Records and Information Management Specialist position, thatis <strong>of</strong>fset by $100,000 increase in internal recoveries from the Strategic Initiative Reserve• Increased purchased services by $12,000 for catering services• Decreased purchased goods by $2,050 to better reflect actual spending in 2012<strong>City</strong> <strong>of</strong> <strong>Guelph</strong> – <strong>2013</strong> Tax-supported Operating <strong>Budget</strong>189
Corporate and Human Resources$160$140Year/Year Revenue Comparison$120‘000s$100$80$60$40$20$0User fees and service chargesExternal recoveriesInternal recoveries2012 <strong>2013</strong><strong>City</strong> <strong>of</strong> <strong>Guelph</strong> – <strong>2013</strong> Tax-supported Operating <strong>Budget</strong>190
Corporate and Human ResourcesYear/Year Expenditure Comparison$900$800$700$600‘000s$500$400$300$200$100$0Salary, wages and benefitsPurchased goodsPurchased servicesInternal charges2012 <strong>2013</strong><strong>City</strong> <strong>of</strong> <strong>Guelph</strong> – <strong>2013</strong> Tax-supported Operating <strong>Budget</strong>191
Corporate and Human Resources<strong>2013</strong> Operating <strong>Budget</strong>2012<strong>Budget</strong><strong>2013</strong>Base<strong>Budget</strong><strong>2013</strong>Eff/New/GrowthImpact fromCapital<strong>2013</strong>Requested<strong>Budget</strong><strong>2013</strong><strong>Budget</strong>Change $<strong>2013</strong><strong>Budget</strong>Change %Corporate and Human Resources55 Clerk ServicesRevenueUser Fees and Service Charges ($71,600) (79,200) $0 ($79,200) ($7,600) 10.6%Product Sales 0 0 0 0 0 0.0%Licenses and Permits (60,000) (62,000) 0 (62,000) (2,000) 3.3%External Recoveries (1,500) (1,500) 0 (1,500) 0 0.0%Total Revenue (133,100) (142,700) 0 (142,700) (9,600) 7.2%ExpenditureSalary, Wage and Benefits 663,029 794,260 0 794,260 131,231 19.8%Purchased Goods 38,050 36,000 0 36,000 (2,050) (5.4%)Purchased Services 14,010 29,580 0 29,580 15,570 111.1%Financial Expenses 0 0 0 0 0 0.0%Total Expenditure 715,089 859,840 0 859,840 144,751 20.2%Net Before Internal Charges and Recoveries 581,989 717,140 0 717,140 135,151 23.2%Internal Charges and RecoveriesInternal Charges 156,010 134,320 0 134,320 (21,690) (13.9%)Internal Recoveries (37,760) (140,120) 0 (140,120) (102,360) 271.1%Total Internal Charges and Recoveries 118,250 (5,800) 0 (5,800) (124,050) (104.9%)Net <strong>Budget</strong> 700,239 711,340 0 711,340 11,101 1.6%<strong>City</strong> <strong>of</strong> <strong>Guelph</strong> – <strong>2013</strong> Tax-supported Operating <strong>Budget</strong>192
Corporate and Human Resources>> Corporate CommunicationsLeading the <strong>City</strong>’s efforts to strengthen citizen and stakeholder engagement and communications, theCorporate Communications department develops and implements communications and education programspromoting <strong>City</strong> programs and services. The department also ensures accountability, transparency andengagement by providing strategic communications planning, media relations and issues managementleadership, advice and expertise to all <strong>City</strong> departments.• Provide strategic communications planning and issues management advice and expertise to anticipate,identify, evaluate and respond to issues that affect the <strong>City</strong>’s relationships and reputation• Manage media relations policies and provide coaching for <strong>City</strong> spokespeople; proactively use print,broadcast, web and social media channels to inform and engage residents, businesses and visitors• Perform traditional and social media monitoring and analysis as a anecdotal measure <strong>of</strong> community interestand opinion• Plan, develop and implement public education campaigns to promote active participation in <strong>City</strong> programsand to support established priorities• Foster two-way communication and employee engagement within our own organization• Research, develop, pro<strong>of</strong>read, edit, design, layout, produce and distribute corporate publications, advertisingand promotional items• Manage the <strong>City</strong>’s visual identity, logo and brand to preserve and enhance <strong>Guelph</strong>’s reputationFinancial SnapshotCorporateCommunications2012<strong>Budget</strong><strong>2013</strong>RequestedYear/YearIncrease ($)Year/YearIncrease (%)Funding SourcesTax-supported % User Fee % Grants %$549,113 $645,700 $96,587 17.59% 91.19% 8.81%<strong>City</strong> <strong>of</strong> <strong>Guelph</strong> – <strong>2013</strong> Tax-supported Operating <strong>Budget</strong>193
Corporate and Human Resources2012 Accomplishments• An internal communications plan helped the <strong>City</strong> achieve 77% participation in the employee engagementsurvey; 2% higher than the participation rate <strong>of</strong> Canada’s best employers• Give Waste a New Life: cart roll out; award-winning community education program supported transition tocart-based waste collection system designed to reduce <strong>City</strong>’s operating costs and greenhouse gasemissions• Helped the <strong>City</strong> earn a national award for building awareness about water issues during Canada Water Weekusing a proactive media relations and promotional campaign• Implemented scheduled action items <strong>of</strong> the <strong>City</strong> <strong>of</strong> <strong>Guelph</strong> Communications Plan including contributionsto corporate issues management framework, community engagement framework, updated mediarelations policy and social media principles and guidelines• Researched and developed issues management tools to support several <strong>City</strong> departments including HumanResources, Water Services, Solid Waste Resources, <strong>Guelph</strong> Transit, Planning Services, Engineering Services,Parks and Recreation and Legal and Realty Services• Developed several communications plans for departmental initiatives including <strong>Guelph</strong> CommunityWellbeing Initiative, Corporate Technology Strategic Plan, Internal Audits, Public Nuisance By-law,Attendance Management, Outdoor Water Use By-law review and Open Government Framework• Delivered several corporate publications <strong>of</strong>ten involving research, writing, editing, designing, producing anddistribution; We’re making a difference together: a community and financial report, two issues <strong>of</strong> the <strong>Guelph</strong>Community Guide, six issues <strong>of</strong> <strong>City</strong> Holler employee newsletter, the <strong>2013</strong> Conservation Calendar, the<strong>Guelph</strong> Wellington Emergency Medical Services Community Report and the <strong>2013</strong> <strong>City</strong> budget• Continued managing <strong>City</strong> advertising and promotions including legislatively required public notices andweekly <strong>City</strong> News pages (<strong>Guelph</strong> Tribune)<strong>City</strong> <strong>of</strong> <strong>Guelph</strong> – <strong>2013</strong> Tax-supported Operating <strong>Budget</strong>194
Corporate and Human ResourcesKey Performance MeasuresStrategicCommunicationsPlanningMedia relationsAdvertisingWeb andSocial MediaAs the department continues implementing the five-year <strong>City</strong> <strong>of</strong> <strong>Guelph</strong> Communications Plan, staff will continue developing key performancemeasures illustrating the value and impact <strong>of</strong> strategic communications planning using the RACE formula (research, analysis, communication,evaluation). Often these performance measures are tied to a specific project or campaign. For example:• 98% <strong>of</strong> residents were aware <strong>Guelph</strong> was converting to an automated waste cart collection system, and 77% knew when their householdwould receive their carts• Initial media coverage indicates the first day <strong>of</strong> automated waste collection went relatively smoothly—most residents knew how and when touse carts properly, and the <strong>City</strong> experienced only minor operational challenges.The department will also collaborate with several <strong>City</strong> departments to determine appropriate performance indicators associated with thecorporate issues management framework and community engagement framework.In 2012, the department delivered 112 news releases, media advisories and information bulletins, and garnered more than 1,069 local newsarticles.In <strong>2013</strong>, the department will evaluate automated media monitoring and analysis systems to measure the tone, (positive/negative) quality andquantity <strong>of</strong> local, regional and national media coverage in print, broadcast and online media outlets.Planned, drafted, designed and placed more than 750 different <strong>City</strong> News ads/public notices.38,000 weekly visits to guelph.ca6,370 followers on Twitter3,000 fans on Facebook45,750 Facebook impressions per monthNOTE: Currently, 90 different administrators contribute content to the <strong>City</strong>’s website with very limited quality control or approval process in place. In <strong>2013</strong>, the CorporateCommunications department will collaborate with the Information Technology department to review and recommend ways to improve consistency, accuracy andaccessibility <strong>of</strong> online content.<strong>City</strong> <strong>of</strong> <strong>Guelph</strong> – <strong>2013</strong> Tax-supported Operating <strong>Budget</strong>195
Corporate and Human ResourcesVisits to guelph.ca3,500,0003,000,0002,500,0002,000,0001,500,0001,000,000500,0000guelph.ca20082009 2010 2011 2012*1,323,832 1,549,100 2,087,203 2,338,666 3,105,571*2012 total estimated visits based on 20% increase Jan-Sep over 2011<strong>City</strong> <strong>of</strong> <strong>Guelph</strong> – <strong>2013</strong> Tax-supported Operating <strong>Budget</strong>196
Corporate and Human ResourcesSocial Media Properties14,00012,00010,0008,0006,0004,0002,000020082009 2010 2011 2012(Jan-Sep)FacebookTwitter0 996 2164 2967 48190 1012 3212 5367 12415<strong>City</strong> <strong>of</strong> <strong>Guelph</strong> – <strong>2013</strong> Tax-supported Operating <strong>Budget</strong>197
Corporate and Human Resources<strong>2013</strong> Objectives• Continue implementing the <strong>City</strong> <strong>of</strong> <strong>Guelph</strong> Communications Plan recommendations including stafftraining with respect to the <strong>City</strong>’s media relations policy and social media principles and guidelines, andimproving internal communications to increase the percentage <strong>of</strong> <strong>City</strong> employees that consider themselveswell-informed about <strong>City</strong> programs, issues and initiatives• Continue implementing corporate issues management framework to improve the <strong>City</strong>’s ability to forecastand respond to potentially contentious issues• Enhance media strategy to take advantage <strong>of</strong> opportunities to share <strong>Guelph</strong>’s stories and successes in local,regional and national outlets, and enhance the <strong>City</strong>’s reputation• Evaluate and recommend cost-effective media monitoring and analysis systems to measure tone, (positive/negative) quality and quantity <strong>of</strong> local, regional and national media coverage in print, broadcast an onlinemedia outlets• Develop and implement a system to assess, prioritize and assign communications work; centralize workplanning to allocate communications resources fairly among all <strong>City</strong> departments and align resources tostrategic priorities• Develop a policy for using third-party graphic design services, and develop a business case to determine apreferred model (in-house/contracted) for graphic design services to preserve <strong>City</strong>’s visual identity andreputation• Collaborate with Community Engagement and Web Services to clarify roles and responsibilities, identify andaddress service gaps and overlaps, increase internal efficiencies and improve support for all <strong>City</strong>departments• Review and recommend ways to improve consistency, accuracy and accessibility <strong>of</strong> online content tostrengthen citizen engagement and communications, and increase accountability and transparencyKey Changes in <strong>2013</strong>• Decrease to advertising revenue <strong>of</strong> $14,000• Increase salaries and benefits with addition <strong>of</strong> an Issues Management and Communications Coordinator• Addition <strong>of</strong> Communications Coordinator; salary and benefits <strong>of</strong>fset by recovery in Water andWastewater Services• Decrease to purchased goods <strong>of</strong> $12,200<strong>City</strong> <strong>of</strong> <strong>Guelph</strong> – <strong>2013</strong> Tax-supported Operating <strong>Budget</strong>198
Corporate and Human Resources$250Year/Year Revenue Comparison$200‘000s$150$100$50$0User fees and service chargesExternal recoveriesInternal recoveries2012 <strong>2013</strong><strong>City</strong> <strong>of</strong> <strong>Guelph</strong> – <strong>2013</strong> Tax-supported Operating <strong>Budget</strong>199
Corporate and Human ResourcesYear/Year Expenditure Comparison$800$700$600‘000s$500$400$300$200$100$0Salary, wages and benefitsPurchased goodsPurchased servicesInternal charges2012 <strong>2013</strong><strong>City</strong> <strong>of</strong> <strong>Guelph</strong> – <strong>2013</strong> Tax-supported Operating <strong>Budget</strong>200
Corporate and Human Resources<strong>2013</strong> Operating <strong>Budget</strong>2012<strong>Budget</strong><strong>2013</strong>Base<strong>Budget</strong><strong>2013</strong>Eff/New/GrowthImpact fromCapital<strong>2013</strong>Requested<strong>Budget</strong><strong>2013</strong><strong>Budget</strong>Change $<strong>2013</strong><strong>Budget</strong>Change %Corporate and Human Resources56 Corporate CommunicationsRevenueUser Fees and Service Charges ($64,000) (50,000) $0 ($50,000) $14,000 (21.9%)External Recoveries (12,420) (12,420) 0 (12,420) 0 0.0%Total Revenue (76,420) (62,420) 0 (62,420) 14,000 (18.3%)ExpenditureSalary, Wage and Benefits 542,270 544,180 155,200 699,380 157,110 29.0%Purchased Goods 25,500 12,200 1,100 13,300 (12,200) (47.8%)Purchased Services 260,263 276,340 58,900 335,240 74,977 28.8%Total Expenditure 828,033 832,720 215,200 1,047,920 219,887 26.6%Net Before Internal Charges and Recoveries 751,613 770,300 215,200 985,500 233,887 31.1%Internal Charges and RecoveriesInternal Charges 100 5,600 5,600 11,200 11,100 11,100.0%Internal Recoveries (202,600) (215,200) (135,800) (351,000) (148,400) 73.2%Total Internal Charges and Recoveries (202,500) (209,600) (130,200) (339,800) (137,300) 67.8%Net <strong>Budget</strong> 549,113 560,700 85,000 645,700 96,587 17.6%<strong>City</strong> <strong>of</strong> <strong>Guelph</strong> – <strong>2013</strong> Tax-supported Operating <strong>Budget</strong>201
Corporate and Human Resources>> Corporate and Human ResourcesHuman Resources AdministrationThe department provides human resource management programs and services aligned with the <strong>City</strong>’s values<strong>of</strong> integrity, excellence and wellness, and consistent with Council and regulatory requirements. Humanresource management programs and services enable the <strong>City</strong> to provide outstanding municipal service andvalue by:• Engaging employees, promoting excellence in human resource management and providing leadership inthe implementation <strong>of</strong> the <strong>City</strong>’s People Practices Strategy• Providing a proactive human resource advisory, information and service function to all <strong>City</strong> departments• Providing information to Council and the organization to support human resource decision-making• Supporting employment-related legislative complianceCompensation, Benefits, Payroll and Human Resource Information Systems (HRIS)• Develop compensation strategies, programs, policies and procedures• Process payroll, manage and administer employee benefit programs• Maintain accurate employee records• Management <strong>of</strong> the HRIS including business decisions, data integrity, compliance and reporting writingLabour Relations, Health and Safety• Develop health and safety policies and manage safety training, audits and accident/incident investigationsto protect the health <strong>of</strong> <strong>City</strong> employees• Administer attendance management policies. This allows us to continue to ensure the health and wellbeing<strong>of</strong> our employees which in return improves our ability to deliver services to the public. Managereturn-to-work and WSIB programs for ill/injured employees• Perform collective bargaining and grievance management performance management, and assist inmaintaining good employee relations• Interpret and administer employee collective agreements and corporate policies<strong>City</strong> <strong>of</strong> <strong>Guelph</strong> – <strong>2013</strong> Tax-supported Operating <strong>Budget</strong>202
Corporate and Human ResourcesOrganizational Development• Develop leadership training and learning programs encouraging employees to learn new skills thatcontribute to the success <strong>of</strong> the organization• Develop and implement <strong>Guelph</strong>’s Employee Engagement process to increase the number <strong>of</strong> employeeswho say positive things about the organization, plan to stay employed with the <strong>City</strong>, and strive to do theirbest in serving the community. High engagement is correlated with better health and safety, improvedattendance and higher levels <strong>of</strong> customer service• Offer team facilitation and leader and employee coaching• Develop and implement employee recognition program to increase employee engagement, satisfactionand retention• Manage employee Performance Development Planning process to assist with aligning employee goals withorganizational objectives/strategic initiatives and to outline development plans to support employee skilldevelopment to deliver on their goals• Design and deliver wellness programs to increase health and work-life balance for <strong>City</strong> employees• Investigate harassment and discrimination complaints to ensure a healthy work environment for <strong>City</strong>employeesStaffing and Workforce Planning• Create staffing strategies to support operational needs• Manage workforce planning programs to address labour market skills shortages• Promote the <strong>City</strong> as a top employer• Develop diversity and inclusion programs• Administer employee orientation; career planning and tuition assistance• Analyze and report human resources trends benchmarks and other measurementsFinancial Snapshot2012<strong>Budget</strong><strong>2013</strong>RequestedYear/YearIncrease ($)Year/YearIncrease (%)HR Administration $2,231,113 $2,303,313 $72,200 3.2% 100.0%Funding SourcesTax-supported % User Fee % Grants %<strong>City</strong> <strong>of</strong> <strong>Guelph</strong> – <strong>2013</strong> Tax-supported Operating <strong>Budget</strong>203
Corporate and Human ResourcesPerformance MeasureHR expense as a percentage <strong>of</strong> operating expenses(Human Resources Benchmarking Network 2011 = 0.6%)2012 Accomplishments• Improved job evaluation processes for CUPE and implemented a new JE plan for non-union employees• Marketed employee benefits including health, dental and insured coverage• Developed an Attendance Management Program to be implemented in <strong>2013</strong>• Negotiated fair and reasonable compensation packages for Ontario Public Service Employee Union (OPSEU)and Canadian Union <strong>of</strong> Public Employees (CUPE Local 973 and 1946)• Employee Engagement Strategy – completed survey and support organization and began action planning• Leadership Development – aligned existing leadership core competencies with Corporate Strategic Planand identify learning opportunities to support realigned competencies• Began implementation <strong>of</strong> the Diversity Strategy to support a workforce reflective <strong>of</strong> <strong>Guelph</strong>’s diversecommunity, ensure equity in its employment systems, and improve service to the community• Launched Career Services that make a difference – a program to support employees seeking advice andassistance in building their careers including LEAP; the enhanced licensing, education and accreditationprogramKey Performance Measures2009Actual2010Actual2011Actual2012Estimated<strong>2013</strong>Target0.61% 0.66% 0.69% 0.69% 0.69%Trending slightly upwards. As the <strong>City</strong> strives to be recognized as a top employer there is a greater emphasis and investment in programs such as employee wellness,employee recognition and succession planning.Training cost per full-time employee$694 $476 $536 $536 $536(Conference Board <strong>of</strong> Canada Benchmark 2011 = $688)In 2011, <strong>Guelph</strong>’s investment in employee training recovered some <strong>of</strong> the loss that was experienced in 2010. Despite this the <strong>City</strong> <strong>of</strong> <strong>Guelph</strong> continues to lag the benchmarkas reported by the Conference Board <strong>of</strong> Canada. For reasons stated in the HR Annual Report, staff are questioning the usefulness <strong>of</strong> this benchmark going forward and areinstead exploring the concept <strong>of</strong> a “strong learning culture”. It is important to recognize that strong learning cultures enable innovation and enable organizations to attractand retain top talent. Investment in employee learning is also important in the pursuit to be recognized as a top employer.Positions filled internally31% 40% 46% 50% 53%(Human Resources Benchmarking Network 2011 = 57%)Human Resources recommends a workforce census and employment systems review to better understand what the <strong>City</strong> is doing well to promote internal movement, andidentify possible barriers for staff in the hiring process. The workforce census and employment systems review will also support the <strong>City</strong>’s Diversity Strategy.<strong>City</strong> <strong>of</strong> <strong>Guelph</strong> – <strong>2013</strong> Tax-supported Operating <strong>Budget</strong>204
Corporate and Human Resources<strong>2013</strong> Objectives• Non-Union progression pay project (movement through the non-union salary grids tied to performance)• JD Edwards – HRIS upgrade as part <strong>of</strong> Corporate Technology Strategic Plan• Develop one, three, and five-year priority plans for HRIS aligned to the Corporate Technology Strategic Plan• Health and Safety Audit action planning to ensure legislated requirements are in place• Implement an Attendance Management program• Negotiate fair and reasonable compensation packages for <strong>Guelph</strong> Pr<strong>of</strong>essional Firefighter’s Association andAmalgamated Transit Union employees• Review and revise return-to-work policies and procedures to reflect best practices and employmentprecedence• Further implementation <strong>of</strong> the Employee Engagement Initiative – develop departmental action plans andrevise the corporate People Practices Strategy• Enhance the <strong>City</strong>’s Leadership Development Program – implement curriculum designed to increaseleadership competency and employee engagement• Revise Employee Code <strong>of</strong> Conduct Policy• Implement a pilot Succession Planning Program• Conduct a workforce census and employment systems review to better understand what the <strong>City</strong> is doingwell to promote internal movement, and identify possible barriers for staff in the hiring process• Ensure the <strong>City</strong> complies with employment standards under the Accessibility for Ontarians with DisabilitiesActKey changes in <strong>2013</strong>• Decreased purchased goods by $4,000 due to reduction in printing and reproduction• Reallocation <strong>of</strong> $120,000 in purchased services and internal recoveries for the Employee Assistance Program• Reduced internal charges by $6,150 to align the <strong>2013</strong> budget with 2012 actual spending• Increase training expenses by $55,000 due to Civics 101 and Leadership and Development Training; <strong>of</strong>fsetby corresponding interfund recoveries<strong>City</strong> <strong>of</strong> <strong>Guelph</strong> – <strong>2013</strong> Tax-supported Operating <strong>Budget</strong>205
Corporate and Human ResourcesYear/Year Expenditure Comparison$3,000$2,500$2,000‘000s$1,500$1,000$500$0Salary, wages and benefitsPurchased goodsPurchased servicesInternal charges2012 <strong>2013</strong><strong>City</strong> <strong>of</strong> <strong>Guelph</strong> – <strong>2013</strong> Tax-supported Operating <strong>Budget</strong>206
Corporate and Human Resources<strong>2013</strong> operating budget2012<strong>Budget</strong><strong>2013</strong>Base<strong>Budget</strong><strong>2013</strong>Eff/New/GrowthImpact fromCapital<strong>2013</strong>Requested<strong>Budget</strong><strong>2013</strong><strong>Budget</strong>Change $<strong>2013</strong><strong>Budget</strong>Change %Corporate and Human Resources50 HR AdministrationRevenue$0 0 $0 $0 $0 #DIV/0!Total Revenue 0 0 0 0 0 #DIV/0!ExpenditureSalary, Wage and Benefits 2,363,418 2,461,968 0 2,461,968 98,550 4.2%Purchased Goods 80,075 76,075 0 76,075 (4,000) (5.0%)Purchased Services 345,270 223,770 55,000 278,770 (66,500) (19.3%)Financial Expenses 0 0 0 0 0 #DIV/0!Total Expenditure 2,788,763 2,761,813 55,000 2,816,813 28,050 1.0%Net Before Internal Charges and Recoveries 2,788,763 2,761,813 55,000 2,816,813 28,050 1.0%Internal Charges and RecoveriesInternal Charges 7,250 1,100 0 1,100 (6,150) (84.8%)Internal Recoveries (564,900) (459,600) (55,000) (514,600) 50,300 (8.9%)Total Internal Charges and Recoveries (557,650) (458,500) (55,000) (513,500) 44,150 (7.9%)Net <strong>Budget</strong> 2,231,113 2,303,313 0 2,303,313 72,200 3.2%<strong>City</strong> <strong>of</strong> <strong>Guelph</strong> – <strong>2013</strong> Tax-supported Operating <strong>Budget</strong>207
Corporate and Human Resources>> Corporate Human ResourcesCorporate Human Resources administers corporate functions on behalf <strong>of</strong> the <strong>City</strong>, including accommodatedstaffing, labour negotiations and contingency reserves.Financial Snapshot2012<strong>Budget</strong><strong>2013</strong>RequestedYear/YearIncrease ($)Year/YearIncrease (%)Funding SourcesTax-supported % User Fee % Grants %Human Resources $775,390 $697,360 ($78,030) (10.1%) 92.7% 7.3%Key Changes in <strong>2013</strong>• Increase interfund recoveries by $273,950 to <strong>of</strong>fset the expenditures budgeted in accommodated staffingand the employee assistance program• Purchased Services increase <strong>of</strong> $120,000 to reallocate expenditures for the employee assistance programfrom HR administration<strong>City</strong> <strong>of</strong> <strong>Guelph</strong> – <strong>2013</strong> Tax-supported Operating <strong>Budget</strong>208
Corporate and Human ResourcesYear/Year Revenue Comparison$350$300$250‘000s$200$150$100$50$0GrantsInternal recoveries2012 <strong>2013</strong><strong>City</strong> <strong>of</strong> <strong>Guelph</strong> – <strong>2013</strong> Tax-supported Operating <strong>Budget</strong>209
Corporate and Human ResourcesYear/Year Expenditure Comparison$900$800$700$600‘000s$500$400$300$200$100$0Salary, wages and benefitsPurchased servicesInternal charges2012 <strong>2013</strong><strong>City</strong> <strong>of</strong> <strong>Guelph</strong> – <strong>2013</strong> Tax-supported Operating <strong>Budget</strong>210
Corporate and Human Resources<strong>2013</strong> Operating <strong>Budget</strong>2012<strong>Budget</strong><strong>2013</strong>Base<strong>Budget</strong><strong>2013</strong>Eff/New/GrowthImpact fromCapital<strong>2013</strong>Requested<strong>Budget</strong><strong>2013</strong><strong>Budget</strong>Change $<strong>2013</strong><strong>Budget</strong>Change %Corporate and Human Resources51 Human ResourcesRevenueExternal Recoveries $0 0 $0 $0 $0 0.0%Grants (54,700) (54,700) 0 (54,700) 0 0.0%Total Revenue (54,700) (54,700) 0 (54,700) 0 0.0%ExpenditureSalary, Wage and Benefits 745,890 820,710 0 820,710 74,820 10.0%Purchased Goods 0 0 0 0 0 0.0%Purchased Services 76,000 197,100 0 197,100 121,100 159.3%Financial Expenses 0 0 0 0 0 0.0%Total Expenditure 821,890 1,017,810 0 1,017,810 195,920 23.8%Net Before Internal Charges and Recoveries 767,190 963,110 0 963,110 195,920 25.5%Internal Charges and RecoveriesInternal Charges 60,200 60,200 0 60,200 0 0.0%Internal Recoveries (52,000) (325,950) 0 (325,950) (273,950) 526.8%Total Internal Charges and Recoveries 8,200 (265,750) 0 (265,750) (273,950) (3,340.9%)Net <strong>Budget</strong> 775,390 697,360 0 697,360 (78,030) (10.1%)<strong>City</strong> <strong>of</strong> <strong>Guelph</strong> – <strong>2013</strong> Tax-supported Operating <strong>Budget</strong>211
Corporate and Human Resources>> Information TechnologyThe Information Technology (IT) department leads several programs and initiatives allowing the <strong>City</strong> to buildan adaptive environment for government innovation. Four divisions within the IT department help tostrengthen how the <strong>City</strong> works – Corporate Applications, Client Services, Network Services and ProjectManagement and Business Systems. Using collaborative work teams the department finds new ways to deliverthe best possible municipal services and move the <strong>City</strong> towards real-time government.Corporate Applications• Provide technical support, maintenance, upgrades and advice to minimize down time and make the bestuse <strong>of</strong> <strong>Guelph</strong>’s business-specific information systems including business and permit management(amanda), geographic information system (GIS), Municipal Property Assessment Corporation portal, trafficengineering s<strong>of</strong>tware (TES), parking and facilities management (CLASS)Client Services• Minimize down time on all <strong>City</strong> desktop computers, printers, mobile devices and telephone systems byproviding technical support, maintenance, upgrades and service through a centralized IT help deskNetwork Services• Maintain, develop enhance and protect <strong>Guelph</strong>’s IT network, server, database, internet and communicationsinfrastructure in all <strong>City</strong> facilities to maximize performance and minimize disruptionsProject Management and Business Systems• Identify the highest quality, most cost-effective and integrated information solutions, while working withthe corporation towards sustainable information stewardship• Develop, maintain, provide content and support for all internal and external web-based tools and mediaincluding the <strong>City</strong>’s websites, social media networks and Infonet; all <strong>of</strong> which strengthen stakeholderengagement and communications• Provide technical support, maintenance, upgrades and advice to minimize disruptions and make the bestuse <strong>of</strong> internal information systems including asset and inventory management (Synergen), payroll (Kronos),financial and human resource management systems (JDEdwards ERP), municipal taxation (Valitech)<strong>City</strong> <strong>of</strong> <strong>Guelph</strong> – <strong>2013</strong> Tax-supported Operating <strong>Budget</strong>212
Corporate and Human ResourcesFinancial Snapshot2012<strong>Budget</strong><strong>2013</strong>RequestedYear/YearIncrease ($)Year/YearIncrease (%)Funding SourcesTax-supported % User Fee % Grants %Information Technology $3,561,925 $4,117,718 $555,793 15.60% 99.81% 0.19%2012 Accomplishments• Updated <strong>Guelph</strong>’s interactive waste collection map to reflect new cart schedule for selected homes in <strong>2013</strong>• Developed Corporate Technology Strategic Plan including recommendations for open government, ITgovernance, IT service standards and IT sustainability, and easier, quicker access to <strong>City</strong> information, moreopportunities for citizen engagement and modern business systems• Completed a system design and business case to support wireless connectivity including capital budgetsubmission to implement the design over four years.• Continued improvements to Computer Aided Dispatch (CAD) system for Emergency Services• Wireless network access provided at all Emergency Medical Services stations• Developed the <strong>City</strong>’s Mobile Device Usage policy• Improved performance <strong>of</strong> corporate email system by upgrading to current Micros<strong>of</strong>t version• Implemented a decision-making governance model to prioritize and allocate staff time and resources to ITprojects and initiatives aligned to strategic objectives• Developed two mobile apps using mobile websites, integrated QR codes and social media; improvedservice to Sleeman Centre guests; promoted land sales in Hanlon Creek Business ParkKey Performance MeasuresInformation technology cost per municipal employee supported with an active IT accountOperating and capital costs for information and technology services per staff member2010 2011 2012 <strong>2013</strong>IT cost per municipal staff member – <strong>City</strong> <strong>of</strong> <strong>Guelph</strong> $3,378 $3,549 $3,3735 $3,732IT cost per municipal staff member – OMBI $4,028 $4,994 N/A N/A<strong>City</strong> <strong>of</strong> <strong>Guelph</strong> – <strong>2013</strong> Tax-supported Operating <strong>Budget</strong>213
Corporate and Human ResourcesPercentage <strong>of</strong> investment in information and technology servicesDepartmental operating and capital costs as a percentage <strong>of</strong> municipal operating and capital expenditures2010 2011 2012 <strong>2013</strong>IT budget/<strong>City</strong> budget – <strong>City</strong> <strong>of</strong> <strong>Guelph</strong> 1.15% 1.56% 1.68% 1.78%IT budget/<strong>City</strong> budget – OMBI 1.0% 1.6% N/A N/ANumber <strong>of</strong> visits to municipal websites<strong>City</strong> <strong>of</strong> <strong>Guelph</strong> 2010 2011 2012 <strong>2013</strong>Hits per capita – <strong>City</strong> <strong>of</strong> <strong>Guelph</strong> 16.97 18.59 24.51 28.77Hits per capita – OMBI 16.9 16.7 N/A N/AThe comparative measures provided above are taken from the Ontario Municipal Benchmarking Initiative(OMBI) 2011 annual report.Statistics are the most recent available and compare <strong>Guelph</strong> with the following single-tier municipalities:Barrie, Calgary, Hamilton, London, Ottawa, Sudbury, Thunder Bay, Toronto, Windsor, and Medicine Hat. <strong>City</strong> <strong>of</strong><strong>Guelph</strong> statistics for 2012 are a combination <strong>of</strong> year-to-date actual and predicted, while <strong>2013</strong> are predictednumbers based on preliminary <strong>City</strong> budget submissions.Overall, <strong>City</strong> <strong>of</strong> <strong>Guelph</strong> trends are in line with the Ontario Municipal Benchmarking Initiative (OMBI) trends,considering not all comparator municipalities have the same organizational structure or IT services. Costallocation recoveries for internal services such as Finance, Human Resources and Facilities Maintenance are notreflected in the <strong>City</strong> <strong>of</strong> <strong>Guelph</strong> numbers since services are not budgeted in that fashion; instead, they arereflected in the OMBI numbers.<strong>City</strong> <strong>of</strong> <strong>Guelph</strong> – <strong>2013</strong> Tax-supported Operating <strong>Budget</strong>214
Corporate and Human Resources<strong>2013</strong> Objectives• Implement Corporate Technology Strategic Plan and recommendations to provide easier access to <strong>City</strong>information, more opportunities for citizen engagement and modern business systems• Develop and implement a three-year Geographic Information System (GIS) technology plan• Implement joint wireless design and mobile strategy• Implement corporate IT governance processes (including project selection, ranking, reporting andmonitoring) and resource management within the IT departmentKey Changes in <strong>2013</strong>• Increase computing services recovery <strong>of</strong> $122,900 due to the 20 additional laptops purchased in 2011 forland ambulance• Increase purchased services by $100,793 due to increased network bandwidth and s<strong>of</strong>tware maintenanceto allow staff to perform duties efficiently• Decrease internal charges by $31,700 due to reduction in transfer to reserves• Increase in salaries and benefits due to two Corporate Applications Analysts and two Business Analysts<strong>City</strong> <strong>of</strong> <strong>Guelph</strong> – <strong>2013</strong> Tax-supported Operating <strong>Budget</strong>215
Corporate and Human ResourcesYear/Year Revenue Comparison$1,600$1,400$1,200‘000s$1,000$800$600$400$200$0External recoveriesInternal recoveries2012 <strong>2013</strong><strong>City</strong> <strong>of</strong> <strong>Guelph</strong> – <strong>2013</strong> Tax-supported Operating <strong>Budget</strong>216
Corporate and Human ResourcesYear/Year Expenditure Comparison$4,000$3,500$3,000‘000s$2,500$2,000$1,500$1,000$500$0Salary, wages and benefitsPurchased goodsPurchased servicesInternal charges2012 <strong>2013</strong><strong>City</strong> <strong>of</strong> <strong>Guelph</strong> – <strong>2013</strong> Tax-supported Operating <strong>Budget</strong>217
Corporate and Human Resources<strong>2013</strong> operating budget2012<strong>Budget</strong><strong>2013</strong>Base<strong>Budget</strong><strong>2013</strong>Eff/New/GrowthImpact fromCapital<strong>2013</strong>Requested<strong>Budget</strong><strong>2013</strong><strong>Budget</strong>Change $<strong>2013</strong><strong>Budget</strong>Change %Corporate and Human Resources54 Information TechnologyRevenueExternal Recoveries ($8,000) (8,000) $0 ($8,000) $0 0.0%Total Revenue (8,000) (8,000) 0 (8,000) 0 0.0%ExpenditureSalary, Wage and Benefits 2,930,088 3,076,988 464,200 3,541,188 611,100 20.9%Purchased Goods 53,900 53,900 200 54,100 200 0.4%Purchased Services 1,621,837 1,714,630 8,000 1,722,630 100,793 6.2%Financial Expenses 0 0 0 0 0 #DIV/0!Total Expenditure 4,605,825 4,845,518 472,400 5,317,918 712,093 15.5%Net Before Internal Charges and Recoveries 4,597,825 4,837,518 472,400 5,309,918 712,093 15.5%Internal Charges and RecoveriesInternal Charges 192,200 144,500 16,000 160,500 (31,700) (16.5%)Internal Recoveries (1,228,100) (1,218,400) (134,300) (1,352,700) (124,600) 10.1%Total Internal Charges and Recoveries (1,035,900) (1,073,900) (118,300) (1,192,200) (156,300) 15.1%Net <strong>Budget</strong> 3,561,925 3,763,618 354,100 4,117,718 555,793 15.6%<strong>City</strong> <strong>of</strong> <strong>Guelph</strong> – <strong>2013</strong> Tax-supported Operating <strong>Budget</strong>218
Corporate and Human Resources>> Legal and Realty ServicesThe department <strong>of</strong>fers legal counsel to <strong>City</strong> Council and <strong>City</strong> departments to ensure accountability andtransparency while protecting the <strong>City</strong>’s interests and managing corporate risk.Legal Services• Provide timely, cost-effective and qualified legal advice and opinions to Council, Committees and <strong>City</strong>departments• Represent the <strong>City</strong> before the courts, the Ontario Municipal Board and other administrative tribunals• Manage external counsel• Review and prepares contracts, by-laws and other legal documentation including real estate transactionsRealty Services• Provide site search and selection services for departments seeking additional facilities• Negotiate realty agreements• Administer the <strong>City</strong>’s Land Encroachment By-law• Maintain inventory <strong>of</strong> all realty interests <strong>of</strong> the <strong>City</strong>Financial Snapshot2012<strong>Budget</strong><strong>2013</strong>RequestedYear/YearIncrease ($)Year/YearIncrease (%)Funding SourcesTax-supported % User Fee % Grants %Legal Services $847,080 $977,680 $130,600 15.42% 96.45% 3.55%<strong>City</strong> <strong>of</strong> <strong>Guelph</strong> – <strong>2013</strong> Tax-supported Operating <strong>Budget</strong>219
Corporate and Human Resources2012 Accomplishments• Completed departmental service review and developed plan to implement recommendations to improveefficiency and transparency• Completed mediations in the Urbacon litigation and in a claim against the <strong>City</strong> by local developers• Resolved 18 litigation and tribunal matters including the Wellington Terrace litigation and the Shared RentalHousing Ontario Municipal Board Appeal, reducing anticipated expenditures and risk• Commenced an operational risk management training program for <strong>City</strong> departments in conjunction withthe Privacy Specialist• Drafted standard agreements for use <strong>of</strong> consulting services by <strong>City</strong> departments• Helped develop new by-laws, including the draft Public Nuisance By-law designed to enhance public safety• Contributed to developing <strong>Guelph</strong> Municipal Holdings Inc. (GMHI) and assumed its administration• Began improving governance models for certain local boards to increase transparency and accountability• Managed the sale <strong>of</strong> the former <strong>Guelph</strong> Civic Museum at 6 Dublin Street• Completed land exchanges and easements for residential development in the downtown core• Assisted with the development <strong>of</strong> standard purchase agreements for Hanlon Creek Business Park andrelated land sale policies• Developed strategy and business case for <strong>Guelph</strong>’s Downtown Secondary Plan with respect to acquiringland needed for park lands downtown• Purchased two residential properties to protect and improve municipal water infrastructureKey Performance MeasuresUse <strong>of</strong> External CounselUser2011<strong>Budget</strong>2011Actual2012<strong>Budget</strong>2012Actual<strong>2013</strong>TargetOMB 218,065.73 570,611 250,000Litigation 310,620.92 305,644 200,000Urbacon 300,306.05 295,000 500,000Legal Services seeking opinion<strong>of</strong> external counsel70,000 16,398 70,000 11,117 50,000<strong>City</strong> <strong>of</strong> <strong>Guelph</strong> – <strong>2013</strong> Tax-supported Operating <strong>Budget</strong>220
Corporate and Human ResourcesNumber <strong>of</strong> matters handled by area (does not include litigation handled by the <strong>City</strong>’s insurer)Area <strong>of</strong> Practice 2010 2011 2012<strong>2013</strong>TargetOngoing litigation – outsourced 7 9 6 4Ongoing litigation - in house 4 6 7 5New litigation – outsourced 2 0 0 0New litigation – in house 2 11 11 5Settled litigation matters 0 9 13 5Ongoing Board/Tribunal – outsourced 1 1 3 1Ongoing Board/Tribunal – in house 4 9 26 13New Board/Tribunal – outsourced 0 1 1 0New Board/Tribunal – in house 5 20 16 7Settled Board/Tribunal matters 0 5 10 16By-law review 13 14 18 15Agreement review 47 38 76 80Opinion work 175 174 178 175Legal and Realty Services is working to increase the number <strong>of</strong> matters retained in-house as this approachtends to be more timely and cost effective. Despite handling most files in-house this year, the cost <strong>of</strong> externalcounsel increased due to a number <strong>of</strong> ongoing files requiring substantial work including the WellingtonTerrace and McCrae Medals litigation files, the trial for the Ministry <strong>of</strong> Labour charges, and for the ongoingUrbacon litigation.2011 and 2012 saw a substantial increase in the number <strong>of</strong> Ontario Municipal Board (OMB) matters. Almost allhave been retained in-house.<strong>City</strong> <strong>of</strong> <strong>Guelph</strong> – <strong>2013</strong> Tax-supported Operating <strong>Budget</strong>221
Corporate and Human ResourcesRealty Services RevenueService 20112012<strong>Budget</strong>2012Actual toSeptemberEstimated2012 Final<strong>2013</strong>TargetRegistration <strong>of</strong> agreements $6,787 $23,500 $15,188 $23,500 $23,500Realty Services StatisticsService 2011 2012<strong>2013</strong>EstimateTotal $ value <strong>of</strong> transactions $2,140,000 $1,830,000 UnknownNumber <strong>of</strong> acquisitions (land) 25 40 UnknownNumber <strong>of</strong> dispositions (land) 9 3 UnknownNumber <strong>of</strong> title searches 2,667 1,924 2,000Number <strong>of</strong> registration <strong>of</strong> agreements 80 70 80Revenue from compliance requests and registration fees for agreements decreased in 2012 compared to 2011.This form <strong>of</strong> revenue is relatively inconsistent and tends to trend with development and economic growth.Total Value <strong>of</strong> Transactions includes land acquisitions and dispositions. Significant acquisitions includeElizabeth Street Stormwater Management Pond Site ($335,000), lands for expansion <strong>of</strong> Burke Well ($400,000)and lands for expansion <strong>of</strong> Emma Well ($244,900). Significant land sales in 2012 include the sale <strong>of</strong> the formerMuseum at 6 Dublin St. (closing November 30). Search and registration volumes are expected to increase in<strong>2013</strong> over 2012.<strong>2013</strong> Objectives• Review and revise procurement documents and contracts to decrease the <strong>City</strong>’s risk in the procurementprocess• Implement service review recommendations including creating a policy for use <strong>of</strong> legal services, includingexternal counsel and to more accurately track key performance measures• Assist with development <strong>of</strong> new <strong>Guelph</strong> Municipal Holdings Incorporated (GMHI) initiatives to achieve itsmandate to manage <strong>City</strong> assets better• Complete Ontario Municipal Board appeals <strong>of</strong> the Downtown Secondary Plan and the Official Plan (OPA 42)allowing the <strong>City</strong> to implement development that ensures a well-designed, appealing and sustainable city<strong>City</strong> <strong>of</strong> <strong>Guelph</strong> – <strong>2013</strong> Tax-supported Operating <strong>Budget</strong>222
Corporate and Human ResourcesKey changes in <strong>2013</strong>• Decrease purchased goods by $15,300 primarily due to buying fewer printed resources and using webbasedresources• Increase in Legal Consulting Fees by $125,000 due to Growth and to lessen the amount <strong>of</strong> the continuednegative variances• Increase internal recoveries by $24,200 due to the allocation <strong>of</strong> costs according to Ontario MunicipalBenchmarking Initiative (OMBI) methodology• Decreased recoveries <strong>of</strong> consulting fees and land surveys by $12,500 are <strong>of</strong>fset by reduced expenditures inpurchased servicesYear/Year Revenue Comparison$300$250$200‘000s$150$100$50$0User fees and service chargesExternal recoveriesInternal recoveries2012 <strong>2013</strong><strong>City</strong> <strong>of</strong> <strong>Guelph</strong> – <strong>2013</strong> Tax-supported Operating <strong>Budget</strong>223
Corporate and Human ResourcesYear/Year Expenditure Comparison$1,200$1,000$800‘000s$600$400$200$0Salary, wages and benefitsPurchased goodsPurchased servicesInternal charges2012 <strong>2013</strong><strong>City</strong> <strong>of</strong> <strong>Guelph</strong> – <strong>2013</strong> Tax-supported Operating <strong>Budget</strong>224
Corporate and Human Resources<strong>2013</strong> Operating <strong>Budget</strong>2012<strong>Budget</strong><strong>2013</strong>Base<strong>Budget</strong><strong>2013</strong>Eff/New/GrowthImpact fromCapital<strong>2013</strong>Requested<strong>Budget</strong><strong>2013</strong><strong>Budget</strong>Change $<strong>2013</strong><strong>Budget</strong>Change %Corporate and Human Resources52 Legal ServicesRevenueUser Fees and Service Charges ($23,500) (23,500) $0 ($23,500) $0 0.0%Product Sales 0 0 0 0 0 0External Recoveries (25,000) (12,500) 0 (12,500) 12,500 (50.0%)Total Revenue (48,500) (36,000) 0 (36,000) 12,500 (25.8%)ExpenditureSalary, Wage and Benefits 969,180 1,009,080 0 1,009,080 39,900 4.1%Purchased Goods 25,400 10,100 0 10,100 (15,300) (60.2%)Purchased Services 134,900 127,000 125,000 252,000 117,100 86.8%Total Expenditure 1,129,480 1,146,180 125,000 1,271,180 141,700 12.5%Net Before Internal Charges and Recoveries 1,080,980 1,110,180 125,000 1,235,180 154,200 14.3%Internal Charges and RecoveriesInternal Charges 600 1,200 0 1,200 600 100.0%Internal Recoveries (234,500) (258,700) 0 (258,700) (24,200) 10.3%Total Internal Charges and Recoveries (233,900) (257,500) 0 (257,500) (23,600) 10.1%Net <strong>Budget</strong> 847,080 852,680 125,000 977,680 130,600 15.4%<strong>City</strong> <strong>of</strong> <strong>Guelph</strong> – <strong>2013</strong> Tax-supported Operating <strong>Budget</strong>225
finance and Enterprise ServicesThe Community Energy, Downtown Renewal, Economic Development and Finance departments developpolicies and programs designed to attract business investment and contribute to a thriving future for <strong>Guelph</strong>.This service area explores innovative financing models and business development practices to supportaffordable and sustainable growth.Organizational StructureFinance and Enterprise ServicesExecutive Director/Chief Financial OfficerAlbert HorsmanT 519-822-1260 x 5606E albert.horsman@guelph.caExecutiveAssistantCarole Al-HaydariT 519-822-1260 x 2310E carole.al-haydari@guelph.caCommunityEnergyCorporate ManagerRobert KerrT 519-822-1260 x 2079E robert.kerr@guelph.caDowntownRenewalCorporate ManagerIan PanabakerT 519-822-1260 x 2475E ian.panabaker@guelph.caEconomicDevelopmentGeneral ManagerPeter CartwrightT 519-822-1260 x 2820E peter.cartwright@guelph.caFinanceGeneral ManagerKatrina PowerT 519-822-1260 x 2289E katrina.power@guelph.caFinancial PlanningFinancial Reportingand AccountingProcurement andRisk ManagementTaxation and Revenue<strong>City</strong> <strong>of</strong> <strong>Guelph</strong> – <strong>2013</strong> Tax-supported Operating <strong>Budget</strong>226
finance and Enterprise ServicesFinancial Snapshot2012<strong>Budget</strong><strong>2013</strong>RequestedYear/YearIncrease ($)Year/YearIncrease (%)Funding SourcesTax-supported % User Fee % Grants %Finance and Enterprise $4,269,531 $3,867,530 ($402,001) (9.42%) 80.46% 19.02% 0.52%2012 Accomplishments• Received upgraded AA positive credit rating• Created a new governance model for managing <strong>City</strong>-owned assets; <strong>Guelph</strong> Municipal HoldingsIncorporated (GMHI)• Completed the Joint Operational Review for Planning, Building, Engineering and Economic Development• Developed a corporate business planning framework• Developed a Corporate Energy Management Plan<strong>2013</strong> Objectives• Implement recommendations <strong>of</strong> the Joint Operational Review for Planning, Building, Engineering andEconomic Development to strengthen relationships with the development community and improve serviceto the public• Investigate and implement service-based budgeting for 2014 tax-supported budgets to improve decisionmakingby fully determining the cost <strong>of</strong> delivering <strong>City</strong> services• Implement corporate business planning framework• Implement Corporate Energy Management Plan to achieve estimated savings <strong>of</strong> $83,000 in <strong>2013</strong>• Implement the Downtown Secondary Plan, and further encourage and increase private sector investmentthrough the Downtown Community Improvement Plan<strong>City</strong> <strong>of</strong> <strong>Guelph</strong> – <strong>2013</strong> Tax-supported Operating <strong>Budget</strong>227
finance and Enterprise Services>> FinanceThe Finance department ensures accountability and transparency in the organization and helps make <strong>Guelph</strong>an economically viable and resilient city. The department performs financial planning, procurement and riskmanagement, reporting and accounting, and taxation. Finance also provides expert advice and analysis to thecorporation, and supports Council in making decisions to maintain the municipality’s financial integrity incompliance with The Municipal Act, 2006.Financial Planning• Provide long-range financial plans and strategic advice to <strong>City</strong> Council• Support budget preparation and analysis for all <strong>City</strong> departments• Monitor expenses and revenues in compliance with governing policies and legislation• Develop user-fee models and perform rate analysisProcurement and Risk Management• Purchase goods and services using open and transparent processes• Ensure fair competition and compliance with governing policies and legislation• Manage the <strong>City</strong>’s insurance portfolioFinancial Reporting and Accounting• Manage accounts payable and receivable• Prepare detailed cash flow analysis• Report on investments and financing opportunities• Prepare year-end financial statements and <strong>Guelph</strong>’s Financial Information Return (FIR) in accordance withgoverning policies and legislationTaxation• Bill and collect taxes• Review assessment roll and maintain tax collectors roll according to governing policies bylaws andlegislation• Prepare tax policies, review and establish payment options, process methods and set tax rates• Perform tax revenue analysis for <strong>City</strong> departments• Prepare tax certificates and remit education taxes to school boards<strong>City</strong> <strong>of</strong> <strong>Guelph</strong> – <strong>2013</strong> Tax-supported Operating <strong>Budget</strong>228
finance and Enterprise ServicesFinancial Snapshot2012<strong>Budget</strong><strong>2013</strong>RequestedYear/YearIncrease ($)Year/YearIncrease (%)Funding SourcesTax-supported % User Fee % Grants %Finance $2,673,503 $2,163,401 ($510,102) (19.08%) 75.84% 24.16%2012 Accomplishments• Received upgraded AA positive credit rating• Created a new governance model for managing <strong>City</strong>-owned assets: <strong>Guelph</strong> Municipal HoldingsIncorporated (GMHI)• Implemented e-billing and credit card tax payment options• Strengthened the <strong>City</strong>’s financial position by improving the overall rating on 7 <strong>of</strong> 12 indicators over 2010(Making a Difference Report)• Reviewed financial services and issued a request for proposals (RFP) for contracting banking services toensure the <strong>City</strong>’s banking costs are competitive.• Incorporated service-based multi-year operating budgets for enterprise areas providing more accurateforecasting• Created Compensation Reserve Policy to make use <strong>of</strong> reserves more consistent, and strengthen <strong>City</strong>’sreserve status• External audit report showed a reduced number <strong>of</strong> areas for improvement from 7 items in 2011 to 2 in 2012• Revised Investment Policy to maximize investment returns and protect <strong>City</strong> assets<strong>City</strong> <strong>of</strong> <strong>Guelph</strong> – <strong>2013</strong> Tax-supported Operating <strong>Budget</strong>229
finance and Enterprise ServicesKey Performance MeasuresMeasure 2009 2010 20112012Projected(1) Direct debt to own source operating revenue (
finance and Enterprise ServicesKey Changes in <strong>2013</strong>• Allocating finance support costs according to Ontario Municipal Benchmarking Initiative (OMBI)methodology shows an increase <strong>of</strong> $12,700 in internal recoveries• A $451,460 increase in property information certificates is <strong>of</strong>fset by a $73,00 decrease in tax certificatesresulting in an overall $378,460 increase to user fees and services charges• An increase to external recoveries <strong>of</strong> $110,000 due to new administration fees for developer and subdivisionagreements and expected efficiencies resulting from an additional accounting clerk to be implementedin <strong>2013</strong>• Decrease financial expenses by $20,800 due to a reduction in bank charges<strong>City</strong> <strong>of</strong> <strong>Guelph</strong> – <strong>2013</strong> Tax-supported Operating <strong>Budget</strong>231
finance and Enterprise Services$700,000Year/Year Revenue Comparison$600,000$500,000$400,000$300,000$200,000$100,000$0User fees and service chargesExternal recoveriesInternal recoveries2012 <strong>2013</strong><strong>City</strong> <strong>of</strong> <strong>Guelph</strong> – <strong>2013</strong> Tax-supported Operating <strong>Budget</strong>232
finance and Enterprise ServicesYear/Year Expenditure Comparison$3,500,000$3,000,000$2,500,000$2,000,000$1,500,000$1,000,000$500,000$0Salary, wages and benefitsPurchased goodsPurchased servicesFinancial expensesInternal charges2012 <strong>2013</strong><strong>City</strong> <strong>of</strong> <strong>Guelph</strong> – <strong>2013</strong> Tax-supported Operating <strong>Budget</strong>233
finance and Enterprise Services<strong>2013</strong> Operating <strong>Budget</strong>2012<strong>Budget</strong><strong>2013</strong>Base<strong>Budget</strong><strong>2013</strong>Eff/New/GrowthImpact fromCapital<strong>2013</strong>Requested<strong>Budget</strong><strong>2013</strong><strong>Budget</strong>Change $<strong>2013</strong><strong>Budget</strong>Change %Finance and Enterprise90 FinanceRevenueUser Fees and Service Charges ($192,740) (571,200) $0 ($571,200) ($378,460) 196.4%Product Sales 0 0 0 0 0 0.0%Licenses and Permits 0 0 0 0 0 0.0%External Recoveries (7,828) (42,828) (75,000) (117,828) (110,000) 1,405.2%Total Revenue (200,568) (614,028) (75,000) (689,028) (488,460) 243.5%ExpenditureSalary, Wage and Benefits 3,312,025 3,247,955 58,700 3,306,655 (5,370) (0.2%)Purchased Goods 42,865 56,970 0 56,970 14,105 32.9%Purchased Services 72,481 75,304 0 75,304 2,823 3.9%Financial Expenses 20,800 0 0 0 (20,800) (100.0%)Total Expenditure 3,448,171 3,380,229 58,700 3,438,929 (9,242) (0.3%)Net Before Internal Charges and Recoveries 3,247,603 2,766,201 (16,300) 2,749,901 (497,702) (15.3%)Internal Charges and RecoveriesInternal Charges 1,700 2,000 0 2,000 300 17.6%Internal Recoveries (575,800) (588,500) 0 (588,500) (12,700) 2.2%Total Internal Charges and Recoveries (574,100) (586,500) 0 (586,500) (12,400) 2.2%Net <strong>Budget</strong> 2,673,503 2,179,701 (16,300) 2,163,401 (510,102) (19.1%)<strong>City</strong> <strong>of</strong> <strong>Guelph</strong> – <strong>2013</strong> Tax-supported Operating <strong>Budget</strong>234
finance and Enterprise Services>> Community EnergyWhen it comes to energy, <strong>Guelph</strong> develops collaborative work teams and applies whole systems thinking todeliver creative solutions. In collaboration with the <strong>City</strong>’s community partners, the Community Energydepartment leads the implementation <strong>of</strong> <strong>Guelph</strong>’s Community Energy Initiative to use less energy in 25 yearsthan we do today; consume less energy per capita than comparable Canadian cities; and produce lessgreenhouse gas per capita than the current global average.Given the <strong>City</strong>’s own water, electricity and heating bills add up to approximately $8 million dollars each year,the Community Energy department is also developing and implementing a Corporate Energy ManagementPlan to reduce financial risk and better manage the <strong>City</strong>’s operating costs as energy prices continue toincrease.• Oversee the Mayor’s Task Force on Community Energy and its four subcommittees• Collaborate with Planning Services to integrate <strong>Guelph</strong>’s energy goals into the <strong>City</strong>’s Official Plan, secondaryplans and other planning policies and processes• Collaborate with Economic Development in attracting renewable energy businesses and jobs to <strong>Guelph</strong>,and contribute to reaching the goals <strong>of</strong> Prosperity 2020: the Economic Development and Tourism Strategyfor <strong>Guelph</strong>• Build the <strong>City</strong>’s reputation as a leader in community energy during regional, national and internationalevents• Advocate for improved community energy policies, legislation, regulations and resources at provincial andfederal levels <strong>of</strong> government• Develop local policies, design programs and implement energy management projects, and support all <strong>City</strong>departments in measuring and managing energy use• Gain financial support for energy projects in the community through grant applications and proposals• Set out action plans to meet <strong>Guelph</strong>’s energy goals and continue pursuing projects like the cogenerationsystem at the WECC and solar photovoltaic systems on <strong>City</strong>-owned propertyFinancial Snapshot2012<strong>Budget</strong><strong>2013</strong>RequestedYear/YearIncrease ($)Year/YearIncrease (%)Community Energy $334,802 $549,600 $214,798 64.16% 100.00%Funding SourcesTax-supported % User Fee % Grants %<strong>City</strong> <strong>of</strong> <strong>Guelph</strong> – <strong>2013</strong> Tax-supported Operating <strong>Budget</strong>235
finance and Enterprise Services2012 Accomplishments• Increased partnerships and local investments through the Mayor’s Task Force on Community Energy and itsfour subcommittees i.e. Canadian Solar Solutions $30 million operation and bringing 500 jobs to <strong>Guelph</strong>• Increased the number <strong>of</strong> renewable energy jobs, investors and service providers in <strong>Guelph</strong> and, incollaboration with Innovation <strong>Guelph</strong>, established the city’s Solar Cluster a program that could bring up to1,000 jobs in solar components and services• Contributed to cooperative funding proposals for community-based activities supporting the CommunityEnergy Initiative• Initiated the long-term development <strong>of</strong> a thermal energy distribution network to bring reliable andeconomical heating to residents and businesses• Developed a corporate energy plan including goals, objectives, initiatives, and key performance indicators• Completed energy audits at 13 <strong>City</strong> facilities, and identified $3.3 million in energy conservation projects thatwill result in annual savings <strong>of</strong> over $400,000 per year• Developed a Corporate Energy Strategic Business Plan• Applied to the Ontario Power Authority (OPA) to sell solar power generated on <strong>City</strong>-owned property; oncethe projects are approved and built they could generate as much as $100,000 per year over 20 years for the<strong>City</strong>• Implemented no/low cost energy conservation measures in several facilities including energy-efficientlighting systems and high-efficiency boilers• Completed inventory <strong>of</strong> the <strong>City</strong>’s energy-consuming equipment (excluding fleet) and helped departmentsdevelop operating budgets more reflective <strong>of</strong> actual utility expenditure• Improved accuracy and analytical capabilities <strong>of</strong> energy accounting systems and processes<strong>City</strong> <strong>of</strong> <strong>Guelph</strong> – <strong>2013</strong> Tax-supported Operating <strong>Budget</strong>236
finance and Enterprise ServicesKey Performance MeasuresPerformance Measure Target/Benchmark Actual 2011 Estimated 2012 Projected <strong>2013</strong>Community per capita energyreductionCorporate utility expenditure2031 target 50% reduction 2.6% increase percapita consumptionAnnual reduction in consumption(electricity and gas)1% increase percapita consumption0% increase percapita consumptionData not available Data not available 2.2% reduction<strong>City</strong> capacity to manage energyconsumptionImprove score each year: maxscore 244.7 8.2 11Source: <strong>Guelph</strong> Hydro The <strong>City</strong> <strong>of</strong> <strong>Guelph</strong> Energy Usage and Greenhouse Gas Emissions 2010, March 2012Corporate Energy Management Program ScorecardEnergy ManagementScores2010 20110.7 1.3Targets2012 <strong>2013</strong>2.2 2.8Awareness and informationScores2010 20110.3 1.2Targets2012 <strong>2013</strong>1.8 2.5Financial ManagementScores2010 20111.2 1.3Targets2012 <strong>2013</strong>2.8 3.7Scores2010 20110.7 0.8TechnicalTargets2012 <strong>2013</strong>1.3 2.0Capacity scores for energy management determined using the UK Department <strong>of</strong> Environment guide: GPG306. The dashboard below shows corporate energy program scores for 2010, 2011 with goals for 2012 and<strong>2013</strong>. The dashboard shows the <strong>City</strong>’s progress towards energy best practices while highlighting areasrequiring improvement.<strong>City</strong> <strong>of</strong> <strong>Guelph</strong> – <strong>2013</strong> Tax-supported Operating <strong>Budget</strong>237
finance and Enterprise Services<strong>2013</strong> Objectives• Invest $1.25 million in energy-efficiency projects as part <strong>of</strong> the Corporate Energy Management Program toachieve estimated savings <strong>of</strong> $128,000 in <strong>2013</strong> and $212,000 per year thereafter• Integrate energy data monitoring and tracking system and report results <strong>of</strong> the Corporate EnergyManagement Plan• Continue increasing in local renewable energy investment, jobs, projects and activities supporting the goals<strong>of</strong> the Community Energy Initiative• Continue progress toward <strong>Guelph</strong>’s per capita energy consumption and greenhouse gas emission targets• Pursue large-scale solar development at closed Eastview landfill through Ontario Power Authority approvalprocess• Continue to pursue development <strong>of</strong> thermal energy networks• Zero variance in the <strong>City</strong>’s electricity and natural gas budgets showing improved ability to forecast andmanage energy costs• Increase revenue by leasing space for solar projects, and successful grant applications and proposalsKey Changes in <strong>2013</strong>• Reduce internal recoveries by $14,000 due to less than expected amount <strong>of</strong> time dedicated to water andwastewater projects.• Increase pr<strong>of</strong>essional consulting fees by $191,500 primarily due to the Continuous Facility Commissioning,Facility Optimization Coordinator and additional facility energy auditing<strong>City</strong> <strong>of</strong> <strong>Guelph</strong> – <strong>2013</strong> Tax-supported Operating <strong>Budget</strong>238
finance and Enterprise ServicesYear/Year Revenue Comparison$50,000$40,000$30,000$20,000$10,000$0Internal recoveries2012 <strong>2013</strong><strong>City</strong> <strong>of</strong> <strong>Guelph</strong> – <strong>2013</strong> Tax-supported Operating <strong>Budget</strong>239
finance and Enterprise ServicesYear/Year Expenditure Comparison$350,000$300,000$250,000$200,000$150,000$100,000$50,000$0Salary, wages and benefitsPurchased goodsPurchased servicesInternal charges2012 <strong>2013</strong><strong>City</strong> <strong>of</strong> <strong>Guelph</strong> – <strong>2013</strong> Tax-supported Operating <strong>Budget</strong>240
finance and Enterprise Services<strong>2013</strong> Operating <strong>Budget</strong>2012<strong>Budget</strong><strong>2013</strong>Base<strong>Budget</strong><strong>2013</strong>Eff/New/GrowthImpact fromCapital<strong>2013</strong>Requested<strong>Budget</strong><strong>2013</strong><strong>Budget</strong>Change $<strong>2013</strong><strong>Budget</strong>Change %Finance and Enterprise92 Community EnergyRevenueExternal Recoveries $0 0 $0 $0 $0 0.0%Grants 0 0 0 0 0 0.0%Total Revenue 0 0 0 0 0 0.0%ExpenditureSalary, Wage and Benefits 243,180 253,300 0 253,300 10,120 4.2%Purchased Goods 2,500 1,000 0 1,000 (1,500) (60.0%)Purchased Services 129,122 116,200 205,000 321,200 192,078 148.8%Total Expenditure 374,802 370,500 205,000 575,500 200,698 53.5%Net Before Internal Charges and Recoveries 374,802 370,500 205,000 575,500 200,698 53.5%Internal Charges and RecoveriesInternal Charges 0 100 0 100 100 (100.0%)Internal Recoveries (40,000) (26,000) 0 (26,000) 14,000 (35.0%)Total Internal Charges and Recoveries (40,000) (25,900) 0 (25,900) 14,100 (35.3%)Net <strong>Budget</strong> 334,802 344,600 205,000 549,600 214,798 64.2%<strong>City</strong> <strong>of</strong> <strong>Guelph</strong> – <strong>2013</strong> Tax-supported Operating <strong>Budget</strong>241
finance and Enterprise Services>> Downtown RenewalThe Downtown Renewal Office was established to implement key objectives <strong>of</strong> Prosperity 20/20: <strong>Guelph</strong>’sEconomic Development and Tourism Strategy; intensifying residential and employment development indowntown <strong>Guelph</strong> is a strategic priority. The department uses tools like the Downtown CommunityImprovement Plan (CIP) to attract new investment to the core, and collaborates with other <strong>City</strong> departmentsand community partners to ensure objectives and actions are aligned with this economic developmentstrategy.• Lead several key corporate strategic initiatives such as developing the Downtown Business Plan andpositioning the <strong>City</strong>-owned Baker Street parking lot for redevelopment• Collaborate with Council-appointed Downtown Advisory Committee (dac) to develop a broad communityunderstanding and buy-in to initiatives; committee connects the <strong>City</strong> to the Downtown <strong>Guelph</strong> BusinessAssociation, <strong>Guelph</strong> Chamber <strong>of</strong> Commerce, Innovation <strong>Guelph</strong>, University <strong>of</strong> <strong>Guelph</strong>• Member <strong>of</strong> Connect <strong>Guelph</strong>: participate in the coordination <strong>of</strong> economic development efforts across thecommunity and in support <strong>of</strong> Prosperity 20/20Financial Snapshot2012<strong>Budget</strong><strong>2013</strong>RequestedYear/YearIncrease ($)Year/YearIncrease (%)Downtown Renewal $475,024 $354,234 ($120,790) (25.4%) 100.0%Funding SourcesTax-supported % User Fee % Grants %<strong>City</strong> <strong>of</strong> <strong>Guelph</strong> – <strong>2013</strong> Tax-supported Operating <strong>Budget</strong>242
finance and Enterprise Services2012 Accomplishments• Supported Planning Services in completing <strong>Guelph</strong>’s Downtown Secondary Plan establishing the <strong>City</strong>’slong-term vision for development• Amended Downtown CIP to include major redevelopment incentive programs to attract larger-scaleinvestment and resulting in major development in the downtown core• Secured Council-approved funding for the Tax Increment-Based Grant program; downtown, brownfield andheritage investment programs stimulate investment and increase property values allowing the <strong>City</strong> tocollect increased tax revenue over the long term• Downtown CIP grants program approved 18 downtown projects valued at a total construction cost <strong>of</strong>$802,315; CIP contribution was $208,056 representing a 1:2.9 leveraging <strong>of</strong> <strong>City</strong> to private dollars• The Downtown CIP brought three Major Downtown Activation Grants to Council: RiverHouse, 148MacDonnell Street, 130 residential units, plus ground floor commercial; Market Commons, 5 Gordon Street,55 residential units, plus ground floor commercial; and the Diplomat Hotel, 72 Macdonell, 22 hotel units plusground floor commercial• Continued purchasing and assembling lands needed to pursue the Baker Street redevelopment project;created interim parking lot for 45 cars on Wyndham Street• Participated in Joint Operational Review for Planning, Building, Engineering and Economic Development;Brownfield Community Improvement Plan Update; <strong>Guelph</strong> Public Library Main Library space and functionalplanKey Performance Measures• Downtown Renewal leads the organization in achieving the goals <strong>of</strong> <strong>Guelph</strong>’s Downtown Secondary Planincluding reaching targets for 8,500 residents and 7,500 jobs by the year 2031, and increased visitation,year-over-year, greater than population growth.• In <strong>2013</strong> the department will develop key performance measures aligned to <strong>Guelph</strong>’s Downtown SecondaryPlan including economic pr<strong>of</strong>iling and success indicators and reporting this in the <strong>2013</strong> Downtown AnnualReport scheduled for February <strong>2013</strong>.<strong>City</strong> <strong>of</strong> <strong>Guelph</strong> – <strong>2013</strong> Tax-supported Operating <strong>Budget</strong>243
finance and Enterprise Services<strong>2013</strong> Objectives• Collaborate with the Downtown Advisory Committee to develop the Downtown Business Plan toimplement the Downtown Secondary Plan• Bring forward the strategic assessment <strong>of</strong> the Baker Street redevelopment project for Council consideration;detailed business case including options for financing and developing the project• Collaborate with Public Works department on the downtown parking study, and work with Planning andEngineering Services to update <strong>Guelph</strong>’s public and private realm manuals• Participate in the development <strong>of</strong> corporate business case tools, downtown energy initiatives, and theDevelopment Charges background studyKey Changes in <strong>2013</strong>• Reduce Downtown <strong>Guelph</strong> CIP funding (from $260,000 in 2012 to $130,000 in <strong>2013</strong>)<strong>City</strong> <strong>of</strong> <strong>Guelph</strong> – <strong>2013</strong> Tax-supported Operating <strong>Budget</strong>244
finance and Enterprise ServicesYear/Year Expenditure Comparison$300,000$250,000$200,000$150,000$100,000$50,000$0Salary, wages and benefitsPurchased goodsPurchased servicesOther transfersInternal charges2012 <strong>2013</strong><strong>City</strong> <strong>of</strong> <strong>Guelph</strong> – <strong>2013</strong> Tax-supported Operating <strong>Budget</strong>245
finance and Enterprise Services<strong>2013</strong> Operating <strong>Budget</strong>2012<strong>Budget</strong><strong>2013</strong>Base<strong>Budget</strong><strong>2013</strong>Eff/New/GrowthImpact fromCapital<strong>2013</strong>Requested<strong>Budget</strong><strong>2013</strong><strong>Budget</strong>Change $<strong>2013</strong><strong>Budget</strong>Change %Finance and Enterprise91 Downtown RenewalRevenueTotal Revenue $0 0 $0 $0 $0 0.0%ExpenditureSalary, Wage and Benefits 201,510 210,620 0 210,620 9,110 4.5%Purchased Goods 8,700 8,900 0 8,900 200 2.3%Purchased Services 3,814 3,814 0 3,814 0 0.0%Other Transfers 260,000 130,000 0 130,000 (130,000) (50.0%)Total Expenditure 474,024 353,334 0 353,334 (120,690) (25.5%)Net Before Internal Charges and Recoveries 474,024 353,334 0 353,334 (120,690) (25.5%)Internal Charges and RecoveriesInternal Charges 1,000 900 0 900 (100) (10.0%)Total Internal Charges and Recoveries 1,000 900 0 900 (100) (10.0%)Net <strong>Budget</strong> 475,024 354,234 0 354,234 (120,790) (25.4%)<strong>City</strong> <strong>of</strong> <strong>Guelph</strong> – <strong>2013</strong> Tax-supported Operating <strong>Budget</strong>246
finance and Enterprise Services>> Economic DevelopmentThe primary role <strong>of</strong> the Economic Development department is to ensure <strong>Guelph</strong> is economically viable,resilient, diverse and attractive for business. To reach the goals <strong>of</strong> Prosperity 2020: the Economic Developmentand Tourism Strategy for <strong>Guelph</strong>, the department develops and implements programs to retain and expandlocal businesses, and attract new business investment. The department also identifies and implementsstrategic initiatives and partnerships.• Assist local businesses with their efforts to maintain and expand their operations; the health <strong>of</strong> existingbusinesses is as important as attracting new investment• Collaborate with other <strong>City</strong> departments, local business, agencies and organizations to develop programsdesigned to meet the needs <strong>of</strong> <strong>Guelph</strong>’s business community• Promote <strong>Guelph</strong> as an attractive place to set up shop to diversify <strong>Guelph</strong>’s employment base, and increaserevenue from the city’s industrial, commercial and institutional tax base• Identify and implement strategic initiatives designed to make <strong>Guelph</strong> competitive in attracting newinvestment in the regional and provincial marketplace• Plan, develop and market the Hanlon Creek Business Park; negotiating and administrating the sale <strong>of</strong><strong>City</strong>-owned land and cost-sharing agreements• Partner with local, regional, provincial and federal economic development <strong>of</strong>fices to make the best use <strong>of</strong>available funding to provide a greater range <strong>of</strong> services• Lead the <strong>Guelph</strong> Economic Development Advisory Committee in achieving its mandate to stimulatebusiness growth and sustain a strong, resilient and diverse local economyFinancial Snapshot2012<strong>Budget</strong><strong>2013</strong>RequestedYear/YearIncrease ($)Year/YearIncrease (%)Funding SourcesTax-supported % User Fee % Grants %Economic Development $786,202 $800,295 $14,093 1.8% 76.2% 21.5% 2.4%<strong>City</strong> <strong>of</strong> <strong>Guelph</strong> – <strong>2013</strong> Tax-supported Operating <strong>Budget</strong>247
finance and Enterprise Services2012 Accomplishments• Coordinate, facilitate and expedite municipal approvals to assist local businesses seeking to expandoperations including Hitachi’s $32 million plant expansion, adding 575 jobs over the next five years• Facilitated Fusion Homes’ site planning and building permit applications for a new <strong>of</strong>fice in the HanlonCreek Business Park• Participated in the Ontario Food Cluster and the Ontario Clean Tech Alliance to promote <strong>Guelph</strong> inadvanced manufacturing, environmental technology, green-tech and agri-tech sectors, and pursueforeign-directed investment in a cost-effective fashion• Collaborated with local, regional and provincial economic development organizations on eight foreigninvestment missions in Canada, the United States, South America and Europe; generated roughly 120pre-qualified investment leads likely to attract new businesses and create jobs in <strong>Guelph</strong>• Began work on a business case to support a new joint university/college campus to serve the employmentneeds <strong>of</strong> existing businesses, and develop source <strong>of</strong> skilled labour to attract new investment• Completed the Joint Operational Review for Planning, Building, Engineering and Economic Development tostrengthen relationships with the development community and improve service to the public• Completed a corporate business planning framework to serve as the common basis for assessing andcommitting to new corporate initiatives• Coordinated Hanlon Creek Business Park planning and development approval initiatives to attract newbusiness investmentKey Performance MeasuresMeasure2011Actual2012Estimated<strong>2013</strong>ProjectedServiced employment land sales (acres) 15 acres 12 acres 15 acresValue <strong>of</strong> development charges (industrial) $948,000 $1,697,000 $1,736,000Value <strong>of</strong> development charges (commercial) $2,604,000 $1,435,000 $1,468,000Notes: Serviced employment land sales forecast for <strong>2013</strong> is based on current level <strong>of</strong> business/investment inquiries.<strong>2013</strong> development charge forecast is based on the Conference Board <strong>of</strong> Canada’s forecast for Ontario’s <strong>2013</strong> economic growth(2.3%)In <strong>2013</strong>, the department will review best practices for municipal key performance indicators and re-establishhistoric economic benchmark data.<strong>City</strong> <strong>of</strong> <strong>Guelph</strong> – <strong>2013</strong> Tax-supported Operating <strong>Budget</strong>248
finance and Enterprise Services<strong>2013</strong> Objectives• Enhance <strong>Guelph</strong>’s business retention and expansion programs to pro-actively assist local business• Continue participation in Ontario Clean Technology Alliance and Ontario Food Cluster missions to promoteinvestment in <strong>Guelph</strong> and attract businesses in advanced manufacturing, environmental technology,green-tech and agri-tech sectors• Implement corporate business planning framework• Implement recommendations <strong>of</strong> the Joint Operational review for Planning, Building, Engineering andEconomic Development• Develop business case in support <strong>of</strong> a joint university/college campus in partnership with University <strong>of</strong><strong>Guelph</strong> and Conestoga College• Collaborate with provincial government and other key stakeholders on planning and development withrespect to the <strong>Guelph</strong> Innovation District• Sell 15 acres <strong>of</strong> land in the Hanlon Creek Business Park and assist businesses as they establish operations inthe parkKey Changes in <strong>2013</strong>• Decrease advertising revenue by $80,000 due to market conditions and align the <strong>2013</strong> budget to actualrevenue 2012• Decreased external recoveries <strong>of</strong> $20,567 is <strong>of</strong>fset by $76,300 reduction to programming materials inpurchased goods• Increase federal government grants by $25,000<strong>City</strong> <strong>of</strong> <strong>Guelph</strong> – <strong>2013</strong> Tax-supported Operating <strong>Budget</strong>249
finance and Enterprise ServicesYear/Year Revenue Comparison$300,000$250,000$200,000$150,000$100,000$50,000$0User fees and service chargesProduct salesExternal recoveries2012 <strong>2013</strong>Grants<strong>City</strong> <strong>of</strong> <strong>Guelph</strong> – <strong>2013</strong> Tax-supported Operating <strong>Budget</strong>250
finance and Enterprise ServicesYear/Year Expenditure Comparison$800,000$700,000$600,000$500,000$400,000$300,000$200,000$100,000$0Salary, wages and benefitsPurchased goodsPurchased servicesOther transfersInternal charges2012 <strong>2013</strong><strong>City</strong> <strong>of</strong> <strong>Guelph</strong> – <strong>2013</strong> Tax-supported Operating <strong>Budget</strong>251
finance and Enterprise Services<strong>2013</strong> Operating <strong>Budget</strong>2012<strong>Budget</strong><strong>2013</strong>Base<strong>Budget</strong><strong>2013</strong>Eff/New/GrowthImpact fromCapital<strong>2013</strong>Requested<strong>Budget</strong><strong>2013</strong><strong>Budget</strong>Change $<strong>2013</strong><strong>Budget</strong>Change %Finance and Enterprise93 Economic DevelopmentRevenueUser Fees and Service Charges ($80,000) 0 $0 $0 $80,000 (100.0%)Product Sales (2,000) (1,000) 0 (1,000) 1,000 (50.0%)External Recoveries (244,980) (224,413) 0 (224,413) 20,567 (8.4%)Grants 0 (25,000) 0 (25,000) (25,000) 100.0%Total Revenue (326,980) (250,413) 0 (250,413) 76,567 (23.4%)ExpenditureSalary, Wage and Benefits 667,682 699,280 0 699,280 31,598 4.7%Purchased Goods 142,700 66,400 0 66,400 (76,300) (53.5%)Purchased Services 249,300 240,628 0 240,628 (8,672) (3.5%)Other Transfers 48,000 43,000 0 43,000 (5,000) (10.4%)Financial Expenses 0 0 0 0 0 0.0%Total Expenditure 1,107,682 1,049,308 0 1,049,308 (58,374) (5.3%)Net Before Internal Charges and Recoveries 780,702 798,895 0 798,895 18,193 2.3%Internal Charges and RecoveriesInternal Charges 5,500 1,400 0 1,400 (4,100) (74.5%)Internal Recoveries 0 0 0 0 0 0.0%Total Internal Charges and Recoveries 5,500 1,400 0 1,400 (4,100) (74.5%)Net <strong>Budget</strong> 786,202 800,295 0 800,295 14,093 1.8%<strong>City</strong> <strong>of</strong> <strong>Guelph</strong> – <strong>2013</strong> Tax-supported Operating <strong>Budget</strong>252
General Revenues & Expenditures, Capital Financing and <strong>City</strong> Grants>> General RevenuesThe general revenues section <strong>of</strong> the <strong>City</strong>’s operating budget relates to revenues generated outside a specific<strong>City</strong> department including:• supplementary tax revenue generated from new properties and additions or improvements to existingproperties• payments in lieu <strong>of</strong> taxes (PIL’s)• interest revenue generated from the <strong>City</strong>’s investment portfolio• penalty revenue generated from accounts receivablesKey Changes in <strong>2013</strong>• Decrease revenue from supplementary taxes by $1.3 million due to collection <strong>of</strong> supplementary taxes on alarge property in 2012 and overall decline in building permit activity that generates this type <strong>of</strong> revenue• Increase revenue from payments-in-lieu <strong>of</strong> taxes due to property reassessments and investment incomefrom better cash flow monitoring and investment opportunities provided by the approved investmentpolicy2012 <strong>2013</strong>Year/YearChange ($)Year/YearChange (%)General Revenues ($14,935,100) ($14,496,295) $438,805 (2.9%)Details <strong>of</strong> IncreaseSupplementary Levy 1,300,000PIL Revenue (177,900)Interest Income (683,295)Total Impacts $438,805<strong>City</strong> <strong>of</strong> <strong>Guelph</strong> – <strong>2013</strong> Operating <strong>Budget</strong>253
General Revenues & Expenditures, Capital Financing and <strong>City</strong> Grants>> General ExpendituresExpenditures related to the <strong>City</strong> as a whole including but not limited to insurance, audit fees, assessment fees,and tax write-<strong>of</strong>fs and rebates are considered general expenditures. Also included in this section is acontingency account to cover unexpected one-time expenditures.Key Changes in <strong>2013</strong>• Economic increase for union groups without a contract in place at the beginning <strong>of</strong> <strong>2013</strong> in thecontingency account as negotiations are scheduled for <strong>2013</strong>; once agreements are finalized, the budget willbe reallocated from the contingency account to the appropriate business unit(s)• Taxes written <strong>of</strong>f and vacancy rebates have increased by $300,000 or $150,000 each. This reflects the need tobring these budgets in line with historic actuals based on higher vacancies in industrial and commercialproperties and higher anticipated write-<strong>of</strong>fs due to the reassessment• $100,000 in savings from changes to the auto-reimbursement policy to be allocated out to the affecteddepartments once the updated policy is approved by the <strong>City</strong>’s Executive Team• Removal <strong>of</strong> a one-time payment from Courts Services in 2012 to assist with the transition from thetax-supported operating budget to an enterprise fund• Council approved efficiency target <strong>of</strong> $500,000<strong>City</strong> <strong>of</strong> <strong>Guelph</strong> – <strong>2013</strong> Operating <strong>Budget</strong>254
General Revenues & Expenditures, Capital Financing and <strong>City</strong> GrantsThe chart below shows the year-over-year change for general expenditures and provides the details <strong>of</strong> majorbudget changes.2012 <strong>2013</strong>Year/YearChange ($)Year/YearChange (%)General Expenditures $2,518,907 $3,419,063 $900,156 35.7%Details <strong>of</strong> IncreaseEfficiency target -500,000Increase in MPAC Property Assessment Fees 80,000Increased Corporate Contingency allowance 67,650Increase to Taxes Written Off and Vacancy Rebates 300,000Adjust for Savings from the Auto Reimbursement Policy -100,000Allocation for Non-negotiated Economic Impact % and contingency 836,358Removal <strong>of</strong> Revenue from Court Services 122,900Reduced OBC Cost Recoveries 68,600Other Adjustments 24,940Total Impacts 900,156<strong>City</strong> <strong>of</strong> <strong>Guelph</strong> – <strong>2013</strong> Operating <strong>Budget</strong>255
General Revenues & Expenditures, Capital Financing and <strong>City</strong> Grants>> Capital FinancingThis section includes debt servicing costs (principle and interest) associated with Council-approved capitalprojects, and the current year cash contributions to reserves to fund current and future capital projects—determined by the <strong>City</strong>’s guideline stating the amount <strong>of</strong> funding allocated to debt servicing costs and <strong>City</strong>reserves cannot exceed 20 per cent <strong>of</strong> the prior year’s net tax levy.Key Changes in <strong>2013</strong>• Slight increase to the funds transferred to reserve funds; transfer equal to approximately 18% <strong>of</strong> the prioryear’s net tax levy and is within the Council approved 20% financing guideline• Increased debt servicing <strong>of</strong> one interest payment for several <strong>City</strong> projects expected to be completed in late2012, early <strong>2013</strong> including automated waste collection carts, phases 1 and 2 <strong>of</strong> the Baker Streetredevelopment project and downtown public realm reconstruction; principle and additional interestpayment will impact the 2014 budgetThe chart below shows the year-over-year change for capital financing and provides the details <strong>of</strong> majorbudget changes:2012 <strong>2013</strong>Year/YearChange ($)Year/YearChange (%)Capital Financing $26,614,825 $26,977,648 $362,823 1.4%Details <strong>of</strong> IncreaseIncrease to Transfers to <strong>City</strong> Reserve Funds 37,742Increase to Debt Servicing Costs 325,081Total Impacts 362,823<strong>City</strong> <strong>of</strong> <strong>Guelph</strong> – <strong>2013</strong> Operating <strong>Budget</strong>256
General Revenues & Expenditures, Capital Financing and <strong>City</strong> Grants>> Community Grants<strong>Guelph</strong>’s Community Grant program provides financial assistance to various not-for-pr<strong>of</strong>it groups providingprograms and services including:• Health and Social Services• Arts and Culture• Community Events• Community Program Service Fees• Special Projects (not included in part <strong>of</strong> the annual grant process)• MacDonald Stewart Art GalleryThe administration <strong>of</strong> the <strong>City</strong>’s grant program follows the process prescribed by the Council-approvedCommunity Grant Policy.Key Changes in <strong>2013</strong>• Increase MacDonald Stewart Art Gallery operating budget by 3%• Grants for the skateboard facility ($10,000) and tax increment-based grant program ($460,000)• Funding for an innovation fund grant as identified under the Community Investment Strategy ($50,000)• Reduction <strong>of</strong> $400,000 to the grants allocated to <strong>Guelph</strong> General Hospital and Hospice Wellington as 2012represented the last year <strong>of</strong> the <strong>City</strong>’s multi-year funding commitment to these organizations.<strong>City</strong> <strong>of</strong> <strong>Guelph</strong> – <strong>2013</strong> Operating <strong>Budget</strong>257
General Revenues & Expenditures, Capital Financing and <strong>City</strong> GrantsThe chart below shows the year-over-year change for grants and provides the details <strong>of</strong> major budget changes.2012<strong>Budget</strong><strong>2013</strong><strong>Budget</strong>Difference % IncreaseCommunity Grants $225,400 $225,400 $- 0%<strong>Guelph</strong> Arts Council Operating Subsidy 33,000 33,700 700 2%Special Project GrantsUncommitted Funds 14,700 14,700 - 0%<strong>Guelph</strong> Cemetery Commission 2,000 2,000 - 0%Remembrance Day - Legion 3,000 3,000 - 0%Labour Day Picnic 3,000 3,000 - 0%Rotary Club <strong>of</strong> <strong>Guelph</strong> Canada Day Event 32,000 32,000 - 0%Rotary Club <strong>of</strong> <strong>Guelph</strong> Sparkles In the Park Committee 4,000 4,000 - 0%Santa Claus Parade 9,400 9,400 - 0%Heritage Grants 235,000 235,000 - 0%Hospice Wellington Grant 200,000 - -$200,000 -100%<strong>Guelph</strong> General Hospital Grant 200,000 - -$200,000 -100%Volunteer Check Fee Grant 48,000 48,000 - 0%Innovation Fund - 50,000 $50,000 100%Skateboard Facility Grant - 10,000 $10,000 100%Tax Increment Based Grants - 460,000 $460,000 100%Total Special Project Grants $751,100 $871,100 $120,000 823%MacDonald Stewart Art Gallery $173,760 $179,160 $5,400 3%Advertising Cross Charge to Fund Advertisements $- $100 $100 100%Grand Total <strong>City</strong> Grants $1,183,260 $1,309,460 $126,200 11%<strong>City</strong> <strong>of</strong> <strong>Guelph</strong> – <strong>2013</strong> Operating <strong>Budget</strong>258
chapter 5<strong>2013</strong> Local Boards andShared Services <strong>Budget</strong>259
Introduction>> The <strong>City</strong> <strong>of</strong> <strong>Guelph</strong>’s <strong>2013</strong> Proposed Local Boardsand Shared Services Operating <strong>Budget</strong> includes:<strong>Guelph</strong> Public Library BoardPublic HealthSocial Services and Social HousingDowntown <strong>Guelph</strong> Business Association<strong>Guelph</strong> Police Service BoardWith the exception <strong>of</strong> the Downtown <strong>Guelph</strong> Business Association, the <strong>City</strong>’s share <strong>of</strong> these services is fundedthrough the tax levy. These budgets have been extracted from the <strong>City</strong>’s traditional tax-supported operatingbudget as <strong>City</strong> Council has limited or no control over these costs.<strong>City</strong> <strong>of</strong> <strong>Guelph</strong> – <strong>2013</strong> Local Boards and Shared Services <strong>Budget</strong>260
LegislationThe Municipal Act, 2001 requires the municipality to prepare and adopt an annual, balanced budget thatincludes estimates <strong>of</strong> all sums required. The budget sets out the estimated revenues to be raised throughproperty taxes, and the portion to be paid into reserves. Estimated revenues to be raised through property taxesmust be equal to the estimates <strong>of</strong> all sums required for expenditures and transfers to create a balanced budget.However, unlike <strong>City</strong> departments, there is additional legislation governing the local boards and sharedservices budgets as shown in the table below.Legislation governing local boards and shared services budgetsAgency/Board/Commission<strong>Guelph</strong> PublicLibrary BoardPublic HealthGoverningLegislation <strong>Budget</strong> Submission Requirement to the <strong>City</strong> <strong>City</strong> Council Governance Role• Public Libraries arecreated by municipalbylaws• Public Libraries Act• Health Promotion andProtection Act• Operating and capital budget estimates to Council(according to the format and timetable determined byCouncil)• A board <strong>of</strong> health shall give an annual written notice toeach obligated municipality in the health unit served bythe board <strong>of</strong> health that shall specify the amount that theboard <strong>of</strong> health estimates will be required to defray theexpenses incurred for the board <strong>of</strong> health and the medical<strong>of</strong>ficer <strong>of</strong> health, sufficient to perform its functions andduties under the Act and regulations for the year specifiedin the notice• The notice shall specify the amount for which theobligated municipality is responsible, in accordance withproportions agrees upon or where no agreement hasbeen entered into, in accordance with regulations• The notice shall specify the times at which the board <strong>of</strong>health requires payments to be made by the obligatedmunicipality and the amount <strong>of</strong> each payment requiredto be made• Council approves or amends andapproves the Board’s total budget• Council may not direct additions ordeletions to specific items withinthe budget• Obligated municipalities in a healthunit must pay the expenses incurredfor the board <strong>of</strong> health and themedical <strong>of</strong>ficer <strong>of</strong> health, and shallensure that the amount paid issufficient to enable the board <strong>of</strong>health to provide or ensure theprovision <strong>of</strong> health programs andservices in accordance with the Actand regulations<strong>City</strong> <strong>of</strong> <strong>Guelph</strong> – <strong>2013</strong> Local Boards and Shared Services <strong>Budget</strong>261
LegislationAgency/Board/CommissionSocial Servicesand SocialHousingBusinessImprovementAssociation(BIA)<strong>Guelph</strong> PoliceService BoardGoverningLegislation <strong>Budget</strong> Submission Requirement to the <strong>City</strong> <strong>City</strong> Council Governance Role• Ontario Works Act• Housing Services Act• The County <strong>of</strong>Wellington is theConsolidatedMunicipal ServicesManager (CMSM) forSocial Services andSocial Housingthrough the LocalServices Realignment,authorized by theServicesImprovement Act andthe Social AssistanceReform Act• Long Term CareHomes Act• Municipal Act, 2001 S.204 - 215• Police Services Act• Adequacy andEffectiveness <strong>of</strong> PoliceServices Regulation• Income and Employment Services: CMSM determines the<strong>City</strong> budget amount required, based on residence <strong>of</strong>recipient• Child Care: CMSM determines the <strong>City</strong> budget amountrequired, based on residence <strong>of</strong> recipient for fee subsidyand location <strong>of</strong> the Child Care Centre for wage subsidy• Social Housing: CMSM determines the <strong>City</strong> budgetamount required, based on prior residence <strong>of</strong> tenant• Long Term Care: The Ministry <strong>of</strong> Health and Long TermCare requires each municipality to contribute financialsupport to a long-term care facility. The <strong>City</strong> contributesto the operating costs <strong>of</strong> Wellington Terrace, as per theagreement with the County <strong>of</strong> Wellington• Operating budget estimates to Council (according to theformat and timetable determined by Council) that reflectthe priorities and needs <strong>of</strong> the BIA, as determined by theBoard and membership• Operating and capital estimates to Council (according tothe format and timetable determined by Council),showing separately amounts sufficient to maintain anddeliver required police services and provide appropriateequipment, facilities and other supporting infrastructurein accordance with the Act• The <strong>City</strong> <strong>of</strong> <strong>Guelph</strong> must pay theamounts required by the CMSM ondemand, and may be chargedinterest and penalties for nonpayment• Council approves or amends andapproves the Board’s total budget.Council may not add expendituresto a BIA’s budget• Council must establish an overallbudget• Council may not accept or rejectspecific items within the budget• Disputes heard by the OntarioCivilian Commission on PoliceServices<strong>City</strong> <strong>of</strong> <strong>Guelph</strong> – <strong>2013</strong> Local Boards and Shared Services <strong>Budget</strong>262
Financial IMPACTSThere are many reasons for tax rate increases; some are within the <strong>City</strong>’s control and others not.In <strong>Guelph</strong> more than one-third <strong>of</strong> the <strong>City</strong>’s expenditures, $69.3 million, are related to other levels <strong>of</strong>government, autonomous boards, contractual and legislated responsibilities.The chart below shows how municipal dollars are spent on services the municipality can control and thosethat it cannot.Library$8.04%Police$34.118%Municipal$116.063%<strong>2013</strong> Distribution <strong>of</strong> Municipal Dollars ($Ms)$185.2 millionShared Services$23.313%Public Health$2.71%Wellington Terrace$1.11%<strong>City</strong> <strong>of</strong> <strong>Guelph</strong> – <strong>2013</strong> Local Boards and Shared Services <strong>Budget</strong>263
Financial IMPACTSThe chart below shows the five-year trend for local boards and shared services.Net levy impact Local Boards and Shared Services$40,000,000$35,000,000$30,000,000$25,000,000$20,000,000$15,000,000$10,000,000$5,000,00002009 2010 2011 2012 <strong>2013</strong>Police Library Shared Services Wellington Terrace Health Unit<strong>City</strong> <strong>of</strong> <strong>Guelph</strong> – <strong>2013</strong> Local Boards and Shared Services <strong>Budget</strong>264
<strong>Budget</strong> overview by area>> <strong>Guelph</strong> Public Library BoardOperatingThe <strong>2013</strong> operating budget for the <strong>Guelph</strong> Public Library Board is $7,997,725, representing a 2.5 per cent or$197,056 increase over 2012. Changes include:• Increase wages and benefits by $84,505• Increase revenues by$4,500 due to increased revenue from donations and fundraising efforts ($38,000) anda slight increase to service fees and overdue fines ($2,300), <strong>of</strong>fset by the removal <strong>of</strong> one-time grant <strong>of</strong>$45,000 and CAP grant <strong>of</strong> $6,800.• Increase purchased services by $76,551 mainly due to higher rental and lease costs ($47,900) training($18,130) and telephone costs ($11,500)• Transfer $38,000 to reserve funds as a result <strong>of</strong> revenue generation efforts associated with the DevelopmentOfficer position approved in the 2012 budgetCapitalThe <strong>Guelph</strong> Public Library Board will use $1.51 million in capital funding over the 10-year budget and forecast.Key projects include ongoing funding for the radio frequency identification (RFID) inventory control systeminitiated in 2011, as well as system and network upgrades. In the later years <strong>of</strong> the forecast, the board isrequesting funding for an expansion <strong>of</strong> the Bullfrog branch, a library outreach vehicle and other branch upgrades.A complete overview <strong>of</strong> the <strong>Guelph</strong> Public Library Board’s Operating and Capital <strong>Budget</strong> is in Tab 2.>> Wellington Dufferin <strong>Guelph</strong> Public HealthThe Board <strong>of</strong> Health is required to provide an annual written notice to each municipality, specifying theamounts the board estimates will be required to pay for costs incurred by the board and the medical <strong>of</strong>ficer <strong>of</strong>health. This estimate represents the amount required to ensure the board can provide the health programsand services, in accordance with the Health Promotion and Protection Act. The notice shall specify the amountfor which the obligated municipality is responsible in accordance with the proportions agreed upon. If noagreement exists, the proportions will be made in accordance with regulations.In <strong>2013</strong>, the budget for Public Health is $2,737,277, representing a 9.3% or $280,000 decrease from last year.This decrease reflects the <strong>City</strong>’s recommendation to fund <strong>2013</strong> facility construction costs as part <strong>of</strong> debt issuedupon completion <strong>of</strong> the facility.A complete overview <strong>of</strong> the Public Health <strong>Budget</strong> is in Tab 3.<strong>City</strong> <strong>of</strong> <strong>Guelph</strong> – <strong>2013</strong> Local Boards and Shared Services <strong>Budget</strong>265
<strong>Budget</strong> overview by area>> Shared Services and Social HousingThe County <strong>of</strong> Wellington is the Consolidated Municipal Services Manager (CMSM) for Shared Services andSocial Housing through the Local Services Realignment, authorized by the Services Improvement Act and theSocial Assistance Reform Act. Under this authority, the County <strong>of</strong> Wellington is responsible for establishing thebudget for these services, and the <strong>City</strong> is required to make the required payments as required by the CMSM.In 2012, the budget for Shared Services and Social Housing is $23,306,000 representing a 0.30% or $70,300increase over 2012. This estimate is based on the information provided by the County in their three-yearoperating budget.Also included under the Shared Services and Social Housing section <strong>of</strong> the <strong>City</strong>’s budget is $1,166,000 forWellington Terrace. The $1 million increase over 2012 is due to a negotiated settlement reached in 2012.A complete overview <strong>of</strong> Shared Services and Social Housing <strong>Budget</strong>, including Wellington Terrace, is in Tab 4.>> Downtown <strong>Guelph</strong> Business AssociationThe Downtown <strong>Guelph</strong> Business Association is considered a business improvement area (BIA), traditionallyestablished by the municipality using the business improvement area provisions in the Municipal Act, 2001,and under this legislation is considered a local board <strong>of</strong> the municipality. Once a BIA is approved by municipalCouncil, businesses within the defined boundaries become members and pay the BIA levy along with theirproperty taxes. The BIA levies are then disbursed to the board by the municipality. The general functions <strong>of</strong> theBIA are to:• Oversee the improvement, beautification and maintenance <strong>of</strong> municipally-owned land, buildings andstructures in the area beyond what is provided at the expense <strong>of</strong> the municipality• Promote the area as a business or shopping areaIn <strong>2013</strong>, expenditures related to the Downtown <strong>Guelph</strong> Business Association are $480,000, representing a1.48% or $7,000 increase over 2012. This budget has no impact on the tax levy, as the cost is entirely <strong>of</strong>fset byBIA levies collected from members or other revenues raised by the association.A complete overview <strong>of</strong> the Downtown <strong>Guelph</strong> Business Association <strong>Budget</strong> is in Tab 5.<strong>City</strong> <strong>of</strong> <strong>Guelph</strong> – <strong>2013</strong> Local Boards and Shared Services <strong>Budget</strong>266
<strong>Budget</strong> overview by area>> <strong>Guelph</strong> Police Services BoardOperatingThe <strong>2013</strong> operating budget for the <strong>Guelph</strong> Police Service Board is $34,126,700, representing a 3.64% or$1,199,400 increase over 2012.At the request <strong>of</strong> the <strong>City</strong>, the <strong>Guelph</strong> Police Services Board provided budget reductions <strong>of</strong> approximately$473,000. These reductions are primarily due to the introduction <strong>of</strong> a salary vacancy estimate, reducing benefitreserve contributions and an assumption <strong>of</strong> reduced benefit costs due to the <strong>City</strong>’s tendering <strong>of</strong> the benefitpackage provider.CapitalThe <strong>Guelph</strong> Police Service Board is requesting $16 million in capital funding over the 10-year budget andforecast. The majority <strong>of</strong> projects included in the 10-year capital budget and forecast relate to vehicleequipment replacement and police equipment life cycle requirements.A complete overview <strong>of</strong> the <strong>Guelph</strong> Police Service Board’s Operating and Capital budget is in Tab 6.<strong>City</strong> <strong>of</strong> <strong>Guelph</strong> – <strong>2013</strong> Local Boards and Shared Services <strong>Budget</strong>267
<strong>Guelph</strong> Public LibraryThe <strong>Guelph</strong> Public Library benefits the entire community and supports lifelong learning by providing access toinformation and recreational resources that enrich, educate and entertain.<strong>2013</strong> Financial Snapshot2011Actuals2012Approved<strong>Budget</strong><strong>2013</strong>Requested<strong>Budget</strong>Year/YearChange($)TaxSupported(%)Fees(%)Donation(%)7,563,361 7,800,670 7,997,725 197,055 94% 4% 0.6% 2%GrantFunded(%)<strong>City</strong> <strong>of</strong> <strong>Guelph</strong> – <strong>2013</strong> Local Boards and Shared Services <strong>Budget</strong>268
<strong>Guelph</strong>OrganizationPublicChartLibraryOrganizational Structure<strong>Guelph</strong> Library BoardCEO - K. PopeAssistant CEO- C. McInnisManager <strong>of</strong> Systems- A. KwanDir. <strong>of</strong> Branch/Bookmobile Services- R. TunneyHuman Resources &Facilities Coordinator- M. LynnFinance Services- J. ChangDir. Main Library- S. KraftTechnicalServices- C. McInnisBullfrogMall/Bookmobile- C. TaylorWestminsterSquareBranch- D. AtkinsScottsdaleBranch- R. TunneyEast EndBranch- N. ClarkeWest EndBranch- S. TurnerChildren &Youth Service- S. KraftAdult Circulation- A. Norcross-LoveArchieves- D. HiltzExtensionServices- G. DuffinInformationService- S. Kraft<strong>City</strong> <strong>of</strong> <strong>Guelph</strong> – <strong>2013</strong> Local Boards and Shared Services <strong>Budget</strong>269
<strong>Guelph</strong> Public LibraryServices Provided• Archival services• Information services• Collections and lending services• Programming• Children’s services• Teen services• Outreach/seniors services2012 Accomplishments• Circulation <strong>of</strong> material year-to-date has increased 7.2 per cent, with more than 53,000 active cardholders,borrowing 6,400 materials every day, including books, magazines, audio/visual resources and eBooks.• Programming attendance has increased 6 percent with 1,020 programs <strong>of</strong>fered at all GPL locations.• <strong>Guelph</strong> Public Library launched its first fundraising event in 2012, with a very high attendance. The revenuegenerated by fundraising events will exceed the $19,000 goal.• <strong>Guelph</strong> Public Library launched a newly enhanced website that <strong>of</strong>fers many new features which benefit theentire communityKey Performance MeasuresIndicator Description2011Actual2012Estimate<strong>2013</strong>EstimateNumber <strong>of</strong> collection items borrowed 1,956,167 2,130,649 2,279,794Program Attendance 26,253 27,867 30,932Reference, Referrals and Reader’s Advisory (Information Requests) 90,604 98,993 106,913<strong>City</strong> <strong>of</strong> <strong>Guelph</strong> – <strong>2013</strong> Local Boards and Shared Services <strong>Budget</strong>270
<strong>Guelph</strong> Public LibraryTrend Analysis• The majority <strong>of</strong> the <strong>Guelph</strong> Public Library budget is related to direct program delivery. Compensationrepresents 65 per cent <strong>of</strong> the library’s budget, and any increase relates to the collective bargainingagreement.• The second largest cost directly related to program delivery is the purchase <strong>of</strong> library materials. It represents16 per cent <strong>of</strong> the overall expenses, and includes books, magazines, audio/visual resources, electronicresources and other operating supplies.• The demand for library materials has increased by 7.2 per cent in the first 10 months <strong>of</strong> 2012 and isexpected to increase by an additional 7 per cent in <strong>2013</strong>.• Information requests are expected to increase by 8 per cent in <strong>2013</strong>. <strong>Guelph</strong> citizens turn to the publiclibrary for answers, as they navigate the World Wide Web. With the demand for information requestsincreasing, the number and complexity <strong>of</strong> questions has increased as well<strong>City</strong> <strong>of</strong> <strong>Guelph</strong> – <strong>2013</strong> Local Boards and Shared Services <strong>Budget</strong>271
<strong>Guelph</strong> Public LibraryYear/Year Expense Comparison$6,000,000$5,000,000$4,000,000$3,000,000$2,000,000$1,000,0000CompensationBooks, magazines, films and suppliesLeases and common area chargesEquipment and building maintenance2012 <strong>2013</strong>UtilitiesPostage, telephone and express courier serviceOther expenses<strong>City</strong> <strong>of</strong> <strong>Guelph</strong> – <strong>2013</strong> Local Boards and Shared Services <strong>Budget</strong>272
<strong>Guelph</strong> Public LibraryYear/Year Revenue Comparison$9,000,000$8,000,000$7,000,000$6,000,000$5,000,000$4,000,000$3,000,000$2,000,000$1,000,0000Revenue feesRevenue donationsRevenue provincial fundingFunding from the <strong>City</strong> <strong>of</strong> <strong>Guelph</strong>2012 <strong>2013</strong><strong>City</strong> <strong>of</strong> <strong>Guelph</strong> – <strong>2013</strong> Local Boards and Shared Services <strong>Budget</strong>273
<strong>Guelph</strong> Public Library<strong>2013</strong> Objectives• Expand the fundraising program, with two fundraising events and one sustainable program, continuing thefurnishing and equipping <strong>of</strong> the new Main Library• Offer a wide variety <strong>of</strong> programs at each location that appeals to all ages• Continue delivering the excellent services to our community<strong>City</strong> <strong>of</strong> <strong>Guelph</strong> – <strong>2013</strong> Local Boards and Shared Services <strong>Budget</strong>274
<strong>City</strong> <strong>of</strong> <strong>Guelph</strong><strong>2013</strong> Operating <strong>Budget</strong>Library2012<strong>2013</strong><strong>2013</strong><strong>2013</strong><strong>2013</strong><strong>2013</strong><strong>Budget</strong>Base Eff/New/Growth Requested <strong>Budget</strong> <strong>Budget</strong><strong>Budget</strong> Impact From Capital <strong>Budget</strong> Change $ Change %Local Boards61 LibraryRevenueUser Fees & Service Charges ($310,000) (328,300) $0 ($328,300) ($18,300) 5.9%Product Sales 0 0 0 0 0 0.0%Interest & Penalties 0 0 0 0 0 0.0%External Recoveries (65,000) (51,200) 0 (51,200) 13,800 (21.2%)Grants (167,700) (167,700) 0 (167,700) 0 0.0%Total Revenue (542,700) (547,200) 0 (547,200) (4,500) 0.8%ExpenditureSalary, Wage & Benefits 5,433,120 5,517,625 0 5,517,625 84,505 1.6%Purchased Goods 1,476,101 1,475,800 0 1,475,800 (301) 0.0%Purchased Services 1,358,749 1,435,300 0 1,435,300 76,551 5.6%Financial Expenses 0 7,200 0 7,200 7,200 0.0%Total Expenditure 8,267,970 8,435,925 0 8,435,925 167,955 2.0%Net Before Internal Charges & Recoveries 7,725,270 7,888,725 0 7,888,725 163,455 2.1%Internal Charges & RecoveriesInternal Charges 75,400 109,000 0 109,000 33,600 44.6%Internal Recoveries 0 0 0 0 0 0.0%Total Internal Charges & Recoveries 75,400 109,000 0 109,000 33,600 44.6%Net <strong>Budget</strong> 7,800,670 7,997,725 0 7,997,725 197,055 2.5%Run Date: 22/03/13 4:18 PM275
<strong>City</strong> <strong>of</strong> <strong>Guelph</strong><strong>2013</strong> Operating <strong>Budget</strong>Public Health2012<strong>2013</strong><strong>2013</strong><strong>2013</strong><strong>2013</strong><strong>2013</strong><strong>Budget</strong>Base Eff/New/Growth Requested <strong>Budget</strong> <strong>Budget</strong><strong>Budget</strong> Impact From Capital <strong>Budget</strong> Change $ Change %Shared Services70 Shared ServicesRevenueTotal Revenue $0 0 $0 $0 $0 0.0%ExpenditureOther Transfers 3,017,277 2,737,277 0 2,737,277 (280,000) (9.3%)Total Expenditure 3,017,277 2,737,277 0 2,737,277 (280,000) (9.3%)Net Before Internal Charges & Recoveries 3,017,277 2,737,277 0 2,737,277 (280,000) (9.3%)Internal Charges & RecoveriesTotal Internal Charges & Recoveries 0 0 0 0 0 0.0%Net <strong>Budget</strong> 3,017,277 2,737,277 0 2,737,277 (280,000) (9.3%)Run Date: 22/03/13 4:18 PM276
<strong>City</strong> <strong>of</strong> <strong>Guelph</strong><strong>2013</strong> Operating <strong>Budget</strong>Social Services2012<strong>2013</strong><strong>2013</strong><strong>2013</strong><strong>2013</strong><strong>2013</strong><strong>Budget</strong>Base Eff/New/Growth Requested <strong>Budget</strong> <strong>Budget</strong><strong>Budget</strong> Impact From Capital <strong>Budget</strong> Change $ Change %Shared Services70 Shared ServicesRevenueTotal Revenue $0 0 $0 $0 $0 0.0%ExpenditureGovernment Transfers 4,828,000 4,515,000 0 4,515,000 (313,000) (6.5%)Other Transfers 75,000 75,000 0 75,000 0 0.0%Total Expenditure 4,903,000 4,590,000 0 4,590,000 (313,000) (6.4%)Net Before Internal Charges & Recoveries 4,903,000 4,590,000 0 4,590,000 (313,000) (6.4%)Internal Charges & RecoveriesTotal Internal Charges & Recoveries 0 0 0 0 0 0.0%Net <strong>Budget</strong> 4,903,000 4,590,000 0 4,590,000 (313,000) (6.4%)Run Date: 22/03/13 4:18 PM277
<strong>City</strong> <strong>of</strong> <strong>Guelph</strong><strong>2013</strong> Operating <strong>Budget</strong>Social Housing2012<strong>2013</strong><strong>2013</strong><strong>2013</strong><strong>2013</strong><strong>2013</strong><strong>Budget</strong>Base Eff/New/Growth Requested <strong>Budget</strong> <strong>Budget</strong><strong>Budget</strong> Impact From Capital <strong>Budget</strong> Change $ Change %Shared Services70 Shared ServicesRevenueTotal Revenue $0 0 $0 $0 $0 0.0%ExpenditureGovernment Transfers 15,047,000 15,663,000 0 15,663,000 616,000 4.1%Total Expenditure 15,047,000 15,663,000 0 15,663,000 616,000 4.1%Net Before Internal Charges & Recoveries 15,047,000 15,663,000 0 15,663,000 616,000 4.1%Internal Charges & RecoveriesInternal Recoveries 0 0 0 0 0 0.0%Total Internal Charges & Recoveries 0 0 0 0 0 0.0%Net <strong>Budget</strong> 15,047,000 15,663,000 0 15,663,000 616,000 4.1%Run Date: 22/03/13 4:18 PM278
<strong>City</strong> <strong>of</strong> <strong>Guelph</strong><strong>2013</strong> Operating <strong>Budget</strong>Child Care2012<strong>2013</strong><strong>2013</strong><strong>2013</strong><strong>2013</strong><strong>2013</strong><strong>Budget</strong>Base Eff/New/Growth Requested <strong>Budget</strong> <strong>Budget</strong><strong>Budget</strong> Impact From Capital <strong>Budget</strong> Change $ Change %Shared Services70 Shared ServicesRevenueTotal Revenue $0 0 $0 $0 $0 0.0%ExpenditurePurchased Services 0 0 0 0 0 0.0%Government Transfers 2,710,000 2,910,000 0 2,910,000 200,000 7.4%Other Transfers 0 0 0 0 0 0.0%Total Expenditure 2,710,000 2,910,000 0 2,910,000 200,000 7.4%Net Before Internal Charges & Recoveries 2,710,000 2,910,000 0 2,910,000 200,000 7.4%Internal Charges & RecoveriesTotal Internal Charges & Recoveries 0 0 0 0 0 0.0%Net <strong>Budget</strong> 2,710,000 2,910,000 0 2,910,000 200,000 7.4%Run Date: 22/03/13 4:18 PM279
<strong>City</strong> <strong>of</strong> <strong>Guelph</strong><strong>2013</strong> Operating <strong>Budget</strong><strong>City</strong> Social Programs2012<strong>2013</strong><strong>2013</strong><strong>2013</strong><strong>2013</strong><strong>2013</strong><strong>Budget</strong>Base Eff/New/Growth Requested <strong>Budget</strong> <strong>Budget</strong><strong>Budget</strong> Impact From Capital <strong>Budget</strong> Change $ Change %Shared Services70 Shared ServicesRevenueTotal Revenue $0 0 $0 $0 $0 0.0%ExpenditurePurchased Services 0 0 0 0 0 0.0%Government Transfers 166,000 1,166,000 0 1,166,000 1,000,000 602.4%Other Transfers 18,000 18,000 0 18,000 0 0.0%Total Expenditure 184,000 1,184,000 0 1,184,000 1,000,000 543.5%Net Before Internal Charges & Recoveries 184,000 1,184,000 0 1,184,000 1,000,000 543.5%Internal Charges & RecoveriesInternal Charges 75,000 75,000 0 75,000 0 0.0%Internal Recoveries 0 0 0 0 0 0.0%Total Internal Charges & Recoveries 75,000 75,000 0 75,000 0 0.0%Net <strong>Budget</strong> 259,000 1,259,000 0 1,259,000 1,000,000 386.1%Run Date: 22/03/13 4:18 PM280
Downtown <strong>Guelph</strong> Business Association<strong>2013</strong> DRAFT <strong>Budget</strong> (with 2012 Approved <strong>Budget</strong>)<strong>2013</strong> 2012 Change ($) Change (%)RevenueTax Levy Income 436,000.00 424,000.00 12,000.00 2.83%Tax Levy Adjustment 5,000.00 -25,000.00 30,000.00 -120.00%Total Tax Levy Income 431,000.00 399,000.00 32,000.00 8.02%Surplus from Prior Fiscal 0.00 40,000.00 -40,000.00 -100.00%Funds from <strong>City</strong> 29,000.00 29,000.00 0.00 0.00%Co-op Advertising Revenue 20,000.00 5,000.00 15,000.00 300.00%Grant Income 0.00 0.00 0.00 0.00%Events & Workshop Revenue 0.00 0.00 0.00 0.00%Gift Certificate Write-<strong>of</strong>f Income 0.00 0.00 0.00 0.00%Bank Interest 0.00 0.00 0.00 0.00%Miscellaneous Revenue 0.00 0.00 0.00 0.00%Total Revenue 480,000.00 473,000.00 7,000.00 1.48%281TOTAL REVENUE 480,000.00 473,000.00 7,000.00 1.48%EXPENSEPayroll ExpensesWages & Salaries 189,000.00 189,000.00 0.00 0.00%Contract & Part-time Staff 7,000.00 7,000.00 0.00 0.00%EI Expense 5,500.00 5,500.00 0.00 0.00%CPP Expense 4,500.00 4,500.00 0.00 0.00%WSIB Expense 0.00 0.00 0.00 0.00%EHT Expense 1,000.00 1,000.00 0.00 0.00%Benefits 8,000.00 8,000.00 0.00 0.00%Pension 2,000.00 2,000.00 0.00 0.00%Total Payroll Expenses 217,000.00 217,000.00 0.00 0.00%Marketing & Promotion ExpensesNewspaper Advertising 30,000.00 20,000.00 10,000.00 50.00%Radio Advertising 4,000.00 4,000.00 0.00 0.00%Directories & Guides 3,000.00 3,000.00 0.00 0.00%Flyer & Printing Expenses 8,000.00 10,000.00 -2,000.00 -20.00%Website Expenses 5,000.00 5,000.00 0.00 0.00%Signage 1,000.00 1,000.00 0.00 0.00%Promotional Material 4,000.00 4,000.00 0.00 0.00%Design Fees 7,000.00 7,000.00 0.00 0.00%Sponsorships 7,000.00 7,000.00 0.00 0.00%Gift Certificate Donations 775.00 775.00 0.00 0.00%Other General Advertising Expenses (Postage) 4,000.00 4,000.00 0.00 0.00%Total Marketing & Promotion Expense 73,775.00 65,775.00 8,000.00 12.16%Event ExpensesRoad Closure Expense 2,000.00 2,000.00 0.00 0.00%<strong>City</strong> Flowers 14,500.00 14,500.00 0.00 0.00%Downtown Streetscaping 29,000.00 29,000.00 0.00 0.00%Downtown Lighting 9,000.00 10,000.00 -1,000.00 -10.00%Artist & Musician Fees 7,500.00 7,500.00 0.00 0.00%
Downtown <strong>Guelph</strong> Business Association<strong>2013</strong> DRAFT <strong>Budget</strong> (with 2012 Approved <strong>Budget</strong>)<strong>2013</strong> 2012 Change ($) Change (%)Casual Workers 2,000.00 2,000.00 0.00 0.00%Rentals 2,000.00 2,000.00 0.00 0.00%Materials 1,000.00 1,000.00 0.00 0.00%Total Event Expenses 67,000.00 68,000.00 -1,000.00 -1.47%Meetings & Pr<strong>of</strong> Development ExpenseBoard & Committee Meeting Expenses 2,000.00 2,000.00 0.00 0.00%Conference & Event Fees 4,500.00 4,500.00 0.00 0.00%Education Expense 3,000.00 3,000.00 0.00 0.00%ED & Business Development Expense 1,000.00 1,000.00 0.00 0.00%Staff & Exec Events 1,000.00 1,000.00 0.00 0.00%Total Meetings & Pr<strong>of</strong> Develop Exp 11,500.00 11,500.00 0.00 0.00%282General & Administrative ExpensesAccounting & Legal Expenses 4,000.00 4,000.00 0.00 0.00%Bookkeeping Expenses 4,000.00 4,000.00 0.00 0.00%Consultants 5,000.00 5,000.00 0.00 0.00%Rent Expense 33,000.00 33,000.00 0.00 0.00%Telephone & Internet 5,500.00 5,500.00 0.00 0.00%Insurance 25.00 25.00 0.00 0.00%Postage & Courier 2,500.00 2,500.00 0.00 0.00%Office Supplies 4,000.00 4,000.00 0.00 0.00%Office Repairs & Maintenance 2,000.00 2,000.00 0.00 0.00%Equipment Rental 4,000.00 4,000.00 0.00 0.00%Dues & Subscriptions 2,000.00 2,000.00 0.00 0.00%Gifts & Various Expenses 1,200.00 1,200.00 0.00 0.00%Bad Debts 0.00 0.00 0.00 0.00%Cash Short/Over 0.00 0.00 0.00 0.00%Bank Fees 500.00 500.00 0.00 0.00%Total General & Admin Expenses 67,725.00 67,725.00 0.00 0.00%Other ExpensesMiscellaneous Expenses 3,000.00 3,000.00 0.00 0.00%Rink Contribution 40,000.00 40,000.00 0.00 0.00%Total Other Expenses 43,000.00 43,000.00 0.00 0.00%TOTAL EXPENSE 480,000.00 473,000.00 7,000.00 1.48%NET INCOME 0.00 0.00 0.00 0.00%
<strong>Guelph</strong> Police ServiceThe vision <strong>of</strong> the <strong>Guelph</strong> Police Service is to contribute to the safety <strong>of</strong> our community by way <strong>of</strong> intelligenceledpolicing and community partnerships, and the growth and development <strong>of</strong> our members via leadershipand innovative policing that is effective, efficient, economical and environmentally responsible.<strong>2013</strong> Financial Snapshot2011Actuals2012Approved<strong>Budget</strong><strong>2013</strong>Requested<strong>Budget</strong>Year/YearChange($)TaxSupported(%)Funding sourcesUserFee (%)31,259,332 32,927,300 34,126,700 1,199,400 93.3% 3.1% 3.6%GrantFunded(%)<strong>City</strong> <strong>of</strong> <strong>Guelph</strong> – <strong>2013</strong> Local Boards and Shared Services <strong>Budget</strong>283
Organization Chart<strong>Guelph</strong> Police ServiceOrganizational Structure<strong>Guelph</strong> Police Services BoardInspectorExecutiveServicesChief <strong>of</strong> PolicePr<strong>of</strong>essionalStandardsResearch andDevelopmentPublicInformationNeighbourhood ServicesDeputy ChiefLegal ServicesCorporate ServicesDirectorInspectorNeighbourhoodServicesPatrolInspectorNeighbourhoodServices FieldSupportInspectorInvestigativeServicesInspector <strong>of</strong>AdministrationSupportHumanResourcesManagerManger <strong>of</strong>FinanceManager <strong>of</strong>InformationSystemsNeighbourhoodTeamsCrime AnalysisCommunityMobilizationTRU/CIRTTraffic andSchool SafetyYouth andCrime PreventionServicesCanineCivil EmergenciesStrike LiaisonCriminalInvestigationsBranchIntelligenceDrugsForensicInvestigationsand Tech CrimesInternet ChildExploitationCrimesData ServiceCommunicationsCourt ServiceProperty andFirearmsFacilitiesFleetHumanResourceServicesPayrollPr<strong>of</strong>essionalDevelopment& RecruitmentMaterialsManagement<strong>City</strong> <strong>of</strong> <strong>Guelph</strong> – <strong>2013</strong> Local Boards and Shared Services <strong>Budget</strong>284
<strong>Guelph</strong> Police Service2012 Accomplishments• Hired two civilian special constables to support the front line platoons by providing consistent and costeffective service to the public and to the treatment and care <strong>of</strong> prisoners. These additions allowed for theredeployment <strong>of</strong> two <strong>of</strong>ficers to other departments including one <strong>of</strong>ficer to the Child Pornography unit andone <strong>of</strong>ficer to target guns and gang activity which is partially funded by the Provincial Anti-ViolenceIntervention Strategy (PAVIS) grant• Increased the hours <strong>of</strong> the Freedom <strong>of</strong> Information civilian to support the workload in the Freedom <strong>of</strong>Information/Legal <strong>of</strong>fice• Successfully received grants, including a Civil Remedies grant to fund the procurement <strong>of</strong> a forensic lightsource to enhance the abilities <strong>of</strong> the Forensic Identification unit and a computer storage device for theChild Pornography unit to categorize images and prevent child abuse victimization. Also received fundsthrough the Court Security Prisoner Transportation Program to assist in <strong>of</strong>fsetting some <strong>of</strong> the costs <strong>of</strong> courtsecurity and prisoner transportation costs• Introduced a new police poly-wool uniform and a new model <strong>of</strong> police vehicles “Interceptor” that willcontribute towards environmental and cost efficiencies• Implemented an information systems System Center Operation Manager (SCOM) project to enable remoteassistance and implement a wireless infrastructure• Created an architectural design for the renovation <strong>of</strong> the Police headquarters building to address knowndeficiencies in staff accommodations, evidence storage, locker room and prisoner lock-up.Key Performance Measures2010Actuals2011Actuals2012Projection<strong>2013</strong>TargetPolicing Cost per Capital ($) $241 $248 $264 $273Operating Surplus/(Deficit) $249,213 $535,313 $700,000 $-Population per Police Officer 654 647 653 660Average Response Time (mins),Priority One Calls for Service5.3 4.5 maintain orimprovePublic Complaint Investigations 14.0 20.0 maintain orimproveCrime Clearance Rate 55.5 48.0 maintain orimproveCrime Severity Rate 50.4 47.0 maintain orimprovemaintain orimprovemaintain orimprovemaintain orimprovemaintain orimprove<strong>City</strong> <strong>of</strong> <strong>Guelph</strong> – <strong>2013</strong> Local Boards and Shared Services <strong>Budget</strong>285
<strong>Guelph</strong> Police ServiceSuccessfully kept expenditures within the <strong>of</strong>ficial budget in both 2010, 2011 and 2012Improved Priority one response time and crime clearance rates in 2011Retained “safest <strong>City</strong> in Canada” status by maintaining the lowest Crime Severity Index for Canadian CensusMetropolitan Areas for the fifth year in a rowTrend Analysis• The majority <strong>of</strong> the <strong>Guelph</strong> Police Service’s budget is related to costs associated with direct programdelivery. Compensation represents over 90 per cent <strong>of</strong> the service’s budget and increases can be tied backto the collective bargaining agreement and benefit usage and cost increases. No expansions or staff growthhave been assumed in the <strong>2013</strong> budget in order to mitigate budget increases.• Other expense categories have remained relatively flat over the years• Grants increased in the <strong>2013</strong> budget due to the inclusion <strong>of</strong> the Court Security Prisoner Transportationprogram which was <strong>of</strong>fset by the expiry <strong>of</strong> the Police Officer Recruitment Fund (PORF) on March 31, <strong>2013</strong>• External recoveries were high in 2010 due to recoveries from the joint force policing projects Olympics andG20• User Fees increased in the <strong>2013</strong> budget due to additional volumes for fees charged in the <strong>Guelph</strong> PoliceService’s fees and charges by-law• Internal recoveries reduced in <strong>2013</strong> due to the removal <strong>of</strong> an one-time recovery <strong>of</strong> $48,000 from the city t<strong>of</strong>und the costs incurred by the <strong>Guelph</strong> Police Service associated with volunteer reference checks to precludethe imposition <strong>of</strong> a recovery fee<strong>City</strong> <strong>of</strong> <strong>Guelph</strong> – <strong>2013</strong> Local Boards and Shared Services <strong>Budget</strong>286
<strong>Guelph</strong> Police ServiceYear/Year Expense Comparison$35,000,000$30,000,000$25,000,000$20,000,000$15,000,000$10,000,000$5,000,0000CompensationPurchased goodsPurchased servicesInternal charges2010 Actual 2011 Actual 2012 <strong>Budget</strong> <strong>2013</strong> <strong>Budget</strong><strong>City</strong> <strong>of</strong> <strong>Guelph</strong> – <strong>2013</strong> Local Boards and Shared Services <strong>Budget</strong>287
<strong>Guelph</strong> Police ServiceYear/Year Revenue Comparison$1,400,000$1,200,000$1,000,000$800,000$600,000$400,000$200,0000GrantsExternal recoveriesUser feesInternal recoveries2010 Actual 2011 Actual 2012 <strong>Budget</strong> <strong>2013</strong> <strong>Budget</strong><strong>City</strong> <strong>of</strong> <strong>Guelph</strong> – <strong>2013</strong> Local Boards and Shared Services <strong>Budget</strong>288
<strong>City</strong> <strong>of</strong> <strong>Guelph</strong><strong>2013</strong> Operating <strong>Budget</strong>Police2012<strong>2013</strong><strong>2013</strong><strong>2013</strong><strong>2013</strong><strong>2013</strong><strong>Budget</strong>Base Eff/New/Growth Requested <strong>Budget</strong> <strong>Budget</strong><strong>Budget</strong> Impact From Capital <strong>Budget</strong> Change $ Change %Local Boards60 PoliceRevenueUser Fees & Service Charges ($394,700) (427,400) $0 ($427,400) ($32,700) 8.3%Product Sales (13,000) (8,000) 0 (8,000) 5,000 (38.5%)Licenses & Permits (46,000) (53,000) 0 (53,000) (7,000) 15.2%External Recoveries (41,800) (51,800) 0 (51,800) (10,000) 23.9%Grants (1,189,800) (1,330,800) 0 (1,330,800) (141,000) 11.9%Total Revenue (1,685,300) (1,871,000) 0 (1,871,000) (185,700) 11.0%ExpenditureSalary, Wage & Benefits 31,746,400 33,046,200 0 33,046,200 1,299,800 4.1%Purchased Goods 1,162,900 1,213,900 22,800 1,236,700 73,800 6.3%Purchased Services 1,998,000 1,986,200 4,100 1,990,300 (7,700) (0.4%)Financial Expenses 2,700 2,700 0 2,700 0 0.0%Total Expenditure 34,910,000 36,249,000 26,900 36,275,900 1,365,900 3.9%Net Before Internal Charges & Recoveries 33,224,700 34,378,000 26,900 34,404,900 1,180,200 3.6%Internal Charges & RecoveriesInternal Charges 333,900 302,600 10,000 312,600 (21,300) (6.4%)Internal Recoveries (631,300) (590,800) 0 (590,800) 40,500 (6.4%)Total Internal Charges & Recoveries (297,400) (288,200) 10,000 (278,200) 19,200 (6.5%)Net <strong>Budget</strong> 32,927,300 34,089,800 36,900 34,126,700 1,199,400 3.6%Run Date: 22/03/13 4:18 PM290
chapter 6<strong>2013</strong> Tax-supportedCapital <strong>Budget</strong> and Forecast291
<strong>2013</strong>–2022 Tax-supported Capital <strong>Budget</strong> and ForecastThe capital budget and forecast seeks to align the <strong>City</strong>’s resources with key initiatives designed to supportorganizational excellence, innovation in local government and city building – the three strategic focus areas <strong>of</strong><strong>Guelph</strong>’s Corporate Strategic Plan (CSP).A capital expenditure is defined as any significant expenditure incurred to acquire or improve land, buildings,engineering structures, machinery and equipment. It usually results in a benefit lasting beyond one year andthe acquisition or extension <strong>of</strong> the life <strong>of</strong> a fixed asset.While they are not classified as a tangible capital asset, certain studies eligible for development charge fundingare included in the capital forecast. <strong>Guelph</strong>’s capital budget and forecast includes project such as:• Roads, bridge and storm construction• Transit• Vehicle and equipment replacement• Facilities and building asset management• Protective ServicesThe <strong>2013</strong>-22 tax-supported capital budget and forecast continues to build on the <strong>City</strong>’s principles <strong>of</strong> financialsustainability, fiscal capacity, accountability and transparency. These principles reflect the recognized need tomaintain and rehabilitate the <strong>City</strong>’s existing infrastructure while minimizing reliance on debt.The graph below shows how most <strong>of</strong> the $51.5 million capital investment in <strong>2013</strong> is allocated to health andsafety and infrastructure renewal projects ($29.14 million). Forward facing city building projects such as theClair Road/Laird Road Interchange and Eastview Community Park account for $12.72 million and key initiativessupporting the CSP account for and $9.61 million.<strong>2013</strong> Tax-supported Capital <strong>Budget</strong> Project Distribution($51,470,300)Forward Facing<strong>City</strong> Building Projects$12,724.925%CSP Initiatives$9,608.619%Health and Safetyand Infastruture Renewal$29,136.856%<strong>City</strong> <strong>of</strong> <strong>Guelph</strong> – <strong>2013</strong>–2022 Tax-supported Capital <strong>Budget</strong> and Forecast292
<strong>2013</strong>–2022 Tax-supported Capital <strong>Budget</strong> and Forecast>> Fiscal FrameworkThe <strong>City</strong>’s capital budget is a long-term sustainable investment plan and forecast. The timing for capital work,cost and funding sources have been considered, and all 10-years are funded within the Council-approvedguideline which allows for 20 per cent <strong>of</strong> the prior year’s net tax levy to be transferred to reserve funds to payfor current and future capital work and fund debt servicing costs.As in past years, the <strong>2013</strong> capital budget focuses on sustainability and fiscal responsibility. Within the forecast,efforts have been made to ensure that appropriate funding allotments have been made to support projectsrelated to maintaining the <strong>City</strong>’s road and storm water infrastructure, buildings and vehicle and equipmentassets. The funding contributions have been made in accordance with the Council-approved reserve andreserve fund policy.>> Capital <strong>Budget</strong> Process OverviewThe process began in May 2012 with the formation <strong>of</strong> a capital budget team. This team includedrepresentatives from all <strong>City</strong> service areas and was responsible for updating the corporate priority model andbringing forward a fully-funded 10-year capital forecast for Executive Team review and approval.The budget team refined the corporate priority model from 27 criteria to 14 criteria considered critical forevaluating the <strong>City</strong>’s capital projects. The team further considered the Corporate Strategic Plan, Councilapprovedbudget policy, and the Community Sustainability Pillars as the guiding principles in determining theevaluation and prioritization criteria. Together the collaborative team reviewed timing, risk, scope and theinter-relationships between various projects to:• Develop a 10-year capital forecast using the priority model to rank eachproject in the forecast• Complete project information sheets for projects in the first 5-years <strong>of</strong> theforecast; information sheetscontain detailed information and provide an help ensure project continuity• Identify funding constraints, reviewed debt and reserve fund balances to ensure the 10-year forecast isfunded• A list <strong>of</strong> criteria is included at the end <strong>of</strong> this section.<strong>City</strong> <strong>of</strong> <strong>Guelph</strong> – <strong>2013</strong>–2022 Tax-supported Capital <strong>Budget</strong> and Forecast293
<strong>2013</strong>–2022 Tax-supported Capital <strong>Budget</strong> and Forecast>> <strong>2013</strong> Capital budgetThe <strong>City</strong> <strong>of</strong> <strong>Guelph</strong>’s <strong>2013</strong> capital budget total expenditure is $51,470,300 and is allocated between the projectcategories and funding sources identified below:<strong>2013</strong> Capital <strong>Budget</strong> by Project Category and Funding Source (‘000s)External Funding SourcesInternal Funding SourcesProject CategoryProjectCostGrants andSubsidiesFederalGas Tax OtherDevelopmentCharges (DCs)DCDebtEquipmentReplacement<strong>City</strong>Reserves DebtRoads and13,325.0 0.0 5,560.0 430.0 2,721.6 500.0 0.0 4,113.4 0.0Stormwater SystemsPolicy Planning Studies 548.7 0.0 0.0 0.0 234.4 0.0 0.0 314.3 0.0Solid Waste Management 5,734.1 596.3 998.4 153.1 0.0 0.0 2,366.3 420.0 1,200.0Public Works 4,586.1 180.0 0.0 0.0 81.0 0.0 3,291.1 1,034.0 0.0By-law and Security 202.0 0.0 0.0 0.0 0.0 0.0 0.0 202.0 0.0Park Design and1,899.4 25.0 0.0 0.0 1,150.3 0.0 170.4 553.7 0.0MaintenanceTransit 3,005.6 543.6 0.0 0.0 415.7 0.0 1,456.0 590.3 0.0Culture and Entertainment 343.0 0.0 0.0 0.0 0.0 0.0 0.0 343.0 0.0Corporate Buildings and 3,842.0 0.0 0.0 0.4 367.6 0.0 0.0 3,324.0 150.0Recreation FacilitiesEconomic Development 5,089.3 0.0 0.0 5,089.3 0.0 0.0 0.0 0.0 0.0Finance 130.0 0.0 0.0 0.0 105.3 0.0 0.0 24.7 0.0Downtown Improvements 3,700.0 0.0 0.0 0.0 1,704.6 0.0 0.0 0.0 1,995.4Community Energy 1,279.3 0.0 0.0 374.8 2.4 0.0 0.0 902.1 0.0Emergency Services 2,707.6 0.0 0.0 360.8 0.0 0.0 2,311.8 35.0 0.0Information Technology 3,405.5 0.0 0.0 85.1 0.0 0.0 1,418.7 1,901.7 0.0Local Boards 1,672.7 0.0 0.0 8.0 0.0 0.0 1,457.7 207.0 0.0Total <strong>2013</strong> 51,470.3 1,344.9 6,558.4 6,501.5 6,782.9 500.0 12,472.0 13,965.2 3,345.4<strong>City</strong> <strong>of</strong> <strong>Guelph</strong> – <strong>2013</strong>–2022 Tax-supported Capital <strong>Budget</strong> and Forecast294
<strong>2013</strong>–2022 Tax-supported Capital <strong>Budget</strong> and ForecastThe <strong>City</strong> <strong>of</strong> <strong>Guelph</strong>’s nine-year capital forecast is being provided for information and the budgetedexpenditures are $419,899,000. In the following chart that follows, the projects within the forecast are allocatedbetween the following categories and funding sources.2014–2022 Capital <strong>Budget</strong> Forecast by Project Category and Funding Source (‘000s)External Funding SourcesInternal Funding SourcesProject CategoryProjectCostGrantsandSubsidiesFederalGas Tax OtherDevelopmentCharges (DCs)DCDebtEquipmentReplacement<strong>City</strong>Reserves DebtRoads and157,354.0 0.0 61,158.9 8,748.9 22,940.0 13,000.0 0.0 51,506.2 0.0Stormwater SystemsPolicy Planning Studies 3,759.2 0.0 0.0 0.0 1,743.4 0.0 0.0 2,015.8 0.0Solid Waste19,567.7 0.0 600.0 550.0 0.0 0.0 8,562.7 9,855.0 0.0ManagementPublic Works 58,050.9 0.0 0.0 0.0 1,969.9 0.0 38,133.9 17,947.1 0.0By-law and Security 2,145.7 0.0 0.0 0.0 0.0 0.0 0.0 2,145.7 0.0Park Design and45,018.2 0.0 0.0 0.0 22,983.0 0.0 3,624.2 18,411.0 0.0MaintenanceTransit 26,942.0 205.0 0.0 0.0 2,945.7 0.0 21,393.2 2,398.1 0.0Culture and3,435.0 0.0 0.0 250.0 0.0 0.0 0.0 3,185.0 0.0EntertainmentCorporate Buildings 28,849.9 0.0 0.0 0.0 669.9 0.0 0.0 21,180.0 7,000.0and Recreation FacilitiesEconomic18,356.6 0.0 0.0 18,356.6 0.0 0.0 0.0 0.0 0.0DevelopmentFinance 140.0 0.0 0.0 0.0 113.4 0.0 0.0 26.6 0.0Downtown1,400.0 0.0 0.0 0.0 645.0 0.0 0.0 0.0 755.0ImprovementsCommunity Energy 10,783.0 0.0 0.0 3,221.6 3.6 0.0 0.0 7,557.8 0.0Emergency Services 13,660.6 0.0 0.0 3,935.4 0.0 0.0 9,725.2 0.0 0.0Information Technology 14,583.3 0.0 0.0 506.5 0.0 0.0 12,063.9 2,012.9 0.0Local Boards 15,852.9 0.0 0.0 64.0 0.0 0.0 12,992.4 2,866.5 0.0Total 2014–2022 419,899.0 205.0 61,758.9 35,633.0 54,013.9 13,000.0 106,425.5 141,107.7 7,755.0<strong>City</strong> <strong>of</strong> <strong>Guelph</strong> – <strong>2013</strong>–2022 Tax-supported Capital <strong>Budget</strong> and Forecast295
<strong>2013</strong>–2022 Tax-supported Capital <strong>Budget</strong> and ForecastA full list <strong>of</strong> projects and vehicle and replacement details are included at the end <strong>of</strong> this sectionDebt BurdenIn 2012 Standard and Poor’s reaffirmed the <strong>City</strong>’s “AA” credit rating and revised the outlook from stable topositive. One <strong>of</strong> the reasons for the upgraded outlook is the <strong>City</strong>’s commitment to manage its debt burdenresponsibly over the outlook horizon.The <strong>2013</strong> capital budget recognizes the need to continue to be somewhat conservative with respect to usingdebt financing to fund capital projects. As a result, certain capital projects that would be debt-financed are notincluded in the long-range forecast. The <strong>City</strong> continues to explore alternative financing opportunities to payfor its share <strong>of</strong> these projects including grant funding, partnerships and other innovative ways <strong>of</strong> providingthese services and facilities.The <strong>City</strong> must also consider future operating impact <strong>of</strong> constructing new assets including debt servicing andthe cost <strong>of</strong> operating and maintaining the asset. By limiting these costs, <strong>Guelph</strong> can ensure funds are availablefor emerging community needs, and help prepare the <strong>City</strong> for both predicted and unexpected needs thataccompany a growing community.In recognition <strong>of</strong> the Corporate Strategic Plan and the <strong>City</strong>’s legislative obligations, the <strong>City</strong>’s <strong>2013</strong>-22 debtforecast shows two new projects that will be debt-financed:Public Health Facilities - the <strong>City</strong> is obligated to pay its share <strong>of</strong> the new facilities being constructed in <strong>Guelph</strong>and Orangeville by Wellington-Dufferin-<strong>Guelph</strong> Public Health under the governing legislation detailed in theOntario Heath and Promotion and Protection Act.Baker Street Redevelopment Phase Three and Four - in accordance with <strong>City</strong> Council’s 2009 direction the <strong>City</strong>will assemble the land packages required for the Baker Street Redevelopment site and position it as shovelreadyfor future development.Development Charges (DC) StudyThe <strong>City</strong> is currently undertaking the initial stages <strong>of</strong> the 2014 DC Study. Through the study, staff will review the<strong>City</strong>’s existing development charges and bring forward a recommendation on a new charge to ensure thesereserves are sustainable and funding is available to meet future growth needs. As part <strong>of</strong> the review, staff willexamine the anticipated amount, type and location <strong>of</strong> development through the study’s timeframe, andreview existing service standards.The <strong>2013</strong> tax-supported capital budget is using approximately $6.8 million from the <strong>City</strong>’s DC Reserves to fundcapital work. Identified under the Province’s Places to Grow legislation, this source <strong>of</strong> funding is critical to the<strong>City</strong>’s ability to provide infrastructure to support the needs <strong>of</strong> a growing community. As part <strong>of</strong> the work, the2014 DC Study process will include a formal peer review team including key stakeholders. The purpose <strong>of</strong> thisteam is to allow for the opportunity for more regular communication and agreement regarding keyassumptions going into the development <strong>of</strong> the study.<strong>City</strong> <strong>of</strong> <strong>Guelph</strong> – <strong>2013</strong>–2022 Tax-supported Capital <strong>Budget</strong> and Forecast296
<strong>2013</strong>–2022 Tax-supported Capital <strong>Budget</strong> and ForecastIt should be noted that the DC Study is a mandatory requirement under the Development Charges Act, 1997and the resulting study and by-law allows the <strong>City</strong> <strong>of</strong> <strong>Guelph</strong> to impose development charges against land topay for increased capital costs required because <strong>of</strong> the increased need for physical infrastructure and otherservices arising from development and redevelopment.Alternative Capital Financing OpportunitiesThe <strong>City</strong> continues to seek new and innovative ways to fund capital projects. The <strong>City</strong> is building a frameworkto support this objective and ensure tools are in place to evaluate all financing options before proceeding withnew projects. Most notable is the business planning s<strong>of</strong>tware staff are implementing and using to evaluateapproved pilot projects throughout 2012 and early <strong>2013</strong>.Two key projects in the <strong>2013</strong> capital budget leverage alternative financing opportunities by demonstratingcost avoidance strategies for future budgets: the facility energy measures and joint wireless design projects.Both projects access funding from the <strong>City</strong>’s Capital Renewal Reserve Fund (previously known as Hydro Note)or leverage other alternative funding sources to raise the seed funding needed to move the project forward.The Facility Energy Measures project also provides the opportunity to leverage partner contributions in eitherthe current or future budget years.One <strong>of</strong> the key requirements <strong>of</strong> accessing funding from the Capital Renewal Reserve Fund is the ability toprovide a business case with a demonstrated payback to the reserve fund. As such, further scrutiny will beapplied to these projects and the <strong>City</strong>’s Executive Team must approve each business case prior to proceedingwith any spending against these projects.Capital FinancingOne <strong>of</strong> the major constraints for any municipality is the amount <strong>of</strong> funding available to pay for capital works.As the capital budget is developed, staff continuously seeks to optimize available funding by leveragingexternal and alternative funding sources to pay for capital projects. The following graphs show the distribution<strong>of</strong> funding for the <strong>2013</strong> tax supported capital budget and nine-year year forecast.External Funding SourcesExternal funding is funding that is provided by a source other than the <strong>City</strong> tax levy or tax supported debt.External funding sources can include the following:• Grants and subsidies• Federal Gas Tax• Other external contributions such as land sales and partner contributions• Development charges• Development Charge Grant<strong>City</strong> <strong>of</strong> <strong>Guelph</strong> – <strong>2013</strong>–2022 Tax-supported Capital <strong>Budget</strong> and Forecast297
<strong>2013</strong>–2022 Tax-supported Capital <strong>Budget</strong> and Forecast<strong>2013</strong> Capital <strong>Budget</strong> by Funding Source$51.5 millionEquipment Replacement24%<strong>City</strong> Reserves27%DC Debt1%Development Charges13%Other13%Debt6%Grants and Subsidies3%Federal Gas Tax13%2014–2022 Capital <strong>Budget</strong> by Funding Source$419.9 millionEquipment Replacement25%<strong>City</strong> Reserves34%DC Debt3%Development Charges13%Grant, Subsides and other8%Debt2%Federal Gas Tax15%<strong>City</strong> <strong>of</strong> <strong>Guelph</strong> – <strong>2013</strong>–2022 Tax-supported Capital <strong>Budget</strong> and Forecast298
<strong>2013</strong>–2022 Tax-supported Capital <strong>Budget</strong> and ForecastCapital Funding from <strong>City</strong> SourcesThe major source <strong>of</strong> internal funding for capital projects is the tax-supported operating budget. The operatingand capital budgets are closely linked in two ways:• All <strong>City</strong> funding for capital projects originates with the tax-supported operating budget or tax-supporteddebt-generated for capital projects; changes to the capital budget can impact the operating budget andthe tax rate• Once a project is complete there can be significant operating and maintenance costs that can result inadditional staffing needs; costs are paid out <strong>of</strong> the operating budget and can impact the tax rate<strong>City</strong> <strong>of</strong> <strong>Guelph</strong> – <strong>2013</strong>–2022 Tax-supported Capital <strong>Budget</strong> and Forecast299
<strong>2013</strong>–2022 Tax-supported Capital <strong>Budget</strong> and ForecastFunding GuidelineThe <strong>City</strong> uses a 20 per cent guideline to determine the amount <strong>of</strong> funding that can be allocated to the <strong>City</strong>reserves. The guideline states that the <strong>City</strong>’s share <strong>of</strong> capital financing cannot exceed 20 per cent <strong>of</strong> the prioryear’s net tax levy. Capital financing refers to the amount transferred to reserves to fund capital projects,support future capital initiatives and make debt payments (principle and interest). The funding guideline usedto establish the 10-year capital budget and forecast is provided below:<strong>2013</strong>-2022 Tax-supported Capital Financing Guideline Calculation($000’s)Assumptions<strong>2013</strong> 2014 2015 2016 2017 2018 2019 2020 2021 2022Levy and GrowthRate Increase %Prior Year NetTax LevyApproved Levyand Growth RateIncreaseNet TaxationRequirement% <strong>of</strong> Net Tax Levyfor CapitalCapital Funding/Debt Servicing(20% <strong>of</strong> Prior YrNet Tax Levy)Debt Servicing(P&I)Capital FundingAvailable forProjects andReservesB=20%*A5.00% 5.00% 5.00% 5.00% 5.00% 5.00% 5.00% 5.00% 5.00% 5.00%A $176,061 $184,864 $194,107 $203,813 $214,003 $224,703 $235,939 $247,735 $260,122 $273,1288,803 9,243 9,705 10,191 10,700 11,235 11,797 12,387 13,006 13,656$184,864 $194,107 $203,813 $214,003 $224,703 $235,939 $247,735 $260,122 $273,128 $286,78520% 20% 20% 20% 20% 20% 20% 20% 20% 20%$35,212 $36,973 $38,821 $40,763 $42,801 $44,941 $47,188 $49,547 $52,024 $54,626C $11,764 $12,749 $16,247 $15,266 $14,541 $14,341 $13,107 $12,281 $12,102 $6,815D $23,448 $24,224 $22,574 $25,496 $28,260 $30,600 $34,081 $37,266 $39,923 $47,811<strong>City</strong> <strong>of</strong> <strong>Guelph</strong> – <strong>2013</strong>–2022 Tax-supported Capital <strong>Budget</strong> and Forecast300
<strong>2013</strong>–2022 Tax-supported Capital <strong>Budget</strong> and ForecastThe <strong>2013</strong> capital budget was approved with an allocation <strong>of</strong> $19.8 million available to fund <strong>City</strong> reserve funds.This funding has been allocated between the various reserve funds highlighted below:<strong>2013</strong> Reserve Fund Contributions (‘000s)Capital Tax 122DC Exemption 597Road Infrastructure 1,295Building Lifecycle 2,160Brownfield 50Vehicle and Equipment 10,997Departmental Reserves 4,575Total Reserve Contributions 19,796These contributions reflect a funding guideline level <strong>of</strong> 17.9 per cent following funding levels <strong>of</strong> 18 per cent <strong>of</strong>the prior year net tax levy in 2011 and 19 per cent <strong>of</strong> the prior year net tax levy in 2012.Reserve fund continuity schedules outlining the transfers to and from <strong>City</strong> reserves for the 10-year period areincluded in Appendix 3.<strong>City</strong> <strong>of</strong> <strong>Guelph</strong> – <strong>2013</strong>–2022 Tax-supported Capital <strong>Budget</strong> and Forecast301
<strong>2013</strong>–2022 Tax-supported Capital <strong>Budget</strong> and ForecastDebt FinancingCapital Projects Receiving Debt FundingThe following projects in the 10-year forecast will be funded using debt-financing:Project # and description Year <strong>of</strong> issue AmountTax-supportedor DC DebtWC0011 Automated Waste Collection Carts * <strong>2013</strong> 1,200,000 Tax-supportedRF0051 Victoria Road Recreation Centre Renovation <strong>2013</strong>–2015 7,150,000 Tax-supportedSS0019 Baker St Redevelopment Ph 3 <strong>2013</strong> 1,995,400 Tax-supportedSS0020 Baker St Redevelopment Ph 4 2014 755,000 Tax-supportedPublic Health Facility 2014 10,400,000 Tax-supportedRD0267 Clair/Laird/Hanlon Interchange <strong>2013</strong>–2015 13,500,000 DC DebtTotal $35,000,400Note: WC0011 is pre-approved per Committee Report titled “Conversion <strong>of</strong> Curbside Waste Collection Program to Fully Automated Carts”<strong>Guelph</strong>’s debt policy prevents the <strong>City</strong> from issuing debt to pay for the ongoing rehabilitation <strong>of</strong> existinginfrastructure, and it is critical to prepare budgets reflecting this constraint to ensure appropriate reservecontributions are made to address infrastructure needs.The following graph shows that as less debt is issued, lower debt servicing costs are incurred and a greateramount <strong>of</strong> funding can be contributed to <strong>City</strong> reserves.<strong>City</strong> <strong>of</strong> <strong>Guelph</strong> – <strong>2013</strong>–2022 Tax-supported Capital <strong>Budget</strong> and Forecast302
<strong>2013</strong>–2022 Tax-supported Capital <strong>Budget</strong> and ForecastComparison <strong>of</strong> Debt Servicing Costs to Contribution to Reserves$60,000$50,000$40,000$30,000$20,000$10,000$0<strong>2013</strong> 2014 2015 2016 2017 2018 2019 2020 2021 2022Capital funding availablefor projects and reservcesTax-supportedDebt ServicingA complete draft debt continuity schedule is included in Appendix 4.<strong>City</strong> <strong>of</strong> <strong>Guelph</strong> – <strong>2013</strong>–2022 Tax-supported Capital <strong>Budget</strong> and Forecast303
<strong>2013</strong>–2022 Tax-supported Capital <strong>Budget</strong> and ForecastCapital Asset ManagementIn 2012, the <strong>City</strong> identified the following key action items as being critical in the development <strong>of</strong> <strong>Guelph</strong>’sAsset Management Strategy:• Corporate asset status report• Review <strong>of</strong> existing policies and strategies• Focus on high risk assets• Focus on individual problemsThe following activities have taken place that help support these goals:• The Engineering Services department retained AECOM to prepare a report highlighting currentinfrastructure spending and provide a condition analysis on the <strong>City</strong>’s transportation, stormwater, water andwastewater infrastructure. The report identifies the <strong>City</strong>’s infrastructure gap as related to these assets.• Fleet Services analyzed the operating and capital costs associated with the <strong>City</strong>’s fleet to ensure adequatefunds are contributed to the capital reserve fund to cover the cost <strong>of</strong> replacing current assets.• Corporate Building Maintenance completed structural assessments on a number <strong>of</strong> <strong>City</strong> buildings toprioritize maintenance work in the near term.The work carried out in 2012 represents a large portion <strong>of</strong> the capital renewal requirements within the <strong>City</strong>.However, <strong>Guelph</strong> must use a broader approach to manage assets across the organization. This undertakingwill be carried out in co-ordination with the Corporate Technology Strategy and will focus on developing toolsrequired to move the Asset Management Plan forward.• Identify system requirements for the ongoing monitoring <strong>of</strong> assets• Model future costs associated with the maintenance and replacement• Develop metrics for use across all departments• Evaluate and prioritize maintenance and replacement needs within available funding levels<strong>City</strong> <strong>of</strong> <strong>Guelph</strong> – <strong>2013</strong>–2022 Tax-supported Capital <strong>Budget</strong> and Forecast304
<strong>2013</strong>–2022 Tax-supported Capital <strong>Budget</strong> and ForecastOperating Impact from CapitalAs part <strong>of</strong> good fiscal management, the <strong>City</strong> recognizes the need to enhance the connection between itsoperating and capital budgets by clearly defining the future operating impact <strong>of</strong> capital projects. The chartbelow indicates the operating impact and full time employees associated with capital projects:<strong>2013</strong> Tax-supported Capital <strong>Budget</strong> Operating Impact<strong>2013</strong> 2014 2015 2016 FTEsIT0024 IT Strategic Plan Implementation 500,000 249,800 95,300 7.0PK0002 <strong>Guelph</strong> Trails 56,000 0.5PK0014 Eastview Community Park 196,600 -6,000 100 -PL0029 Facility Energy Measures 245,000 2.0TC0026 CAD/AVL Replacement 100,000 -WC0011 Automated Waste Collection Carts 147,950RF0051 Victoria Road Recreation Centre Renovation 881,500SS0019 Baker St Redevelopment Ph 3 246,000SS0020 Baker St Redevelopment Ph 4 93,100$941,600 $737,750 $974,600 $151,400 9.5In <strong>2013</strong>, the <strong>City</strong> plans to develop a more robust reporting system to quantify future operating costs by costtype, including salaries and wages, one-time costs and any debt-servicing costs incurred as a result <strong>of</strong> a capitalproject.<strong>City</strong> <strong>of</strong> <strong>Guelph</strong> – <strong>2013</strong>–2022 Tax-supported Capital <strong>Budget</strong> and Forecast305
<strong>2013</strong>–2022 Tax-supported Capital <strong>Budget</strong> and ForecastRisk and PolicyThe capital financing guideline is developed assuming a combined five per cent levy and growth rate increase.Should actual levy growth be lower than five per cent there would be less funding available for debt servicingand funding reserve funds, and the 2014-22 forecast for 2014-2022 may need to be adjustedThe 10-year budget and forecast is developed based on assumed revenue collections for the <strong>City</strong>’sDevelopment Charge (DC) reserve funds. If these revenues do not materialize, the <strong>City</strong> would need to makeadjustments to the growth funded projects approved in previous, current and future budgets to account forlower revenues.Based on the current forecast, the <strong>City</strong> will be <strong>of</strong>fside on its Development Charges Debt Servicing ratiobeginning in 2015 for the Roads DC Reserve Fund. This ratio allows for debt servicing to account for amaximum <strong>of</strong> 20 per cent <strong>of</strong> the average revenue forecast identified in the development charges backgroundstudy for hard services. As the <strong>City</strong> is currently entering a new study that will determine a new DevelopmentCharge rate effective March 2, 2014, staff recommends this be monitored and adjusted as more informationcomes available through the DC Study.<strong>City</strong> <strong>of</strong> <strong>Guelph</strong> – <strong>2013</strong>–2022 Tax-supported Capital <strong>Budget</strong> and Forecast306
CITY OF GUELPH<strong>2013</strong> TAX SUPPORTED CAPITAL BUDGET2014 TO 2022 TAX SUPPORTED CAPITAL FORECASTRoadsRoads GrowthRD0078 VICTORIA - STONE-ARKELL1,800.0 250.0 2,050.0 180.0 1,008.0 862.0 862.0RD0118 TRANSPORT STRATEGY IMPLEMENT50.0 100.0 200.0 350.0 153.8 196.3 196.3RD0122 EASTVIEW - STARWOOD-WATSON1,200.0 200.0 1,400.0 400.0 463.4 536.6 536.6RD0265 GORDON- CLAIR TO MALTBY5,900.0 5,900.0 3,843.9 2,056.1 2,056.1RD0267 CLAIR/LAIRD & HANLON INTERCHANGE500.0 6,500.0 6,500.0 13,500.0 13,500.0RD0268 TRANSIT UPGRADES150.0 1,000.0 1,150.0 1,150.0 1,150.0RD0269 LAIRD: CLAIR TO SOUTHGATE1,500.0 1,000.0 500.0 3,000.0 2,475.0 525.0 525.0RD0270 YORK- VICTORIA TO EAST CITY LIMITS5,500.0 5,000.0 10,500.0 5,208.9 3,319.9 1,971.2 1,971.2RD0271 STONE- MOTICELLO TO VICTORIA400.0 3,600.0 300.0 4,300.0 290.0 2,484.3 1,525.7 1,525.7RD0272 VICTORIA- YORK TO STONE II350.0 3,300.0 300.0 3,950.0 2,488.5 1,461.5 1,461.5RD0273 SILVERCREEK PKWY/CN SEP500.0 2,750.0 2,750.0 6,000.0 3,000.0 1,863.8 1,136.3 1,136.3RD0274 INT SPEEDVALE & DELHI1,000.0 1,000.0 450.0 550.0 550.0RD0285 STARWOOD- WATSON TO GRANGE (SA)190.0 190.0 171.0 19.0 19.0RD0286 NISKA BRIDGE REPL200.0 1,750.0 250.0 2,200.0 1,357.5 842.5 842.5RD0308 ELMIRA: FIFE TO WR124 EXTENSION2,000.0 2,000.0 1,400.0 600.0 600.0RD0309 CITYVIEW100.0 125.0 225.0 187.5 37.5 37.5RD0310 GORDON: EDINBURGH TO LOWES150.0 750.0 900.0 567.0 333.0 333.0RD0312 INT COLLEGE & SCOTTSDALE1,600.0 1,600.0 720.0 880.0 880.0RD0313 INT SPEEDVALE & SILVERCREEK1,800.0 1,800.0 810.0 990.0 990.0RD0314 INT DOWNEY & LAIRD200.0 200.0 100.0 90.0 10.0 10.0TF0001 MID-BLOCK COLL NEW WATSON- TRAFFIC150.0 150.0 135.0 15.0 15.0Total Roads Growth 5,200.0 16,075.0 11,000.0 6,590.0 6,000.0 17,500.0 62,365.0 9,178.9 23,988.6 13,500.0 15,697.7 15,697.7Roads Non-GrowthGross Project Cost $(000's)Project Number & Description <strong>2013</strong> 2014 2015 2016 2017PL0040 SITE MONITORING & REMEDIATION50.0 100.0 50.0 75.0 775.0 1,050.0 1,050.0 1,050.0RB0002 SPEEDVALE AVE BRIDGE1,500.0 1,500.0 1,200.0 300.0 300.0RB0003 BRIDGE RECONSTRUCTION300.0 200.0 1,900.0 2,400.0 400.0 2,000.0 2,000.0RD0168 DOWNTOWN PUBLIC REALM1,000.0 5,700.0 6,700.0 800.0 5,900.0 5,900.0RD0276 PAVEMENT DEFICIT2,000.0 2,000.0 1,141.0 2,000.0 2,500.0 16,223.0 25,864.0 20,691.4 5,172.6 5,172.6RD0277 CIP ROAD UPGRADES1,000.0 1,000.0 1,000.0 750.0 1,000.0 5,000.0 9,750.0 7,550.0 2,200.0 2,200.0RD0278 WYNDHAM- CARDEN TO WOOLWICH400.0 300.0 700.0 700.0 700.0RD0280 MAJOR ROAD RECONSTRUCTION1,500.0 1,500.0 1,500.0 2,000.0 1,850.0 13,450.0 21,800.0 17,090.0 4,710.0 4,710.0RD0281 MINOR ROAD RECONSTRUCTION500.0 500.0 500.0 350.0 500.0 2,450.0 4,800.0 2,640.0 2,160.0 2,160.0RD0284 STRUCTURE REHABILITATION150.0 150.0 1,450.0 1,750.0 640.0 1,110.0 1,110.0SL0001 INFRA SUSTAIN- STREETLIGHTS 11300.0 300.0 300.0 300.0 300.0 2,100.0 3,600.0 1,200.0 2,400.0 2,400.0Total Roads Non-Growth 5,500.0 6,100.0 4,741.0 7,100.0 7,425.0 49,048.0 79,914.0 52,211.4 27,702.6 27,702.6Total Roads 10,700.0 22,175.0 15,741.0 13,690.0 13,425.0 66,548.0 142,279.0 52,211.4 9,178.9 23,988.6 13,500.0 43,400.3 43,400.3Next5 YearsTotalProjectCostGrants &SubsidiesFederalSources <strong>of</strong> External FinancingGas Tax Other DC'sDCDebtNet Costto <strong>City</strong>EquipmentReplacement<strong>City</strong>ReservesDebt307
CITY OF GUELPH2018 TO 2022 TAX SUPPORTED CAPITAL FORECAST DETAILSRoadsGross Project Cost $(000's)Sources <strong>of</strong> External FinancingTotalProject CostGrants &FederalDCNet CostEquipment<strong>City</strong>Roads GrowthProject Number & Description 2018 2019 2020 2021 2022(2018-2022)RD0118 TRANSPORT STRATEGY IMPLEMENT100.0 100.0 200.0 90.0 110.0 110.0RD0265 GORDON- CLAIR TO MALTBY500.0 5,000.0 400.0 5,900.0 3,843.9 2,056.1 2,056.1RD0268 TRANSIT UPGRADES1,000.0 1,000.0 1,000.0 1,000.0RD0270 YORK- VICTORIA TO EAST CITY LIMITS4,000.0 1,000.0 5,000.0 2,500.0 1,575.0 925.0 925.0RD0308 ELMIRA: FIFE TO WR124 EXTENSION2,000.0 2,000.0 1,400.0 600.0 600.0RD0312 INT COLLEGE & SCOTTSDALE1,600.0 1,600.0 720.0 880.0 880.0RD0313 INT SPEEDVALE & SILVERCREEK1,800.0 1,800.0 810.0 990.0 990.0SubsidiesGas Tax Other DC'sDebtto <strong>City</strong>ReplacementReservesDebtTotal Roads Growth 4,000.0 1,500.0 5,100.0 3,500.0 3,400.0 17,500.0 2,500.0 8,438.9 6,561.1 6,561.1Roads Non-GrowthPL0040 SITE MONITORING & REMEDIATION75.0 100.0 100.0 100.0 400.0 775.0 775.0 775.0RB0003 BRIDGE RECONSTRUCTION200.0 200.0 500.0 1,000.0 1,900.0 1,900.0 1,900.0RD0168 DOWNTOWN PUBLIC REALM900.0 900.0 900.0 1,000.0 2,000.0 5,700.0 5,700.0 5,700.0RD0276 PAVEMENT DEFICIT3,141.0 3,141.0 2,800.0 3,141.0 4,000.0 16,223.0 12,978.4 3,244.6 3,244.6RD0277 CIP ROAD UPGRADES1,000.0 1,000.0 1,000.0 1,000.0 1,000.0 5,000.0 3,750.0 1,250.0 1,250.0RD0280 MAJOR ROAD RECONSTRUCTION3,000.0 3,500.0 1,500.0 1,950.0 3,500.0 13,450.0 10,410.0 3,040.0 3,040.0RD0281 MINOR ROAD RECONSTRUCTION500.0 500.0 450.0 500.0 500.0 2,450.0 760.0 1,690.0 1,690.0RD0284 STRUCTURE REHABILITATION150.0 300.0 1,000.0 1,450.0 400.0 1,050.0 1,050.0SL0001 INFRA SUSTAIN- STREETLIGHTS 11500.0 500.0 300.0 300.0 500.0 2,100.0 2,100.0 2,100.0Total Roads Non-Growth 9,466.0 10,141.0 7,050.0 8,491.0 13,900.0 49,048.0 28,298.4 20,749.6 20,749.6Total Roads 13,466.0 11,641.0 12,150.0 11,991.0 17,300.0 66,548.0 28,298.4 2,500.0 8,438.9 27,310.7 27,310.7308
CITY OF GUELPH<strong>2013</strong> TAX SUPPORTED CAPITAL BUDGET2014 TO 2022 TAX SUPPORTED CAPITAL FORECASTStorm Water ManagementStorm Water GrowthSW0049 HANLON CREEK STORM200.0 200.0 180.0 20.0 20.0SW0061 WATERSHED STUDY UPDATES100.0 100.0 72.0 28.0 28.0SW0066 STORMWATER DRAINAGE OVERSIZING150.0 150.0 150.0 150.0 150.0 750.0 1,500.0 1,327.5 172.5 172.5SW0068 SERVICING STUDIES125.0 125.0 93.8 31.3 31.3Total Storm Water Growth 275.0 150.0 350.0 150.0 250.0 750.0 1,925.0 1,673.3 251.8 251.8Storm Water Non-GrowthGross Project Cost $(000's)Project Number & Description <strong>2013</strong> 2014 2015 2016 2017SW0051 SWM POND REHABILITATION250.0 350.0 350.0 1,200.0 2,150.0 480.0 1,670.0 1,670.0SW0056 CIP STORM SEWER REPL 2011750.0 750.0 750.0 250.0 1,000.0 4,500.0 8,000.0 6,175.0 1,825.0 1,825.0SW0057 STORM SEWER REPLACEMENT500.0 750.0 300.0 750.0 500.0 5,250.0 8,050.0 6,252.5 1,797.5 1,797.5SW0059 HANLON CREEK/MILL CREEK WATERSHED100.0 100.0 100.0 100.0SW0062 STORM SEWER RELINE/REPAIR500.0 800.0 1,300.0 400.0 900.0 900.0SW0063 STORM SYSTEM UPGRADES650.0 750.0 300.0 750.0 750.0 2,500.0 5,700.0 1,200.0 4,500.0 4,500.0SW0065 HOWITT CREEK SWM POND200.0 200.0 200.0 200.0SW0067 DOWNTOWN CIP975.0 975.0 975.0 975.0Total Storm Water Non-Growth 2,350.0 2,250.0 1,800.0 1,750.0 3,100.0 15,225.0 26,475.0 14,507.5 11,967.5 11,967.5Total Storm Water Management 2,625.0 2,400.0 2,150.0 1,900.0 3,350.0 15,975.0 28,400.0 14,507.5 1,673.3 12,219.3 12,219.3Next5 YearsTotalProjectCostGrants &SubsidiesFederalSources <strong>of</strong> External FinancingGas Tax Other DC'sDCDebtNet Costto <strong>City</strong>EquipmentReplacement<strong>City</strong>ReservesDebt309
CITY OF GUELPH2018 TO 2022 TAX SUPPORTED CAPITAL FORECAST DETAILSStorm Water ManagementGross Project Cost $(000's)Sources <strong>of</strong> External FinancingTotalProject CostGrants &FederalDCNet CostEquipment<strong>City</strong>Storm Water GrowthProject Number & Description 2018 2019 2020 2021 2022(2018-2022)SW0066 STORMWATER DRAINAGE OVERSIZING150.0 150.0 150.0 150.0 150.0 750.0 675.0 75.0 75.0SubsidiesGas Tax Other DC'sDebtto <strong>City</strong>ReplacementReservesDebtTotal Storm Water Growth 150.0 150.0 150.0 150.0 150.0 750.0 675.0 75.0 75.0Storm Water Non-GrowthSW0051 SWM POND REHABILITATION350.0 350.0 500.0 1,200.0 1,200.0 1,200.0SW0056 CIP STORM SEWER REPL 2011500.0 1,000.0 1,000.0 1,000.0 1,000.0 4,500.0 3,375.0 1,125.0 1,125.0SW0057 STORM SEWER REPLACEMENT500.0 750.0 1,000.0 1,000.0 2,000.0 5,250.0 4,012.5 1,237.5 1,237.5SW0062 STORM SEWER RELINE/REPAIR300.0 500.0 800.0 800.0 800.0SW0063 STORM SYSTEM UPGRADES1,000.0 250.0 250.0 1,000.0 2,500.0 2,500.0 2,500.0SW0067 DOWNTOWN CIP975.0 975.0 975.0 975.0Total Storm Water Non-Growth 1,300.0 3,100.0 2,750.0 2,600.0 5,475.0 15,225.0 7,387.5 7,837.5 7,837.5Total Storm Water Management 1,450.0 3,250.0 2,900.0 2,750.0 5,625.0 15,975.0 7,387.5 675.0 7,912.5 7,912.5310
CITY OF GUELPH<strong>2013</strong> TAX SUPPORTED CAPITAL BUDGET2014 TO 2022 TAX SUPPORTED CAPITAL FORECASTPolicy PlanningPolicy Planning GrowthPL0004 OFFICIAL PLAN REVIEW327.3 456.4 783.7 493.7 290.0 290.0PL0007 BROWNFIELDS INITIATIVES24.9 33.0 32.7 55.7 146.3 87.8 58.5 58.5PL0008 COMMUNITY IMPROVEMENT STUDIES97.9 79.3 87.0 264.2 23.8 240.4 240.4PL0012 HOUSING INITIATIVES31.1 46.3 45.8 123.2 55.4 67.8 67.8PL0014 URBAN DESIGN GUIDELINES43.5 40.6 39.7 78.5 231.8 434.1 195.3 238.8 238.8PL0017 YORK BUS.DIS./ORC LANDS STUDY37.3 46.4 66.1 149.8 33.7 116.0 116.0PL0020 ENVIRONMENTAL INITIATIVES24.9 17.4 42.8 85.1 19.1 66.0 66.0PL0021 ZONING BY-LAW REVIEW174.1 183.5 198.3 159.4 715.3 494.6 220.7 220.7PL0022 CLAIR/MALTBY COMMUNITY PLAN300.0 350.0 244.7 894.7 402.6 492.1 492.1PL0024 HERITAGE INITIATIVES37.3 46.4 85.6 26.4 32.7 162.9 391.3 50.2 341.1 341.1PL0036 MIXED USE NODES & CORRIDORS49.7 34.8 36.7 39.7 39.3 200.2 121.5 78.7 78.7Total Policy Planning Growth 548.7 709.7 691.2 528.8 556.3 1,153.2 4,187.9 1,977.7 2,210.1 2,210.1Policy Planning Non-GrowthGross Project Cost $(000's)Project Number & Description <strong>2013</strong> 2014 2015 2016 2017PL0039 WELLINGTON ST DAM EA120.0 120.0 120.0 120.0Total Policy Planning Non-Growth 120.0 120.0 120.0 120.0Total Policy Planning 548.7 709.7 691.2 648.8 556.3 1,153.2 4,307.9 1,977.7 2,330.1 2,330.1Next5 YearsTotalProjectCostGrants &SubsidiesFederalSources <strong>of</strong> External FinancingGas Tax Other DC'sDCDebtNet Costto <strong>City</strong>EquipmentReplacement<strong>City</strong>ReservesDebt311
CITY OF GUELPH2018 TO 2022 TAX SUPPORTED CAPITAL FORECAST DETAILSPolicy PlanningGross Project Cost $(000's)Sources <strong>of</strong> External FinancingTotalProject CostGrants &FederalDCNet CostEquipment<strong>City</strong>Policy Planning GrowthProject Number & Description 2018 2019 2020 2021 2022(2018-2022)PL0004 OFFICIAL PLAN REVIEW217.5 238.9 456.4 287.5 168.8 168.8PL0007 BROWNFIELDS INITIATIVES55.7 55.7 32.6 23.1 23.1PL0008 COMMUNITY IMPROVEMENT STUDIES87.0 87.0 7.8 79.2 79.2PL0014 URBAN DESIGN GUIDELINES147.8 36.2 47.8 231.8 104.3 127.5 127.5PL0021 ZONING BY-LAW REVIEW86.9 72.5 159.4 107.6 51.9 51.9PL0024 HERITAGE INITIATIVES86.9 36.2 39.8 162.9 19.8 143.1 143.1SubsidiesGas Tax Other DC'sDebtto <strong>City</strong>ReplacementReservesDebtTotal Policy Planning Growth 321.6 449.4 382.2 1,153.2 559.6 593.6 593.6Total Policy Planning 321.6 449.4 382.2 1,153.2 559.6 593.6 593.6312
CITY OF GUELPH<strong>2013</strong> TAX SUPPORTED CAPITAL BUDGET2014 TO 2022 TAX SUPPORTED CAPITAL FORECASTSolid Waste ResourcesSWR Non-GrowthGross Project Cost $(000's)Project Number & Description <strong>2013</strong> 2014 2015 2016 2017SC0017 EASTVIEW SANITARY SEWER UPGRADES100.0 750.0 350.0 1,200.0 600.0 450.0 150.0 150.0WC0001 AUTOMATED COLLECTIONS- CARTS1,200.0 1,200.0 1,200.0 1,200.0WC0002 TRANSFER STATION UPGRADES150.0 700.0 850.0 850.0 850.0WC0003 ADMIN BLDG RETROFIT2,225.0 2,225.0 2,225.0 2,225.0WC0004 VEHICLE STORAGE & MTCE BLDG600.0 600.0 600.0 600.0WC0005 NEW COLLECTION VEHICLE400.0 400.0 400.0 400.0WC0006 WRIC EQUIPMENT REPLACEMENT 11894.9 982.7 850.0 700.0 800.0 5,230.0 9,457.6 9,457.6 9,457.6WC0007 DOUBLE DESK FIBRE SCREEN950.0 950.0 950.0 950.0WC0010 AUTOMATE TRANSFER STATION SCALE80.0 80.0 80.0 80.0WC0011 AUTOMATED COLLECTIONS- TRUCKS939.2 939.2 150.0 53.1 736.1 736.1WM0040 HHW EXPANSION500.0 500.0 500.0 500.0WP0001 NEW PUBLIC DROP OFF FACILITY2,600.0 2,600.0 446.3 998.4 1,155.3 735.3 420.0WP0002 MATERIAL SHREDDER900.0 900.0 900.0 900.0WP0004 EASTVIEW METHANE COLLECTION SY100.0 100.0 200.0 200.0WR0001 MRF BUILDING UPGRADE200.0 3,000.0 3,200.0 3,200.0 3,200.0Next5 YearsTotal SWR Non-Growth 5,734.1 2,682.7 1,300.0 950.0 1,780.0 12,855.0 25,301.8 596.3 1,598.4 703.1 22,404.0 10,929.0 10,275.0 1,200.0Total Solid Waste Resources 5,734.1 2,682.7 1,300.0 950.0 1,780.0 12,855.0 25,301.8 596.3 1,598.4 703.1 22,404.0 10,929.0 10,275.0 1,200.0TotalProjectCostGrants &SubsidiesFederalSources <strong>of</strong> External FinancingGas Tax Other DC'sDCDebtNet Costto <strong>City</strong>EquipmentReplacement<strong>City</strong>ReservesDebt313
CITY OF GUELPH2018 TO 2022 TAX SUPPORTED CAPITAL FORECAST DETAILSSolid Waste ResourcesGross Project Cost $(000's)Sources <strong>of</strong> External FinancingTotalProject CostGrants &FederalDCNet CostEquipment<strong>City</strong>SWR Non-GrowthProject Number & Description 2018 2019 2020 2021 2022WC0003 ADMIN BLDG RETROFIT225.0 2,000.0 2,225.0 2,225.0 2,225.0WC0004 VEHICLE STORAGE & MTCE BLDG600.0 600.0 600.0 600.0WC0005 NEW COLLECTION VEHICLE400.0 400.0 400.0 400.0WC0006 WRIC EQUIPMENT REPLACEMENT 11816.0 1,323.0 801.0 1,290.0 1,000.0 5,230.0 5,230.0 5,230.0(2018-2022)WM0040 HHW EXPANSION500.0 500.0 500.0 500.0WP0002 MATERIAL SHREDDER900.0 900.0 900.0 900.0WR0001 MRF BUILDING UPGRADE3,000.0 3,000.0 3,000.0 3,000.0SubsidiesGas Tax Other DC'sDebtto <strong>City</strong>ReplacementReservesDebtTotal SWR Non-Growth 1,416.0 2,623.0 4,026.0 3,790.0 1,000.0 12,855.0 12,855.0 5,230.0 7,625.0Total Solid Waste Resources 1,416.0 2,623.0 4,026.0 3,790.0 1,000.0 12,855.0 12,855.0 5,230.0 7,625.0314
CITY OF GUELPH<strong>2013</strong> TAX SUPPORTED CAPITAL BUDGET2014 TO 2022 TAX SUPPORTED CAPITAL FORECASTFleet, Traffic & RoadwaysFleetGG0187 2011 FLEET VEH & EQUIP RPLCMNT3,082.1 2,579.6 1,700.0 2,290.5 3,998.2 19,406.1 33,056.5 33,056.5 33,056.5GG0188 DENVER STREET CLOSURE50.0 50.0 50.0 50.0GG0207 2-WAY RADIO UPGRADES250.0 250.0 250.0 250.0GG0208 MUNICIPAL ST BLDG EXPANSION1,350.0 1,350.0 1,215.0 135.0 135.0Total Fleet 3,382.1 2,579.6 1,700.0 2,290.5 5,348.2 19,406.1 34,706.5 1,215.0 33,491.5 33,056.5 435.0Traffic SignalsTF0002 NEW SIGNAL INSTALLATION 2011100.0 110.0 121.0 701.0 1,032.0 835.9 196.1 196.1TF0003 TRAFFIC SIGNAL EQUIP REPL 2011114.0 303.0 300.0 380.0 390.0 2,100.0 3,587.0 3,587.0 3,587.0TF0004 INTERSECTION- SIGNAL REBUILD95.0 252.5 140.0 200.0 300.0 1,950.0 2,937.5 2,937.5 2,937.5TF0005 SIGNALIZED CONTROL SYSTEM225.0 425.0 1,000.0 1,650.0 1,650.0 1,650.0TF0006 SIGNALIZED CONTROL SYSTEM/STUDY75.0 100.0 175.0 175.0 175.0TF0007 LED SIGNAL REPLACEMENT150.0 300.0 450.0 450.0 450.0TF0008 TRAFFIC MGMT INITIATIVES75.0 100.0 150.0 200.0 1,400.0 1,925.0 1,925.0 1,925.0TF0009 ACCESSIBLE PEDESTRIAN SIGNALS100.0 168.0 891.0 1,159.0 1,159.0 1,159.0TF0010 PEDESTRIAN COUNTDOWN HEADS100.0 135.0 235.0 235.0 235.0Total Traffic Signals 384.0 955.5 1,125.0 780.0 1,464.0 8,442.0 13,150.5 835.9 12,314.6 8,368.5 3,946.1Roadside OperationsGross Project Cost $(000's)Project Number & Description <strong>2013</strong> 2014 2015 2016 2017RD0293 SNOW DUMP CONSTRUCTION300.0 200.0 500.0 500.0 500.0RD0295 ROAD INFR SUSTAINABILITY300.0 600.0 900.0 900.0 900.0RD0306 SURFACE INFRASTRUCTURE SUSTAINABILITY280.0 200.0 480.0 180.0 300.0 300.0WN0001 WINTER CONTROL UPGRADE200.0 200.0 400.0 400.0 400.0Total Roadside Operations 280.0 500.0 300.0 1,200.0 2,280.0 180.0 2,100.0 2,100.0Total Fleet, Traffic & Roadways 4,046.1 4,035.1 2,825.0 3,370.5 6,812.2 29,048.1 50,137.0 180.0 2,050.9 47,906.1 41,425.0 6,481.1Next5 YearsTotalProjectCostGrants &SubsidiesFederalSources <strong>of</strong> External FinancingGas Tax Other DC'sDCDebtNet Costto <strong>City</strong>EquipmentReplacement<strong>City</strong>ReservesDebt315
CITY OF GUELPH2018 TO 2022 TAX SUPPORTED CAPITAL FORECAST DETAILSFleet, Traffic & RoadwaysGross Project Cost $(000's)Sources <strong>of</strong> External FinancingTotalProject CostGrants &FederalDCNet CostEquipment<strong>City</strong>FleetGG0187 2011 FLEET VEH & EQUIP RPLCMNT3,829.5 4,777.9 3,606.1 2,780.2 4,412.4 19,406.1 19,406.1 19,406.1Total Fleet 3,829.5 4,777.9 3,606.1 2,780.2 4,412.4 19,406.1 19,406.1 19,406.1Traffic SignalsProject Number & Description 2018 2019 2020 2021 2022(2018-2022)SubsidiesGas Tax Other DC'sDebtto <strong>City</strong>ReplacementReservesDebtTF0002 NEW SIGNAL INSTALLATION 2011127.0 133.0 140.0 147.0 154.0 701.0 567.8 133.2 133.2TF0003 TRAFFIC SIGNAL EQUIP REPL 2011400.0 410.0 420.0 430.0 440.0 2,100.0 2,100.0 2,100.0TF0004 INTERSECTION- SIGNAL REBUILD350.0 350.0 400.0 400.0 450.0 1,950.0 1,950.0 1,950.0TF0005 SIGNALIZED CONTROL SYSTEM500.0 500.0 1,000.0 1,000.0 1,000.0TF0006 SIGNALIZED CONTROL SYSTEM/STUDY100.0 100.0 100.0 100.0TF0007 LED SIGNAL REPLACEMENT150.0 150.0 300.0 300.0 300.0TF0008 TRAFFIC MGMT INITIATIVES350.0 350.0 300.0 400.0 1,400.0 1,400.0 1,400.0TF0009 ACCESSIBLE PEDESTRIAN SIGNALS171.0 175.0 178.0 182.0 185.0 891.0 891.0 891.0Total Traffic Signals 1,198.0 1,568.0 1,488.0 2,059.0 2,129.0 8,442.0 567.8 7,874.2 5,241.0 2,633.2Roadside OperationsRD0293 SNOW DUMP CONSTRUCTION200.0 200.0 200.0 200.0RD0295 ROAD INFR SUSTAINABILITY300.0 300.0 600.0 600.0 600.0RD0306 SURFACE INFRASTRUCTURE SUSTAINABIL200.0 200.0 200.0 200.0WN0001 WINTER CONTROL UPGRADE200.0 200.0 200.0 200.0Total Roadside Operations 200.0 700.0 300.0 1,200.0 1,200.0 1,200.0Total Fleet, Traffic & Roadways 5,027.5 6,345.9 5,294.1 5,539.2 6,841.4 29,048.1 567.8 28,480.3 24,647.1 3,833.2316
CITY OF GUELPH<strong>2013</strong> TAX SUPPORTED CAPITAL BUDGET2014 TO 2022 TAX SUPPORTED CAPITAL FORECASTForestryForestryGross Project Cost $(000's)Project Number & Description <strong>2013</strong> 2014 2015 2016 2017PO0009 TREE & SHRUB REPLACEMENT10.0 10.0 20.0 40.0 40.0 40.0PO0013 EMERALD ASH BORER STRATEGY100.0 400.0 400.0 400.0 500.0 2,500.0 4,300.0 4,300.0 4,300.0Total Forestry 110.0 410.0 420.0 400.0 500.0 2,500.0 4,340.0 4,340.0 4,340.0Total Forestry 110.0 410.0 420.0 400.0 500.0 2,500.0 4,340.0 4,340.0 4,340.0Next5 YearsTotalProjectCostGrants &SubsidiesFederalSources <strong>of</strong> External FinancingGas Tax Other DC'sDCDebtNet Costto <strong>City</strong>EquipmentReplacement<strong>City</strong>ReservesDebt317
CITY OF GUELPH2018 TO 2022 TAX SUPPORTED CAPITAL FORECAST DETAILSForestryGross Project Cost $(000's)Sources <strong>of</strong> External FinancingTotalProject CostGrants &FederalDCNet CostEquipment<strong>City</strong>ForestryProject Number & Description 2018 2019 2020 2021 2022(2018-2022)PO0013 EMERALD ASH BORER STRATEGY500.0 500.0 500.0 500.0 500.0 2,500.0 2,500.0 2,500.0SubsidiesGas Tax Other DC'sDebtto <strong>City</strong>ReplacementReservesDebtTotal Forestry 500.0 500.0 500.0 500.0 500.0 2,500.0 2,500.0 2,500.0Total Forestry 500.0 500.0 500.0 500.0 500.0 2,500.0 2,500.0 2,500.0318
CITY OF GUELPH<strong>2013</strong> TAX SUPPORTED CAPITAL BUDGET2014 TO 2022 TAX SUPPORTED CAPITAL FORECASTParkingParking Non-GrowthGross Project Cost $(000's)Project Number & Description <strong>2013</strong> 2014 2015 2016 2017PG0056 EAST PARKADE- STRUCTURAL REHAB600.0 600.0 1,200.0 1,200.0 1,200.0PG0057 WEST PARKADE- STRUCTURAL REHAB750.0 750.0 750.0 750.0PG0058 PARKADE ANNUAL STRUCTURAL REHA105.0 250.0 300.0 410.0 375.0 2,365.0 3,805.0 3,805.0 3,805.0PG0059 PARK YOURSELF UNITS- REPL180.0 400.0 580.0 580.0 580.0PG0060 PARKSMART AGREEMENT- REPL175.0 175.0 175.0 175.0PG0061 PARKING METER- REPL70.0 100.0 170.0 170.0 170.0PG0063 COMPUTER TICKET WRITERS40.0 40.0 80.0 80.0 80.0PG0064 WEST PARKADE ROOF DECK500.0 500.0 500.0 500.0PG0065 PARKING CONTROL HARDWARE150.0 100.0 200.0 450.0 450.0 450.0PG0066 PARKADE ELEVATOR REPL100.0 200.0 300.0 300.0 300.0PG0070 PARKING SIGN UPGRADES150.0 150.0 150.0 150.0Total Parking Non-Growth 430.0 950.0 1,230.0 1,010.0 635.0 3,905.0 8,160.0 8,160.0 8,160.0Total Parking 430.0 950.0 1,230.0 1,010.0 635.0 3,905.0 8,160.0 8,160.0 8,160.0Next5 YearsTotalProjectCostGrants &SubsidiesFederalSources <strong>of</strong> External FinancingGas Tax Other DC'sDCDebtNet Costto <strong>City</strong>EquipmentReplacement<strong>City</strong>ReservesDebt319
CITY OF GUELPH2018 TO 2022 TAX SUPPORTED CAPITAL FORECAST DETAILSParkingGross Project Cost $(000's)Sources <strong>of</strong> External FinancingTotalProject CostGrants &FederalDCNet CostEquipment<strong>City</strong>Parking Non-GrowthProject Number & Description 2018 2019 2020 2021 2022(2018-2022)PG0056 EAST PARKADE- STRUCTURAL REHAB600.0 600.0 600.0 600.0PG0058 PARKADE ANNUAL STRUCTURAL REHA245.0 665.0 420.0 435.0 600.0 2,365.0 2,365.0 2,365.0PG0059 PARK YOURSELF UNITS- REPL200.0 200.0 400.0 400.0 400.0PG0061 PARKING METER- REPL100.0 100.0 100.0 100.0PG0063 COMPUTER TICKET WRITERS40.0 40.0 40.0 40.0PG0065 PARKING CONTROL HARDWARE200.0 200.0 200.0 200.0PG0066 PARKADE ELEVATOR REPL200.0 200.0 200.0 200.0SubsidiesGas Tax Other DC'sDebtto <strong>City</strong>ReplacementReservesDebtTotal Parking Non-Growth 245.0 1,265.0 460.0 1,135.0 800.0 3,905.0 3,905.0 3,905.0Total Parking 245.0 1,265.0 460.0 1,135.0 800.0 3,905.0 3,905.0 3,905.0320
CITY OF GUELPH<strong>2013</strong> TAX SUPPORTED CAPITAL BUDGET2014 TO 2022 TAX SUPPORTED CAPITAL FORECASTTransitTransit GrowthTC0004 COIN EQUIPMENT30.0 37.0 67.0 13.6 53.4 53.4TC0006 SATELLITE LOCAL CLAIR/GORDON300.0 50.0 350.0 157.5 192.5 192.5TC0023 BASE SERVICE INCREASE- LAFARGE1,050.0 1,050.0 850.5 199.5 199.5TC0024 BASE SERVICE INCREASE- SOUTH END1,100.0 1,100.0 891.0 209.0 209.0TC0026 CAD/AVL REPLACEMENT500.0 500.0 202.5 297.5 297.5TC0028 FAREBOX UPGRADE250.0 506.0 756.0 153.1 602.9 602.9TC0041 BUS STOP ACCESS UPGRADE 201151.0 52.0 53.1 54.1 55.2 293.1 558.5 113.1 445.4 445.4TM0001 NEW MOBILITY VAN210.0 220.0 470.0 900.0 668.3 231.8 231.8TM0002 MOBILITY VAN205.0 215.0 420.0 311.9 108.1 108.1Total Transit Growth 1,006.0 798.0 568.1 1,154.1 1,375.2 800.1 5,701.5 3,361.5 2,340.1 2,340.1Transit Non-GrowthGross Project Cost $(000's)Project Number & Description <strong>2013</strong> 2014 2015 2016 2017TC0007 BUS STOP SIGNS50.0 50.0 50.0 50.0TC0008 TRANSIT VEH & EQUIP REPLACE1,519.0 2,107.3 1,800.0 1,950.0 2,208.1 13,532.8 23,117.2 268.0 22,849.2 22,849.2TC0010 EXISTING BUS STOP- UPGRADE30.6 31.2 31.8 30.0 33.1 142.2 298.9 30.6 268.3 268.3TC0018 TERMINAL IMPROVE AT SUB-NODES105.0 105.0 210.0 210.0 210.0TC0029 ADVANCED TRAVELLER INFO SYSTEM- IVR150.0 70.0 220.0 150.0 70.0 70.0TC0030 ADVANCED TRAVELLER INFO SYSTEM- WEB50.0 50.0 50.0 50.0TC0039 TERMINAL IT NETWORK300.0 300.0 300.0Total Transit Non-Growth 1,999.6 2,363.5 1,986.8 1,980.0 2,241.2 13,675.0 24,246.1 748.6 23,497.5 22,849.2 648.3Total Transit 3,005.6 3,161.5 2,554.9 3,134.1 3,616.4 14,475.1 29,947.6 748.6 3,361.5 25,837.6 22,849.2 2,988.4Next5 YearsTotalProjectCostGrants &SubsidiesFederalSources <strong>of</strong> External FinancingGas Tax Other DC'sDCDebtNet Costto <strong>City</strong>EquipmentReplacement<strong>City</strong>ReservesDebt321
CITY OF GUELPH2018 TO 2022 TAX SUPPORTED CAPITAL FORECAST DETAILSTransitGross Project Cost $(000's)Sources <strong>of</strong> External FinancingTotalProject CostGrants &FederalDCNet CostEquipment<strong>City</strong>Transit GrowthProject Number & Description 2018 2019 2020 2021 2022(2018-2022)TC0004 COIN EQUIPMENT37.0 37.0 7.5 29.5 29.5TC0041 BUS STOP ACCESS UPGRADE 201156.3 57.4 58.6 59.8 61.0 293.1 59.3 233.8 233.8TM0001 NEW MOBILITY VAN230.0 240.0 470.0 349.0 121.1 121.1SubsidiesGas Tax Other DC'sDebtto <strong>City</strong>ReplacementReservesDebtTotal Transit Growth 56.3 287.4 298.6 96.8 61.0 800.1 415.8 384.4 384.4Transit Non-GrowthTC0008 TRANSIT VEH & EQUIP REPLACE2,821.4 2,675.6 2,280.8 3,083.0 2,672.0 13,532.8 13,532.8 13,532.8TC0010 EXISTING BUS STOP- UPGRADE34.6 35.1 35.9 36.6 142.2 142.2 142.2Total Transit Non-Growth 2,821.4 2,710.2 2,315.9 3,118.9 2,708.6 13,675.0 13,675.0 13,532.8 142.2Total Transit 2,877.7 2,997.6 2,614.5 3,215.7 2,769.6 14,475.1 415.8 14,059.4 13,532.8 526.6322
CITY OF GUELPH<strong>2013</strong> TAX SUPPORTED CAPITAL BUDGET2014 TO 2022 TAX SUPPORTED CAPITAL FORECASTFire & Land AmbulanceFire & Land Ambulance Non-GrowthGross Project Cost $(000's)Project Number & Description <strong>2013</strong> 2014 2015 2016 2017AM0001 LAND AMBULANCE VEH 10404.4 550.0 420.9 519.8 437.7 2,669.5 5,002.3 2,001.0 3,001.3 3,001.3AM0002 LAND AMBULANCE EQUIP 1088.8 8.8 26.0 50.4 751.7 925.7 370.2 555.5 555.5FS0030 FIRE VEHICLE 111,302.5 444.3 1,386.0 134.0 86.8 2,638.6 5,992.2 1,675.8 4,316.4 4,316.4FS0031 FIRE EQUIP 11791.3 78.8 135.7 61.2 59.4 1,501.1 2,627.5 249.2 2,378.3 2,378.3FS0032 FIRE RADIO REPL 11174.4 69.0 70.4 71.8 649.9 1,035.5 1,035.5 1,035.5FS0045 RADIO INFRASTRUCTURE REPLACEMENT750.0 750.0 750.0 750.0FS0051 CONFINED SPACE35.0 35.0 35.0 35.0Total Fire & Land Ambulance Non-Growth 2,707.6 1,230.9 2,021.8 1,562.8 634.3 8,210.8 16,368.2 4,296.2 12,072.0 12,037.0 35.0Total Fire & Land Ambulance 2,707.6 1,230.9 2,021.8 1,562.8 634.3 8,210.8 16,368.2 4,296.2 12,072.0 12,037.0 35.0Next5 YearsTotalProjectCostGrants &SubsidiesFederalSources <strong>of</strong> External FinancingGas Tax Other DC'sDCDebtNet Costto <strong>City</strong>EquipmentReplacement<strong>City</strong>ReservesDebt323
CITY OF GUELPH2018 TO 2022 TAX SUPPORTED CAPITAL FORECAST DETAILSFire & Land AmbulanceGross Project Cost $(000's)Sources <strong>of</strong> External FinancingTotalProject CostGrants &FederalDCNet CostEquipment<strong>City</strong>Project Number & Description 2018 2019 2020 2021 2022Fire & Land Ambulance Non-GrowthAM0001 LAND AMBULANCE VEH 10540.6 607.2 464.7 574.0 483.0 2,669.5 1,067.8 1,601.7 1,601.7AM0002 LAND AMBULANCE EQUIP 10507.0 41.9 58.3 8.5 136.0 751.7 300.7 451.0 451.0FS0030 FIRE VEHICLE 111,125.9 77.4 789.7 159.6 486.0 2,638.6 855.0 1,783.6 1,783.6FS0031 FIRE EQUIP 111,093.1 81.2 125.3 67.5 134.0 1,501.1 128.6 1,372.5 1,372.5FS0032 FIRE RADIO REPL 11649.9 649.9 649.9 649.9Total Fire & Land Ambulance Non-Growth 3,266.6 807.7 2,087.9 809.6 1,239.0 8,210.8 2,352.1 5,858.7 5,858.7Total Fire & Land Ambulance 3,266.6 807.7 2,087.9 809.6 1,239.0 8,210.8 2,352.1 5,858.7 5,858.7(2018-2022)SubsidiesGas Tax Other DC'sDebtto <strong>City</strong>ReplacementReservesDebt324
CITY OF GUELPH<strong>2013</strong> TAX SUPPORTED CAPITAL BUDGET2014 TO 2022 TAX SUPPORTED CAPITAL FORECASTBy-Law & SecurityBy-Law & Security Non-GrowthGross Project Cost $(000's)Project Number & Description <strong>2013</strong> 2014 2015 2016 2017PG0071 SECURITY INFRA REPL202.0 150.0 195.0 200.0 1,439.0 2,186.0 2,186.0 2,186.0PG0072 LICENCE PLATE RECOGNITION 201577.0 84.7 161.7 161.7 161.7Total By-Law & Security Non-Growth 202.0 150.0 195.0 277.0 1,523.7 2,347.7 2,347.7 2,347.7Total By-Law & Security 202.0 150.0 195.0 277.0 1,523.7 2,347.7 2,347.7 2,347.7Next5 YearsTotalProjectCostGrants &SubsidiesFederalSources <strong>of</strong> External FinancingGas Tax Other DC'sDCDebtNet Costto <strong>City</strong>EquipmentReplacement<strong>City</strong>ReservesDebt325
CITY OF GUELPH2018 TO 2022 TAX SUPPORTED CAPITAL FORECAST DETAILSBy-Law & SecurityGross Project Cost $(000's)Sources <strong>of</strong> External FinancingTotalProject CostGrants &FederalDCNet CostEquipment<strong>City</strong>Project Number & Description 2018 2019 2020 2021 2022By-Law & Security Non-Growth(2018-2022)PG0071 SECURITY INFRA REPL300.0 350.0 350.0 239.0 200.0 1,439.0 1,439.0 1,439.0PG0072 LICENCE PLATE RECOGNITION 201584.7 84.7 84.7 84.7SubsidiesGas Tax Other DC'sDebtto <strong>City</strong>ReplacementReservesDebtTotal By-Law & Security Non-Growth 300.0 350.0 434.7 239.0 200.0 1,523.7 1,523.7 1,523.7Total By-Law & Security 300.0 350.0 434.7 239.0 200.0 1,523.7 1,523.7 1,523.7326
CITY OF GUELPH<strong>2013</strong> TAX SUPPORTED CAPITAL BUDGET2014 TO 2022 TAX SUPPORTED CAPITAL FORECASTParks, Recreation Programs & FacilitiesVRRCRF0041 VRRC- BUILDING SIGN15.0 15.0 15.0 15.0RF0044 VRRC- FITNESS EQUIP REPL25.0 25.0 25.0 25.0RF0046 VRRC- BULKHEADS110.0 110.0 110.0 110.0RF0051 VRRC EXPANSION/RENOVATION150.0 2,500.0 4,500.0 7,150.0 7,150.0 7,150.0Total VRRC 150.0 2,500.0 4,500.0 25.0 125.0 7,300.0 7,300.0 150.0 7,150.0CentennialRF0047 CENTENNIAL POOL- MEETING ROOMS10.0 10.0 10.0 10.0RF0059 CENTENNIAL ARENA RENO15.0 300.0 315.0 315.0 315.0Total Centennial 15.0 300.0 10.0 325.0 325.0 325.0ExhibitionRF0049 EXHIBITION ARENA- BUILDING SIGNS15.0 15.0 15.0 15.0RF0058 EXHIBITION- UPGRADE LOBBY20.0 20.0 20.0 20.0Total Exhibition 35.0 35.0 35.0 35.0WECCRF0024 WECC- AQUATIC CHAIR LIFT40.0 40.0 40.0 40.0RF0027 WECC- SAND FILTER CONVERSION50.0 50.0 50.0 50.0RF0062 WECC FITNESS ROOM EQUIP60.0 60.0 60.0 60.0RF0070 WECC EXTERIOR FACILITY SIGNAGE15.0 15.0 15.0 15.0Total WECC 40.0 75.0 50.0 165.0 165.0 165.0LyonsRF0037 LYONS- WALL REMOVAL10.0 10.0 10.0 10.0RF0038 LYONS- BUILDING SIGN15.0 15.0 15.0 15.0Total Lyons 10.0 15.0 25.0 25.0 25.0South EndRP0290 SOUTH END COMMUNITY CENTRE500.0 500.0 367.6 132.4 132.4Total South End 500.0 500.0 367.6 132.4 132.4Parks Planning GrowthGross Project Cost $(000's)Project Number & Description <strong>2013</strong> 2014 2015 2016 2017PK0001 SOUTH END COMMUNITY PARK300.0 650.0 950.0 769.5 180.5 180.5PK0002 GUELPH TRAILS775.0 800.0 550.0 5,400.0 7,525.0 6,095.3 1,429.8 1,429.8PK0004 KORTRIGHT EAST COMMUNITY PARK75.0 550.0 625.0 506.3 118.8 118.8PK0007 VICTORIA RD NORTHVIEW75.0 450.0 525.0 425.3 99.8 99.8PK0014 EASTVIEW COMMUNITY PARK300.0 1,650.0 4,000.0 5,950.0 4,819.5 1,130.5 1,130.5PK0016 PERGOLA PROPERTY200.0 200.0 162.0 38.0 38.0PK0021 GRANGEHILL PHASE 5300.0 300.0 243.0 57.0 57.0PK0026 HOWITT PARK500.0 500.0 405.0 95.0 95.0PK0030 CITYVIEW HEIGHTS PARKETTE50.0 250.0 300.0 243.0 57.0 57.0PK0034 KORTRIGHT NEIGHBOURHOOD PARK50.0 300.0 350.0 283.5 66.5 66.5PK0036 CITYVIEW DRIVE PARK100.0 100.0 81.0 19.0 19.0PK0037 KORTRIGHT SPORTS COMPLEX2,000.0 2,000.0 1,620.0 380.0 380.0PK0038 GRANGEHILL PHASE 750.0 50.0 40.5 9.5 9.5PK0039 IMICO PROPERTY PARK550.0 550.0 445.5 104.5 104.5PK0040 PETER MISERSKY100.0 100.0 81.0 19.0 19.0PK0042 YORK OPEN SPACE DEVELOPMENT600.0 600.0 486.0 114.0 114.0PK0043 EASTVIEW OPEN SPACE500.0 500.0 405.0 95.0 95.0PK0045 VALLEY ROAD PARK600.0 600.0 486.0 114.0 114.0PK0047 MITCHELL FARM50.0 200.0 250.0 202.5 47.5 47.5PK0048 CITYWIDE SKATEPARK FACILITY100.0 600.0 700.0 567.0 133.0 133.0PK0049 270 GRANGE ROAD - NEW PARKETTE100.0 100.0 81.0 19.0 19.0Next5 YearsTotalProjectCostGrants &SubsidiesFederalSources <strong>of</strong> External FinancingGas Tax Other DC'sDCDebtNet Costto <strong>City</strong>EquipmentReplacement<strong>City</strong>ReservesDebt327
CITY OF GUELPH<strong>2013</strong> TAX SUPPORTED CAPITAL BUDGET2014 TO 2022 TAX SUPPORTED CAPITAL FORECASTParks, Recreation Programs & FacilitiesPK0050 YORK DISTRICT COMMUNITY PARK1,000.0 1,000.0 810.0 190.0 190.0PK0051 VICTORIA ROAD N COMMUNITY PARK1,650.0 1,650.0 1,336.5 313.5 313.5PK0057 ORIN REID PARK - PHASE 2400.0 500.0 900.0 729.0 171.0 171.0PK0060 WOODS SUB PH 1 PARK600.0 600.0 486.0 114.0 114.0PK0061 WOODS SUB PH 2 PARK600.0 600.0 486.0 114.0 114.0PK0062 LEASH FREE ZONES POLICY REVIEW50.0 50.0 40.5 9.5 9.5PK0063 PROPERTY DEMARCATION POICY REVIEW50.0 50.0 40.5 9.5 9.5PK0064 NATURALIZATION POLICY REVIEW50.0 50.0 40.5 9.5 9.5PK0068 EAST NODE NEIGHBOURHOOD PARK600.0 600.0 486.0 114.0 114.0Total Parks Planning Growth 1,150.0 1,525.0 1,500.0 1,700.0 2,350.0 20,050.0 28,275.0 22,902.9 5,372.4 5,372.4Parks Planning Non-GrowthPK0005 SUNNY ACRES200.0 200.0 200.0 200.0PK0008 BULLFROG PARK NEW BASKETBALL50.0 50.0 50.0 50.0PK0009 HUGH GUTHERIE PARK REDEVELOPMENT310.0 310.0 310.0 310.0PK0010 KIMBERLEY PARK BASKETBALL50.0 50.0 50.0 50.0PK0012 DAKOTA PARK REDEVELOPMENT300.0 300.0 300.0 300.0PK0022 GUELPH TRAIL UPGRADES100.0 110.0 1,400.0 1,610.0 1,610.0 1,610.0PK0023 LYON PARK300.0 300.0 300.0 300.0PK0024 SKOV PARK BASKETBALL50.0 50.0 50.0 50.0PK0025 NORM JARY PARK850.0 850.0 850.0 850.0PK0027 EXHIBITION PARK100.0 1,000.0 1,100.0 1,100.0 1,100.0PK0028 MARGARET GREENE500.0 500.0 500.0 500.0PK0031 ST GEORGE'S PARK REDEVELOPMENT400.0 400.0 400.0 400.0PK0032 WINDSOR PARK REDEVELOPMENT50.0 400.0 450.0 450.0 450.0PK0033 PARKS EQPMT REPL 2011-2020170.4 238.7 447.0 408.2 376.0 2,154.3 3,794.6 3,794.6 3,794.6PK0052 ROYAL CITY ICE RINK40.0 40.0 40.0 40.0PK0053 COLONIAL DRIVE ICE RINK40.0 40.0 40.0 40.0PK0056 GOLDIE MILL PARK IMPROVEMENTS100.0 100.0 100.0 100.0PK0058 GYMC PARKING LOT EXPANSION50.0 50.0 50.0 50.0PK0065 ROYAL JAYCESS PARK REDEV150.0 150.0 150.0 150.0PK0066 RIVERSIDE PARK MASTERPLAN150.0 150.0 150.0 150.0PK0067 NEW PARK WASHROOMS600.0 600.0 600.0 600.0Total Parks Planning Non-Growth 170.4 238.7 547.0 898.2 1,696.0 7,544.3 11,094.6 11,094.6 3,794.6 7,300.0Parks OperationsGross Project Cost $(000's)Project Number & Description <strong>2013</strong> 2014 2015 2016 2017PO0006 PARKS IRRIGATION25.0 25.0 70.0 105.0 60.0 320.0 605.0 25.0 580.0 580.0PO0007 PARKS INFRASTRUCTURE175.0 300.0 250.0 260.0 500.0 2,700.0 4,185.0 4,185.0 4,185.0PO0008 TREES FOR GUELPH GREENING25.0 25.0 25.0 25.0 30.0 165.0 295.0 295.0 295.0PO0014 PARKS EQUIPMENT GROWTH304.0 92.0 90.0 193.0 168.0 846.0 1,693.0 1,230.6 462.3 462.3PO0017 SPORTS FIELD RENOVATIONS50.0 120.0 600.0 770.0 770.0 770.0Total Parks Operations 579.0 442.0 435.0 583.0 878.0 4,631.0 7,548.0 25.0 1,230.6 6,292.3 6,292.3Next5 YearsTotal Parks, Recreation Programs & Facilities 2,589.4 4,705.7 6,982.0 3,221.2 5,309.0 32,460.3 55,267.6 25.0 24,501.1 30,741.7 3,794.6 19,797.1 7,150.0TotalProjectCostGrants &SubsidiesFederalSources <strong>of</strong> External FinancingGas Tax Other DC'sDCDebtNet Costto <strong>City</strong>EquipmentReplacement<strong>City</strong>ReservesDebt328
CITY OF GUELPH2018 TO 2022 TAX SUPPORTED CAPITAL FORECAST DETAILSParks, Recreation Programs & FacilitiesGross Project Cost $(000's)Sources <strong>of</strong> External FinancingTotalProject CostGrants &FederalDCNet CostEquipment<strong>City</strong>VRRCProject Number & Description 2018 2019 2020 2021 2022(2018-2022)RF0041 VRRC- BUILDING SIGN15.0 15.0 15.0 15.0RF0046 VRRC- BULKHEADS110.0 110.0 110.0 110.0SubsidiesGas Tax Other DC'sDebtto <strong>City</strong>ReplacementReservesDebtTotal VRRC 15.0 110.0 125.0 125.0 125.0CentennialRF0047 CENTENNIAL POOL- MEETING ROOMS10.0 10.0 10.0 10.0Total Centennial 10.0 10.0 10.0 10.0ExhibitionRF0049 EXHIBITION ARENA- BUILDING SIGNS15.0 15.0 15.0 15.0RF0058 EXHIBITION- UPGRADE LOBBY20.0 20.0 20.0 20.0Total Exhibition 35.0 35.0 35.0 35.0WECCRF0027 WECC- SAND FILTER CONVERSION50.0 50.0 50.0 50.0Total WECC 50.0 50.0 50.0 50.0LyonsRF0038 LYONS- BUILDING SIGN15.0 15.0 15.0 15.0Total Lyons 15.0 15.0 15.0 15.0Parks Planning GrowthPK0001 SOUTH END COMMUNITY PARK650.0 650.0 526.5 123.5 123.5PK0002 GUELPH TRAILS1,400.0 1,500.0 2,500.0 5,400.0 4,374.0 1,026.0 1,026.0PK0014 EASTVIEW COMMUNITY PARK2,000.0 2,000.0 4,000.0 3,240.0 760.0 760.0PK0016 PERGOLA PROPERTY200.0 200.0 162.0 38.0 38.0PK0021 GRANGEHILL PHASE 5300.0 300.0 243.0 57.0 57.0PK0026 HOWITT PARK500.0 500.0 405.0 95.0 95.0PK0036 CITYVIEW DRIVE PARK100.0 100.0 81.0 19.0 19.0PK0037 KORTRIGHT SPORTS COMPLEX1,000.0 1,000.0 2,000.0 1,620.0 380.0 380.0PK0039 IMICO PROPERTY PARK100.0 450.0 550.0 445.5 104.5 104.5PK0042 YORK OPEN SPACE DEVELOPMENT600.0 600.0 486.0 114.0 114.0PK0043 EASTVIEW OPEN SPACE500.0 500.0 405.0 95.0 95.0PK0045 VALLEY ROAD PARK600.0 600.0 486.0 114.0 114.0PK0049 270 GRANGE ROAD - NEW PARKETTE100.0 100.0 81.0 19.0 19.0PK0050 YORK DISTRICT COMMUNITY PARK1,000.0 1,000.0 810.0 190.0 190.0PK0051 VICTORIA ROAD N COMMUNITY PARK150.0 1,000.0 500.0 1,650.0 1,336.5 313.5 313.5PK0060 WOODS SUB PH 1 PARK600.0 600.0 486.0 114.0 114.0PK0061 WOODS SUB PH 2 PARK600.0 600.0 486.0 114.0 114.0PK0063 PROPERTY DEMARCATION POICY REVIEW 50.0 50.0 40.5 9.5 9.5PK0064 NATURALIZATION POLICY REVIEW50.0 50.0 40.5 9.5 9.5PK0068 EAST NODE NEIGHBOURHOOD PARK600.0 600.0 486.0 114.0 114.0Total Parks Planning Growth 2,750.0 3,850.0 2,450.0 6,100.0 4,900.0 20,050.0 16,240.5 3,809.5 3,809.5Parks Planning Non-GrowthPK0022 GUELPH TRAIL UPGRADES250.0 400.0 150.0 600.0 1,400.0 1,400.0 1,400.0PK0023 LYON PARK300.0 300.0 300.0 300.0PK0025 NORM JARY PARK100.0 400.0 350.0 850.0 850.0 850.0PK0027 EXHIBITION PARK1,000.0 1,000.0 1,000.0 1,000.0329
CITY OF GUELPH2018 TO 2022 TAX SUPPORTED CAPITAL FORECAST DETAILSParks, Recreation Programs & FacilitiesGross Project Cost $(000's)Sources <strong>of</strong> External FinancingTotalProject CostGrants &FederalDCNet CostEquipment<strong>City</strong>Project Number & Description 2018 2019 2020 2021 2022PK0028 MARGARET GREENE500.0 500.0 500.0 500.0PK0031 ST GEORGE'S PARK REDEVELOPMENT400.0 400.0 400.0 400.0PK0033 PARKS EQPMT REPL 2011-2020457.1 413.0 354.2 285.3 644.7 2,154.3 2,154.3 2,154.3(2018-2022)PK0052 ROYAL CITY ICE RINK40.0 40.0 40.0 40.0PK0065 ROYAL JAYCESS PARK REDEV150.0 150.0 150.0 150.0PK0066 RIVERSIDE PARK MASTERPLAN150.0 150.0 150.0 150.0PK0067 NEW PARK WASHROOMS300.0 300.0 600.0 600.0 600.0SubsidiesGas Tax Other DC'sDebtto <strong>City</strong>ReplacementReservesDebtTotal Parks Planning Non-Growth 1,597.1 1,363.0 2,104.2 1,235.3 1,244.7 7,544.3 7,544.3 2,154.3 5,390.0Parks OperationsPO0006 PARKS IRRIGATION125.0 65.0 65.0 65.0 320.0 320.0 320.0PO0007 PARKS INFRASTRUCTURE500.0 450.0 550.0 600.0 600.0 2,700.0 2,700.0 2,700.0PO0008 TREES FOR GUELPH GREENING30.0 30.0 30.0 35.0 40.0 165.0 165.0 165.0PO0014 PARKS EQUIPMENT GROWTH112.0 55.0 105.0 324.0 250.0 846.0 616.7 229.2 229.2PO0017 SPORTS FIELD RENOVATIONS150.0 150.0 150.0 150.0 600.0 600.0 600.0Total Parks Operations 642.0 810.0 900.0 1,174.0 1,105.0 4,631.0 616.7 4,014.2 4,014.2Total Parks, Recreation Programs & Facilities 5,104.1 6,133.0 5,464.2 8,509.3 7,249.7 32,460.3 16,857.2 15,603.0 2,154.3 13,448.7330
CITY OF GUELPH<strong>2013</strong> TAX SUPPORTED CAPITAL BUDGET2014 TO 2022 TAX SUPPORTED CAPITAL FORECASTArts, Culture & EntertainmentMuseumMU0013 MCCRAE COACH HOUSE RENOS20.0 20.0 20.0 20.0MU0015 MCCRAE HOUSE MAIN GALLERY RENOS30.0 30.0 30.0 30.0MU0017 CIVIC MUSEUM PH 2 EXTERIOR250.0 250.0 250.0Total Museum 280.0 20.0 300.0 250.0 50.0 50.0River RunGG0225 PUBLIC ART200.0 200.0 200.0 200.0RR0101 FRONT OF HOUSE10.0 100.0 25.0 373.0 508.0 508.0 508.0RR0102 BOX OFFICE / OTHER60.0 60.0 60.0 60.0RR0103 TECHNICAL / THEATRE48.0 75.0 65.0 45.0 1,108.0 1,341.0 1,341.0 1,341.0Total River Run 258.0 75.0 165.0 105.0 25.0 1,481.0 2,109.0 2,109.0 2,109.0Sleeman CentreGross Project Cost $(000's)Project Number & Description <strong>2013</strong> 2014 2015 2016 2017RF0028 SLEEMAN- REPL CONSESSION EQUIP25.0 30.0 55.0 55.0 55.0RF0029 SLEMMAN- SEATING UPGRADE25.0 30.0 55.0 55.0 55.0RF0030 SLEEMAN- REPL RINK MESH & WINCH45.0 45.0 45.0 45.0RF0031 SLEEMAN- SECURITY GATES25.0 25.0 25.0 25.0RF0033 SLEEMAN- VIDEO SCORE CLOCK REPL450.0 450.0 450.0 450.0RF0052 SLEEMAN SPONSORSHIP PROJECT60.0 65.0 70.0 70.0 70.0 144.0 479.0 479.0 479.0RF0063 SLEEMAN FRIDGES/FREEZERS20.0 20.0 20.0 20.0RF0064 SLEEMAN VENDING MACHINES20.0 20.0 20.0 20.0RF0078 Sleeman - Audio replacement95.0 95.0 95.0 95.0RF0079 Sleeman - POS System Replacement125.0 125.0 125.0 125.0Total Sleeman Centre 85.0 110.0 95.0 95.0 70.0 914.0 1,369.0 1,369.0 1,369.0Total Arts, Culture & Entertainment 343.0 465.0 260.0 200.0 95.0 2,415.0 3,778.0 250.0 3,528.0 3,528.0Next5 YearsTotalProjectCostGrants &SubsidiesFederalSources <strong>of</strong> External FinancingGas Tax Other DC'sDCDebtNet Costto <strong>City</strong>EquipmentReplacement<strong>City</strong>ReservesDebt331
CITY OF GUELPH2018 TO 2022 TAX SUPPORTED CAPITAL FORECAST DETAILSArts, Culture & EntertainmentGross Project Cost $(000's)Sources <strong>of</strong> External FinancingTotalProject CostGrants &FederalDCNet CostEquipment<strong>City</strong>MuseumProject Number & Description 2018 2019 2020 2021 2022(2018-2022)MU0013 MCCRAE COACH HOUSE RENOS20.0 20.0 20.0 20.0SubsidiesGas Tax Other DC'sDebtto <strong>City</strong>ReplacementReservesDebtTotal Museum 20.0 20.0 20.0 20.0River RunRR0101 FRONT OF HOUSE288.0 85.0 373.0 373.0 373.0RR0103 TECHNICAL / THEATRE200.0 425.0 125.0 283.0 75.0 1,108.0 1,108.0 1,108.0Total River Run 200.0 425.0 125.0 571.0 160.0 1,481.0 1,481.0 1,481.0Sleeman CentreRF0028 SLEEMAN- REPL CONSESSION EQUIP30.0 30.0 30.0 30.0RF0029 SLEMMAN- SEATING UPGRADE30.0 30.0 30.0 30.0RF0033 SLEEMAN- VIDEO SCORE CLOCK REPL450.0 450.0 450.0 450.0RF0052 SLEEMAN SPONSORSHIP PROJECT70.0 74.0 144.0 144.0 144.0RF0063 SLEEMAN FRIDGES/FREEZERS20.0 20.0 20.0 20.0RF0064 SLEEMAN VENDING MACHINES20.0 20.0 20.0 20.0RF0078 Sleeman - Audio replacement95.0 95.0 95.0 95.0RF0079 Sleeman - POS System Replacement125.0 125.0 125.0 125.0Total Sleeman Centre 90.0 74.0 510.0 20.0 220.0 914.0 914.0 914.0Total Arts, Culture & Entertainment 310.0 499.0 635.0 591.0 380.0 2,415.0 2,415.0 2,415.0332
CITY OF GUELPH<strong>2013</strong> TAX SUPPORTED CAPITAL BUDGET2014 TO 2022 TAX SUPPORTED CAPITAL FORECASTCommunity EngagementEvergreen Senior's CentreAS0004 EVERGREEN- INTERIOR BLINDS30.0 30.0 30.0 30.0Total Evergreen Senior's Centre 30.0 30.0 30.0 30.0Community RoomsGross Project Cost $(000's)Project Number & Description <strong>2013</strong> 2014 2015 2016 2017CD0001 COMMUNITY ROOMS FUTURE CENTRES276.0 275.0 551.0 446.3 104.7 104.7CD0002 TWO RIVERS COMMUNITY ROOMS276.0 276.0 223.6 52.4 52.4Total Community Rooms 276.0 276.0 275.0 827.0 669.9 157.1 157.1Total Community Engagement 276.0 276.0 305.0 857.0 669.9 187.1 187.1Next5 YearsTotalProjectCostGrants &SubsidiesFederalSources <strong>of</strong> External FinancingGas Tax Other DC'sDCDebtNet Costto <strong>City</strong>EquipmentReplacement<strong>City</strong>ReservesDebt333
CITY OF GUELPH2018 TO 2022 TAX SUPPORTED CAPITAL FORECAST DETAILSCommunity EngagementGross Project Cost $(000's)Sources <strong>of</strong> External FinancingTotalProject CostGrants &FederalDCNet CostEquipment<strong>City</strong>Project Number & Description 2018 2019 2020 2021 2022Evergreen Senior's Centre(2018-2022)AS0004 EVERGREEN- INTERIOR BLINDS30.0 30.0 30.0 30.0SubsidiesGas Tax Other DC'sDebtto <strong>City</strong>ReplacementReservesDebtTotal Evergreen Senior's Centre 30.0 30.0 30.0 30.0Community RoomsCD0001 COMMUNITY ROOMS FUTURE CENTRES275.0 275.0 222.8 52.3 52.3Total Community Rooms 275.0 275.0 222.8 52.3 52.3Total Community Engagement 30.0 275.0 305.0 222.8 82.3 82.3334
CITY OF GUELPH<strong>2013</strong> TAX SUPPORTED CAPITAL BUDGET2014 TO 2022 TAX SUPPORTED CAPITAL FORECASTCorporate Building (Capital) MaintenanceLife CycleAS0006 LIFE CYCLE-EVERGREEN39.0 50.0 300.0 115.0 120.0 624.0 624.0 624.0FS0036 LIFE CYCLE - FIRE HALL HQ 201160.0 130.0 50.0 68.5 308.5 308.5 308.5FS0037 LIFE CYCLE - FIRE HALL 27.5 36.0 43.5 43.5 43.5FS0038 LIFE CYCLE- FIRE HALL 357.0 220.0 35.0 23.0 12.0 45.0 392.0 392.0 392.0FS0039 LIFE CYCLE- FIRE HALL 440.0 20.0 15.0 75.0 75.0 75.0FS0040 LIFE CYCLE- FIRE HALL 512.0 109.5 121.5 121.5 121.5FS0046 LIFE CYCLE FIRE HALL 645.0 61.0 106.0 106.0 106.0GG0156 LIFE CYCLE- CITY HALL70.0 14.0 84.0 84.0 84.0GG0157 LIFE CYCLE - CITY HALL ANNEX35.0 35.0 70.0 70.0 70.0GG0160 LIFE CYCLE- RCP LAWN BOWLING450.0 450.0 450.0 450.0GG0166 LIFE CYCLE- EASTVIEW336.0 80.0 416.0 416.0 416.0GG0209 LEASOR/LEASEE PROPERTIES40.0 45.0 65.0 150.0 150.0 150.0GG0210 HERITAGE/VACANT PROPERTIES50.0 55.0 10.0 115.0 115.0 115.0GG0222 LIFE CYCLE OPERATIONS <strong>2013</strong>326.0 98.0 55.5 72.5 250.0 1,278.0 2,080.0 2,080.0 2,080.0GG0226 LIFE CYCLE - MUNICIPAL ANNEX50.0 200.0 25.0 275.0 275.0 275.0LB0023 LIFE CYCLE - LIBRARY 201160.0 200.0 10.5 44.0 286.0 600.5 600.5 600.5MU0008 LIFE CYCLE- MCCRAE HOUSE17.0 8.0 29.0 54.0 54.0 54.0PL0041 LIFE CYCLE - FARMER'S MARKET170.0 5.0 55.0 230.0 230.0 230.0PO0001 LIFE CYCLE- RIVERSIDE 201123.0 165.0 101.0 25.0 45.0 359.0 359.0 359.0PO0002 LIFE CYCLE- PARK BUILDINGS215.0 140.0 250.0 170.0 200.0 615.0 1,590.0 1,590.0 1,590.0RF0002 LIFE CYCLE - CENTENNIAL102.0 40.0 130.0 38.0 1,030.0 463.0 1,803.0 1,803.0 1,803.0RF0003 LIFE CYCLE - VRRC50.0 435.0 485.0 485.0 485.0RF0006 LIFE CYCLE - CENTENNIAL POOL162.0 1.4 100.0 263.4 263.4 263.4RF0007 LIFE CYCLE - EXHIBITION 2011308.0 62.0 205.5 193.0 42.0 357.5 1,168.0 1,168.0 1,168.0RF0008 LIFE CYCLE - SLEEMAN235.0 252.0 170.0 185.0 52.0 1,425.0 2,319.0 2,319.0 2,319.0RF0054 LIFE CYCLE - WECC 2011340.0 388.0 15.0 295.0 20.0 1,740.0 2,798.0 2,798.0 2,798.0RF0076 LC LYONS POOL 2014130.0 15.0 45.0 58.0 248.0 248.0 248.0RR0060 LIFE CYCLE - RIVER RUN45.0 65.0 150.0 65.0 300.0 310.0 935.0 935.0 935.0TC0002 LIFE CYCLE- TRANSIT FACILITY40.0 40.5 500.0 580.5 580.5 580.5TC0003 LIFE CYCLE- TRANSIT TERMINAL54.0 54.0 54.0 54.0WC0012 LIFE CYCLE WET/DRY ADMIN400.0 400.0 400.0 400.0Total Life Cycle 2,210.0 1,577.0 1,541.0 2,251.5 2,902.9 8,715.5 19,197.9 19,197.9 19,197.9StructuralGG0179 STRUCTURAL REP MED RISK BLDG200.0 50.0 250.0 250.0 250.0GG0211 LOW RISK ASSESSMENTS100.0 215.0 100.0 415.0 415.0 415.0GG0212 LOW RISK REPAIRS200.0 100.0 100.0 400.0 400.0 400.0GG0213 STRUCTURAL ASSESSMENTS50.0 100.0 100.0 100.0 350.0 350.0 350.0GG0215 BLDG CONDITION ASSESSMENT50.0 75.0 75.0 200.0 400.0 400.0 400.0PO0004 SOUTH END PARK REBUILD500.0 500.0 500.0 500.0Total Structural 800.0 515.0 250.0 275.0 175.0 300.0 2,315.0 2,315.0 2,315.0AccessibilityGross Project Cost $(000's)Project Number & Description <strong>2013</strong> 2014 2015 2016 2017AS0002 EVERGREEN ACCESSIBILITY50.0 50.0 50.0 50.0GG0180 ACCESSIBILITY IMPROVEMENTS100.0 100.0 200.0 200.0 1,000.0 1,600.0 1,600.0 1,600.0GG0181 GUELPH LAKE ACCESSIBILITY50.0 50.0 50.0 50.0LB0025 LIBRARY BULLFROG ACCESSIBILITY50.0 50.0 50.0 50.0RF0009 WERC ACCESSIBILITY40.0 40.0 40.0 40.0RF0010 LYONS PARK C.R. ACCESSIBILITY52.0 52.0 52.0 52.0Next5 YearsTotalProjectCostGrants &SubsidiesFederalSources <strong>of</strong> External FinancingGas Tax Other DC'sDCDebtNet Costto <strong>City</strong>EquipmentReplacement<strong>City</strong>ReservesDebt335
CITY OF GUELPH<strong>2013</strong> TAX SUPPORTED CAPITAL BUDGET2014 TO 2022 TAX SUPPORTED CAPITAL FORECASTCorporate Building (Capital) MaintenanceRF0014 CENTENNIAL ARENA ACCESSIBILITY50.0 50.0 50.0 50.0Total Accessibility 142.0 200.0 150.0 200.0 200.0 1,000.0 1,892.0 1,892.0 1,892.0<strong>City</strong> HallGross Project Cost $(000's)Project Number & Description <strong>2013</strong> 2014 2015 2016 2017GG0163 ENERGY CONSERVATION INITIATIVES80.0 80.0 80.0 80.0Total <strong>City</strong> Hall 80.0 80.0 80.0 80.0Total Corporate Building (Capital) Maintenance 3,152.0 2,292.0 1,941.0 2,726.5 3,277.9 10,095.5 23,484.9 23,484.9 23,484.9Next5 YearsTotalProjectCostGrants &SubsidiesFederalSources <strong>of</strong> External FinancingGas Tax Other DC'sDCDebtNet Costto <strong>City</strong>EquipmentReplacement<strong>City</strong>ReservesDebt336
CITY OF GUELPH2018 TO 2022 TAX SUPPORTED CAPITAL FORECAST DETAILSCorporate Building (Capital) MaintenanceGross Project Cost $(000's)Sources <strong>of</strong> External FinancingTotalProject CostGrants &FederalDCNet CostEquipment<strong>City</strong>Life CycleProject Number & Description 2018 2019 2020 2021 2022(2018-2022)AS0006 LIFE CYCLE-EVERGREEN40.0 80.0 120.0 120.0 120.0FS0036 LIFE CYCLE - FIRE HALL HQ 201125.0 40.0 3.5 68.5 68.5 68.5FS0037 LIFE CYCLE - FIRE HALL 236.0 36.0 36.0 36.0FS0038 LIFE CYCLE- FIRE HALL 325.0 20.0 45.0 45.0 45.0FS0039 LIFE CYCLE- FIRE HALL 415.0 15.0 15.0 15.0FS0040 LIFE CYCLE- FIRE HALL 567.0 42.5 109.5 109.5 109.5FS0046 LIFE CYCLE FIRE HALL 661.0 61.0 61.0 61.0GG0157 LIFE CYCLE - CITY HALL ANNEX35.0 35.0 35.0 35.0GG0160 LIFE CYCLE- RCP LAWN BOWLING450.0 450.0 450.0 450.0GG0222 LIFE CYCLE OPERATIONS <strong>2013</strong>1,143.0 55.0 70.0 10.0 1,278.0 1,278.0 1,278.0GG0226 LIFE CYCLE - MUNICIPAL ANNEX25.0 25.0 25.0 25.0LB0023 LIFE CYCLE - LIBRARY 2011105.0 15.0 8.0 158.0 286.0 286.0 286.0MU0008 LIFE CYCLE- MCCRAE HOUSE18.0 11.0 29.0 29.0 29.0PL0041 LIFE CYCLE - FARMER'S MARKET12.0 20.0 23.0 55.0 55.0 55.0PO0001 LIFE CYCLE- RIVERSIDE 201120.0 20.0 5.0 45.0 45.0 45.0PO0002 LIFE CYCLE- PARK BUILDINGS300.0 315.0 615.0 615.0 615.0RF0002 LIFE CYCLE - CENTENNIAL265.0 53.0 10.0 15.0 120.0 463.0 463.0 463.0RF0003 LIFE CYCLE - VRRC300.0 35.0 100.0 435.0 435.0 435.0RF0006 LIFE CYCLE - CENTENNIAL POOL30.0 15.0 55.0 100.0 100.0 100.0RF0007 LIFE CYCLE - EXHIBITION 201145.0 57.5 30.0 135.0 90.0 357.5 357.5 357.5RF0008 LIFE CYCLE - SLEEMAN165.0 990.0 140.0 130.0 1,425.0 1,425.0 1,425.0RF0054 LIFE CYCLE - WECC 201160.0 195.0 1,275.0 210.0 1,740.0 1,740.0 1,740.0RF0076 LC LYONS POOL 201458.0 58.0 58.0 58.0RR0060 LIFE CYCLE - RIVER RUN80.0 10.0 165.0 55.0 310.0 310.0 310.0TC0002 LIFE CYCLE- TRANSIT FACILITY305.0 25.0 170.0 500.0 500.0 500.0TC0003 LIFE CYCLE- TRANSIT TERMINAL54.0 54.0 54.0 54.0SubsidiesGas Tax Other DC'sDebtto <strong>City</strong>ReplacementReservesDebtTotal Life Cycle 2,773.0 2,117.5 1,842.5 1,065.0 917.5 8,715.5 8,715.5 8,715.5StructuralGG0213 STRUCTURAL ASSESSMENTS100.0 100.0 100.0 100.0GG0215 BLDG CONDITION ASSESSMENT100.0 100.0 200.0 200.0 200.0Total Structural 100.0 100.0 100.0 300.0 300.0 300.0AccessibilityGG0180 ACCESSIBILITY IMPROVEMENTS200.0 200.0 200.0 200.0 200.0 1,000.0 1,000.0 1,000.0Total Accessibility 200.0 200.0 200.0 200.0 200.0 1,000.0 1,000.0 1,000.0<strong>City</strong> HallGG0163 ENERGY CONSERVATION INITIATIVES80.0 80.0 80.0 80.0Total <strong>City</strong> Hall 80.0 80.0 80.0 80.0Total Corporate Building (Capital) Maintenance 3,073.0 2,417.5 2,222.5 1,265.0 1,117.5 10,095.5 10,095.5 10,095.5337
CITY OF GUELPH<strong>2013</strong> TAX SUPPORTED CAPITAL BUDGET2014 TO 2022 TAX SUPPORTED CAPITAL FORECASTInformation TechnologyInformation Technology Non-GrowthGross Project Cost $(000's)Project Number & Description <strong>2013</strong> 2014 2015 2016 2017GG0205 JOINT WIRELESS DESIGN998.2 998.2 998.2 998.2IT0001 FOLDING MACHING REPL25.0 65.0 90.0 90.0 90.0IT0011 DOWNTOWN FIBRE OPTIC NETWORK75.0 75.0 75.0 75.0IT0013 DATA ARCHIVAL SYSTEM65.5 65.5 131.0 131.0 131.0IT0015 LAND AMBULANCE ITS REPL 2012107.0 175.0 85.1 84.8 173.5 560.0 1,185.4 474.1 711.3 711.3IT0016 DESKTOP REPLACEMENT 2012250.0 100.0 304.7 324.0 300.0 1,278.0 2,556.7 20.0 2,536.7 2,536.7IT0017 NETWORK EQUIP REPLACEMENT 2012293.6 283.6 299.7 264.0 308.9 1,507.5 2,957.3 2,957.3 2,957.3IT0018 SERVER REPLACEMENT 2012326.4 360.0 326.4 327.0 370.0 1,916.6 3,626.4 3,626.4 3,626.4IT0019 SOFTWARE UPGRADE REPL 2012305.2 170.0 194.2 238.0 184.4 1,127.1 2,218.9 2,218.9 2,218.9IT0020 PRINTER REPLACEMENT 201225.0 10.0 7.4 143.0 28.8 221.1 435.3 435.3 435.3IT0024 IT STRATEGIC PLAN IMPLEMENTATION876.6 769.7 999.0 2,645.3 2,645.3 2,645.3IT0025 VOIP SYSTEM REPLACEMENT156.3 50.0 181.0 67.0 32.6 419.8 906.7 906.7 906.7IT0027 IT STRATEGIC PLAN - LAND AMBULANCE67.2 95.4 162.6 97.5 65.1 65.1Total Information Technology Non-Growth 3,405.5 2,038.7 2,397.5 1,447.8 1,463.7 7,235.6 17,988.8 591.6 17,397.2 13,482.6 3,914.6Total Information Technology 3,405.5 2,038.7 2,397.5 1,447.8 1,463.7 7,235.6 17,988.8 591.6 17,397.2 13,482.6 3,914.6Next5 YearsTotalProjectCostGrants &SubsidiesFederalSources <strong>of</strong> External FinancingGas Tax Other DC'sDCDebtNet Costto <strong>City</strong>EquipmentReplacement<strong>City</strong>ReservesDebt338
CITY OF GUELPH2018 TO 2022 TAX SUPPORTED CAPITAL FORECAST DETAILSInformation TechnologyGross Project Cost $(000's)Sources <strong>of</strong> External FinancingTotalProject CostGrants &FederalDCNet CostEquipment<strong>City</strong>Project Number & Description 2018 2019 2020 2021 2022Information Technology Non-GrowthIT0001 FOLDING MACHING REPL30.0 35.0 65.0 65.0 65.0IT0011 DOWNTOWN FIBRE OPTIC NETWORK75.0 75.0 75.0 75.0IT0013 DATA ARCHIVAL SYSTEM65.5 65.5 65.5 65.5IT0015 LAND AMBULANCE ITS REPL 2012118.1 82.7 184.5 86.0 88.7 560.0 224.0 336.0 336.0IT0016 DESKTOP REPLACEMENT 2012150.2 277.4 370.3 383.4 96.7 1,278.0 10.0 1,268.0 1,268.0IT0017 NETWORK EQUIP REPLACEMENT 2012293.0 293.6 299.7 303.6 317.6 1,507.5 1,507.5 1,507.5IT0018 SERVER REPLACEMENT 2012457.0 370.0 326.4 393.2 370.0 1,916.6 1,916.6 1,916.6IT0019 SOFTWARE UPGRADE REPL 2012228.0 249.9 162.5 241.2 245.5 1,127.1 1,127.1 1,127.1IT0020 PRINTER REPLACEMENT 201227.5 13.9 9.4 138.8 31.5 221.1 221.1 221.1IT0025 VOIP SYSTEM REPLACEMENT233.8 74.9 17.7 18.1 75.3 419.8 419.8 419.8(2018-2022)SubsidiesGas Tax Other DC'sDebtto <strong>City</strong>ReplacementReservesDebtTotal Information Technology Non-Growth 1,537.6 1,362.4 1,436.0 1,564.3 1,335.3 7,235.6 234.0 7,001.6 6,861.1 140.5Total Information Technology 1,537.6 1,362.4 1,436.0 1,564.3 1,335.3 7,235.6 234.0 7,001.6 6,861.1 140.5339
CITY OF GUELPH<strong>2013</strong> TAX SUPPORTED CAPITAL BUDGET2014 TO 2022 TAX SUPPORTED CAPITAL FORECASTEconomic DevelopmentGross Project Cost $(000's)TotalSources <strong>of</strong> External FinancingNextProjectGrants &FederalDCNet CostEquipment<strong>City</strong>Project Number & Description <strong>2013</strong> 2014 2015 2016 20175 YearsCostSubsidiesGas Tax Other DC'sDebtto <strong>City</strong>ReplacementReservesDebtEconomic Development Non-GrowthSS0002 HANLON CREEK BUSINESS PARK5,089.3 1,128.9 505.1 356.9 16,365.7 23,445.9 23,445.9Total Economic Development Non-Growth 5,089.3 1,128.9 505.1 356.9 16,365.7 23,445.9 23,445.9Total Economic Development 5,089.3 1,128.9 505.1 356.9 16,365.7 23,445.9 23,445.9340
CITY OF GUELPH2018 TO 2022 TAX SUPPORTED CAPITAL FORECAST DETAILSEconomic DevelopmentGross Project Cost $(000's)Sources <strong>of</strong> External FinancingTotalProject CostGrants &FederalDCNet CostEquipment<strong>City</strong>Project Number & Description 2018 2019 2020 2021 2022(2018-2022)SubsidiesGas Tax Other DC'sDebtto <strong>City</strong>ReplacementReservesDebtEconomic Development Non-GrowthSS0002 HANLON CREEK BUSINESS PARK9,753.8 6,611.9 16,365.7 16,365.7Total Economic Development Non-Growth 9,753.8 6,611.9 16,365.7 16,365.7Total Economic Development 9,753.8 6,611.9 16,365.7 16,365.7341
CITY OF GUELPH<strong>2013</strong> TAX SUPPORTED CAPITAL BUDGET2014 TO 2022 TAX SUPPORTED CAPITAL FORECASTFinance & OtherFinanceGross Project Cost $(000's)Project Number & Description <strong>2013</strong> 2014 2015 2016 2017GG0024 DC STUDY <strong>2013</strong>130.0 140.0 270.0 218.7 51.3 51.3Total Finance 130.0 140.0 270.0 218.7 51.3 51.3Total Finance & Other 130.0 140.0 270.0 218.7 51.3 51.3Next5 YearsTotalProjectCostGrants &SubsidiesFederalSources <strong>of</strong> External FinancingGas Tax Other DC'sDCDebtNet Costto <strong>City</strong>EquipmentReplacement<strong>City</strong>ReservesDebt342
CITY OF GUELPH2018 TO 2022 TAX SUPPORTED CAPITAL FORECAST DETAILSFinance & OtherGross Project Cost $(000's)Sources <strong>of</strong> External FinancingTotalProject CostGrants &FederalDCNet CostEquipment<strong>City</strong>FinanceProject Number & Description 2018 2019 2020 2021 2022(2018-2022)GG0024 DC STUDY <strong>2013</strong>140.0 140.0 113.4 26.6 26.6SubsidiesGas Tax Other DC'sDebtto <strong>City</strong>ReplacementReservesDebtTotal Finance 140.0 140.0 113.4 26.6 26.6Total Finance & Other 140.0 140.0 113.4 26.6 26.6343
CITY OF GUELPH<strong>2013</strong> TAX SUPPORTED CAPITAL BUDGET2014 TO 2022 TAX SUPPORTED CAPITAL FORECASTDowntown ImprovementsDowntown Improvements GrowthGross Project Cost $(000's)Project Number & Description <strong>2013</strong> 2014 2015 2016 2017Next5 YearsSS0019 BAKER ST REDEVELOPMENT PH33,700.0 3,700.0 1,704.6 1,995.4 1,995.4SS0020 BAKER ST REDEVELOPMENT PH41,400.0 1,400.0 645.0 755.0 755.0Total Downtown Improvements Growth 3,700.0 1,400.0 5,100.0 2,349.6 2,750.4 2,750.4Total Downtown Improvements 3,700.0 1,400.0 5,100.0 2,349.6 2,750.4 2,750.4TotalProjectCostGrants &SubsidiesFederalSources <strong>of</strong> External FinancingGas Tax Other DC'sDCDebtNet Costto <strong>City</strong>EquipmentReplacement<strong>City</strong>ReservesDebt344
CITY OF GUELPH<strong>2013</strong> TAX SUPPORTED CAPITAL BUDGET2014 TO 2022 TAX SUPPORTED CAPITAL FORECASTCommunity Energy PlanCommunity Energy Plan GrowthPL0028 COMMUNITY ENERGY PLAN30.0 45.0 75.0 6.1 69.0 69.0Total Community Energy Plan Growth 30.0 45.0 75.0 6.1 69.0 69.0Community Energy Plan Non-GrowthGross Project Cost $(000's)Project Number & Description <strong>2013</strong> 2014 2015 2016 2017PL0029 FACILITY ENERGY MEASURES1,249.3 985.6 1,085.5 1,214.0 1,109.9 6,343.0 11,987.3 3,596.4 8,390.9 8,390.9Total Community Energy Plan Non-Growth 1,249.3 985.6 1,085.5 1,214.0 1,109.9 6,343.0 11,987.3 3,596.4 8,390.9 8,390.9Total Community Energy Plan 1,279.3 1,030.6 1,085.5 1,214.0 1,109.9 6,343.0 12,062.3 3,596.4 6.1 8,459.9 8,459.9Next5 YearsTotalProjectCostGrants &SubsidiesFederalSources <strong>of</strong> External FinancingGas Tax Other DC'sDCDebtNet Costto <strong>City</strong>EquipmentReplacement<strong>City</strong>ReservesDebt345
CITY OF GUELPH2018 TO 2022 TAX SUPPORTED CAPITAL FORECAST DETAILSCommunity Energy PlanGross Project Cost $(000's)Sources <strong>of</strong> External FinancingTotalProject CostGrants &FederalDCNet CostEquipment<strong>City</strong>Project Number & Description 2018 2019 2020 2021 2022Community Energy Plan Non-Growth(2018-2022)PL0029 FACILITY ENERGY MEASURES1,268.6 1,268.6 1,268.6 1,268.6 1,268.6 6,343.0 1,903.0 4,440.0 4,440.0SubsidiesGas Tax Other DC'sDebtto <strong>City</strong>ReplacementReservesDebtTotal Community Energy Plan Non-Growth 1,268.6 1,268.6 1,268.6 1,268.6 1,268.6 6,343.0 1,903.0 4,440.0 4,440.0Total Community Energy Plan 1,268.6 1,268.6 1,268.6 1,268.6 1,268.6 6,343.0 1,903.0 4,440.0 4,440.0346
CITY OF GUELPH<strong>2013</strong> TAX SUPPORTED CAPITAL BUDGET2014 TO 2022 TAX SUPPORTED CAPITAL FORECASTPolicePolice Non-GrowthGross Project Cost $(000's)Project Number & Description <strong>2013</strong> 2014 2015 2016 2017PS0032 POLICE NEW VEHICLES46.0 64.2 64.9 66.2 68.2 309.5 309.5 309.5PS0034 POLICE HQ RENOVATIONS P250.0 50.0 800.0 25.0 25.0 125.0 1,075.0 1,075.0 1,075.0PS0044 POLICE IT HARDWARE520.3 398.4 162.0 336.0 260.9 2,485.4 4,163.0 4,163.0 4,163.0PS0045 POLICE BODY ARMOUR58.8 74.5 27.7 60.0 36.6 269.5 527.1 527.1 527.1PS0046 POLICE FURNITURE16.0 16.4 16.8 17.2 17.6 94.0 178.0 178.0 178.0PS0047 POLICE VEHICLE BASED EQUIPMENT74.2 62.5 63.8 65.1 66.5 353.8 685.9 685.9 685.9PS0048 POLICE TACTICAL EQUIPMENT106.7 30.1 73.0 12.5 21.3 184.0 427.6 427.6 427.6PS0049 GENERAL POLICE EQUIPMENT99.3 104.1 123.8 96.0 42.8 519.2 985.2 985.2 985.2PS0057 GPS VEHICLE REPL 2012606.4 782.9 563.5 480.8 606.3 3,273.4 6,313.3 72.0 6,241.3 6,241.3PS0059 Radio System Infrastructure750.0 750.0 750.0 750.0PS0060 Telecom Equipment400.0 400.0 400.0 400.0PS0061 HQ IT Equipment100.0 100.0 200.0 200.0 200.0Total Police Non-Growth 1,577.7 1,683.1 1,995.5 2,242.6 1,143.2 7,372.5 16,014.6 72.0 15,942.6 14,380.1 1,562.5Total Police 1,577.7 1,683.1 1,995.5 2,242.6 1,143.2 7,372.5 16,014.6 72.0 15,942.6 14,380.1 1,562.5Next5 YearsTotalProjectCostGrants &SubsidiesFederalSources <strong>of</strong> External FinancingGas Tax Other DC'sDCDebtNet Costto <strong>City</strong>EquipmentReplacement<strong>City</strong>ReservesDebt347
CITY OF GUELPH2018 TO 2022 TAX SUPPORTED CAPITAL FORECAST DETAILSPoliceGross Project Cost $(000's)Sources <strong>of</strong> External FinancingTotalProject CostGrants &FederalDCNet CostEquipment<strong>City</strong>Police Non-GrowthProject Number & Description 2018 2019 2020 2021 2022PS0032 POLICE NEW VEHICLES68.2 68.2 68.2 68.2PS0034 POLICE HQ RENOVATIONS P225.0 25.0 25.0 25.0 25.0 125.0 125.0 125.0PS0044 POLICE IT HARDWARE546.5 678.7 409.1 700.9 150.2 2,485.4 2,485.4 2,485.4PS0045 POLICE BODY ARMOUR64.9 82.3 30.6 66.2 25.5 269.5 269.5 269.5PS0046 POLICE FURNITURE18.0 18.4 18.8 19.2 19.6 94.0 94.0 94.0PS0047 POLICE VEHICLE BASED EQUIPMENT67.9 69.3 70.7 72.2 73.7 353.8 353.8 353.8PS0048 POLICE TACTICAL EQUIPMENT44.8 29.0 19.1 29.0 62.1 184.0 184.0 184.0PS0049 GENERAL POLICE EQUIPMENT35.0 198.6 124.7 97.6 63.3 519.2 519.2 519.2PS0057 GPS VEHICLE REPL 2012559.4 766.1 574.6 654.8 718.5 3,273.4 32.0 3,241.4 3,241.4(2018-2022)SubsidiesGas Tax Other DC'sDebtto <strong>City</strong>ReplacementReservesDebtTotal Police Non-Growth 1,361.5 1,867.4 1,340.8 1,664.9 1,137.9 7,372.5 32.0 7,340.5 7,053.3 287.2Total Police 1,361.5 1,867.4 1,340.8 1,664.9 1,137.9 7,372.5 32.0 7,340.5 7,053.3 287.2348
CITY OF GUELPH<strong>2013</strong> TAX SUPPORTED CAPITAL BUDGET2014 TO 2022 TAX SUPPORTED CAPITAL FORECASTLibraryLibrary Non-GrowthGross Project Cost $(000's)Project Number & Description <strong>2013</strong> 2014 2015 2016 2017LB0018 RFID INVENTORY CONTROL SYSTEM70.0 100.0 105.0 135.0 150.0 100.0 660.0 660.0 660.0LB0019 LIBRARY SYSTEM/NETWORK UPGRDS40.0 45.0 150.0 235.0 235.0 235.0LB0020 LIBRARY UPGRADES & SUSTAINABILITY25.0 26.0 51.0 51.0 51.0LB0021 BRANCH EXPANSION- BULLFROG350.0 350.0 350.0 350.0LB0032 LIBRARY OUTREACH VEHICLE35.0 35.0 35.0 35.0LB0033 BRANCH UPGRADES & SUSTAINABILITY35.0 35.0 110.0 180.0 180.0 180.0Total Library Non-Growth 95.0 175.0 131.0 250.0 150.0 710.0 1,511.0 1,511.0 1,511.0Total Library 95.0 175.0 131.0 250.0 150.0 710.0 1,511.0 1,511.0 1,511.0Next5 YearsTotalProjectCostGrants &SubsidiesFederalSources <strong>of</strong> External FinancingGas Tax Other DC'sDCDebtNet Costto <strong>City</strong>EquipmentReplacement<strong>City</strong>ReservesDebt349
CITY OF GUELPH2018 TO 2022 TAX SUPPORTED CAPITAL FORECAST DETAILSLibraryGross Project Cost $(000's)Sources <strong>of</strong> External FinancingTotalProject CostGrants &FederalDCNet CostEquipment<strong>City</strong>Library Non-GrowthProject Number & Description 2018 2019 2020 2021 2022(2018-2022)LB0018 RFID INVENTORY CONTROL SYSTEM100.0 100.0 100.0 100.0LB0019 LIBRARY SYSTEM/NETWORK UPGRDS50.0 50.0 50.0 150.0 150.0 150.0LB0021 BRANCH EXPANSION- BULLFROG350.0 350.0 350.0 350.0LB0033 BRANCH UPGRADES & SUSTAINABILITY35.0 35.0 40.0 110.0 110.0 110.0SubsidiesGas Tax Other DC'sDebtto <strong>City</strong>ReplacementReservesDebtTotal Library Non-Growth 185.0 435.0 90.0 710.0 710.0 710.0Total Library 185.0 435.0 90.0 710.0 710.0 710.0350
<strong>City</strong> <strong>of</strong> <strong>Guelph</strong> - Fire DepartmentVehicle & Equipment Replacement Summary (Project Numbers: FS0030 & FS0031)InventoryAnnual Replacement<strong>2013</strong> 2014 2015 2016 2017 2018 2019 2020 20212022Type # $ # $ # $ # $ # $ # $ # $ # $ # $ # $ #VehicleTanker - International Vehicle(s) 1 - - - - - - - - - - 417,500 1 - - - - - - - -Pumper Vehicle(s) 8 1,302,500 1 - - - - - - - - 664,100 1 - - 723,900 1 - - - -75 Foot Aerial Quint Vehicle(s) 1 - - - - 1,355,200 1 - - - - - - - - - - - - - -100 Foot Aerial Vehicle(s) 1 - - - - - - - - - - - - - - - - - - - -PACETrailer Vehicle(s) 5 - - - - - - 61,000 1 - - - - - - 65,800 1 100,700 1 486,000 1Command Centre Vehicle(s) 1 - - 374,200 1 - - - - - - - - - - - - - - - -Service Vehicle - Chev Van 3 - - - - - - - - - - 22,800 1 46,400 2 - - - - - -Mid-size Vehicle(s) 4 - - - - 31,000 1 - - 86,800 1 - - - - - - 58,900 2 - -Zodiac Boat(s) 2 - - - - - - - - - - 21,500 2 - - - - - - - -Pick-up Trucks 3 - - 70,100 1 - - 73,000 1 - - - - 31,000 1 - - - - - -Fire Training Simulator 0 -Total Vehicle Purchases 29 1,302,500 1 444,300 2 1,386,200 2 134,000 2 86,800 1 1,125,900 5 77,400 3 789,700 2 159,600 3 486,000 1EquipmentSCBA Equipment 653,900 - - - - - - - - -HazMat SCBA Equipment - - - - - 189,800 - - - -Poratable Air Cascade System 90,100 - - - - - - - - -Protective Gear (helmets, clothing, boots, etc) 12,400 12,700 84,400 13,200 13,500 450,200 14,000 14,300 14,500 95,700Thermal Imaging Cameras - - - - - 82,200 - - - -Semi Automatic Defibrillator - - - - - - 42,600 - -Auto-Extrication Equipment - - - - - 310,000 - - - -Generators and Battery Back-up 3,400 3,500 3,600 17,600 3,700 3,800 3,900 3,900 19,400 4,100Air Monitoring Equipment & Low Pressure Bags - 22,800 17,900 - - 22,300 - 19,700 - -Fire Hoses 28,600 29,200 29,800 30,400 31,000 31,600 32,300 32,900 33,600 34,200Struts - - - - - - 31,000 - - -FPO Public Education Equipment 2,900 - - - - 3,200 - - - -Furniture - 10,600 - - 11,200 - - 11,900 - -Total Equipment Purchases 791,300 78,800 - 135,700 - 61,200 - 59,400 - 1,093,100 - 81,200 - 125,300 - 67,500 - 134,000 -Total Expenditure $2,093,800 $523,100 $1,521,900 $195,200 $146,200 $2,219,000 $158,600 $915,000 $227,100 $620,000Revenue<strong>Guelph</strong> Township Retainer & Fire Agreements 199,000 200,000 201,000 195,200 146,200 204,000 158,600 206,000 207,000 208,000Total Revenue $199,000 $ 200,000 $ 201,000 $ 195,200 $ 146,200 $ 204,000 $ 158,600 $ 206,000207,000 208,000Reserve Funding Requested $1,894,800 $323,100 $1,320,900 $0 $0 $2,015,000 $0 $709,000 $20,100 $412,000351
<strong>City</strong> <strong>of</strong> <strong>Guelph</strong> - Fire Department Radio & Computer SystemEquipment Replacement Summary (Project # FS0032)InventoryAnnual Replacement<strong>2013</strong> 2014 2015 2016 2017 2018 2019 2020 20212022Type # $ # $ # $ # $ # $ # $ # $ # $ # $ # $ #Radios- Portables 52 110,300 17 - - - - - - - - - - - - 406,900 52 - - - -Radios- Mobile 19 49,500 6 - - - - - - - - - - - - 189,200 19 - - - -Charger- Single 6 1,900 2 - - - - - - - - - - - - 6,800 6 - - - -Charger- Multi 7 2,800 2 - - - - - - - - - - - - 12,000 7 - - - -Batteries 125 9,900 42 - - - - - - - - - - - - 35,000 125 - - - -Dispatch Console 3 69,000 1 70,400 1 71,800 1 - - - - - - - - - - - -Total Fire Services 209 174,400 69 69,000 1 70,400 1 71,800 1 - - - - - - 649,900 209 - - - -Reserve Funding Required 209 174,400 69,000 70,400 71,800 - - - 649,900 - -352
<strong>City</strong> <strong>of</strong> <strong>Guelph</strong> - Land AmbulanceVehicle & Equipment Replacement Summary (Project Numbers AM0001 & AM0002)InventoryAnnual Replacement# In <strong>2013</strong> 2014 2015 2016 2017 2018 2019 2020 2021 2022Type Inventory $ # $ # $ # $ # $ # $ # $ # $ # $ # $ #Replacement VehiclesAmbulance 11 404,400 3 550,000 4 420,900 3 429,300 3 437,700 3 446,400 3 607,200 4 464,700 3 474,000 3 483,000 3ERU - Command Vehicle 1 - - - - - - 90,500 1 - - 94,200 1 - - - - 100,000 - - -Total Vehicle Replacement 13 $ 404,400 3 $ 550,000 4 $ 420,900 3 $ 519,800 4 $ 437,700 3 $ 540,600 4 $ 607,200 4 $ 464,700 3 $ 574,000 3 $ 483,000 3EquipmentAmbulance Equipment - 88,800 8,800 26,000 50,400 507,000 41,900 58,300 8,500 136,000Total Equipment Replacement $ - $ 88,800 $ 8,800 $ 26,000 $ 50,400 $ 507,000 $ 41,900 $ 58,300 $ 8,500 $ 136,000Total $ 404,400 $ 638,800 $ 429,700 $ 545,800 $ 488,100 $ 1,047,600 $ 649,100 $ 523,000 $ 582,500 $ 619,000RevenueContribution From County - 40% 161,800 255,500 171,920 218,300 195,260 419,000 259,660 209,200 233,000 247,600TOTAL REVENUE $161,800 $255,500 $171,920 $218,300 $195,260 $419,000 $259,660 $209,200 $233,000 $247,600Reserve Funding Required $242,600 $383,300 $257,780 $327,500 $292,840 $628,600 $389,440 $313,800 $349,500 $371,400353
<strong>City</strong> <strong>of</strong> <strong>Guelph</strong> - Information Technology Computer EquipmentEquipment Replacement Summary (Project Numbers IT0016 to IT00020 & IT0025)InventoryAnnual Replacement<strong>2013</strong> 2014 2015 2016 2017 2018 2019 2020 2021 2022Type #Desktop 250,000 100,000 304,700 324,400 300,000 150,200 277,400 370,300 383,400 96,700Network Equipment 293,600 283,600 299,700 264,000 308,900 293,000 293,600 299,700 303,600 317,600Server 326,400 360,000 326,400 327,000 370,000 457,000 370,000 326,400 393,200 370,000S<strong>of</strong>tware 305,200 170,000 194,200 238,000 184,400 228,000 249,900 162,500 241,200 245,500Printer 25,000 10,000 7,400 143,000 28,800 27,500 13,900 9,400 138,800 31,500Phone 156,300 50,000 181,000 67,000 32,600 233,800 74,900 17,700 18,100 75,300Total Expenditures 1,356,500 973,600 1,313,400 1,363,400 1,224,700 1,389,500 1,279,700 1,186,000 1,478,300 1,136,600Reserve Funding Required $1,356,500 $973,600 $1,313,400 $1,363,400 $1,224,700 $1,389,500 $1,279,700 $1,186,000 $1,478,300 $1,136,600354
<strong>City</strong> <strong>of</strong> <strong>Guelph</strong> - Park Play EquipmentEquipment Replacement Summary (Project Number PK0033)Park Name <strong>2013</strong> 2014 2015 2016 2017 2018 2019 2020 2021 2022BAILEY PARK 42,600 - - - - - - - - -BATHGATE DRIVE PARK - - - - - - - - - -BEVERLEY ROBSON PARK - - - - - - - - - -BRANT AVENUE PARK - - - - - - - - - -BULLFROG POND PARK - - - - - - - 50,600 - -BURNS DRIVE PARK - - - - - - 49,300 - - -CARTER PARK - - - 45,800 - - - - - -CASTLEBURY DRIVE PARK - - - - - - - - - -CENTENNIAL PARK - - - 45,800 - - - - - -CLAIR PARK - - - - - 48,100 - - - -CNR SPURLINE PARK - - 44,700 - - - - - - -COLONIAL DRIVE PARK - - - - - 48,100 - - - -DAKOTA PARK - - - - - - - - -DEERPATH DRIVE PARK - 43,600 - - - - - - - -DOVERCLIFFE PARK - - - - - - - 50,600 - -DREW PARK - - - - - - 41,100 - - -DRUMMOND PARK - - - - 47,000 - - - - -DUNHILL PLACE PARK - - - - - - - - - -EARL BRIMBLECOMBE PARK - - - 45,800 - - - - - -ERAMOSA RIVER PARK - - - - - - - - - -EXHIBITION PARK - 109,000 - - - - - - - -FERNDALE PARK - - - - - - - - - -FRANCHETTO PARK - - - - - - - - - -GOLDIE PARK - - - - - - - - - -GOLFVIEW PARK - - - - - - - - - -GOSLING GARDENS PARK - - - - 47,000 - - - - -GRANGE ROAD PARK - - - - - - 49,300 - - -GREEN MEADOWS PARK - - - - - 48,100 - - - -GUELPH LAKE SPORTS FIELDS - - - - 47,000 - - - - -HANLON CREEK PARK - - - - 47,000 - - - - -HARTSLAND PARK - - - - - - - - - -HERB MARKLE PARK - - - - - - 43,100 - - -HIGHVIEW PARK - - - - - - 41,100 - - -HOLLAND CRESENT PARK - - - - - - - - - 53,100HOWDEN CRESENT PARK - - - - - - 57,600 - - -HOWITT PARK - - - - - - 41,100 - - -HUGH C. GUTHRIE PARK - - - - 47,000 - - - - -JENSON BOULEVARD PARK - - - 45,800 - - - - - -JOE VERONI PARK - - - - - - - - - -JOHN GAMBLE PARK - - - - - - - 50,600 - -JOSEPH WOLFOND PARK EAST - - - - - - - - - -KIMBERLEY PARK - - - - 47,000 - - - - -KORTRIGHT HILLS PARK - - - - - 48,100 - - - -LEE STREET PARK - - - - 47,000 - - - - -LEWIS FARM PARK - - - - - - - - - -LYON PARK - 42,500 - - - - - - - -MACALISTER PARK - - - - - - - - - -MARGARET GREENE PARK - - - - - - - - 233,500 -MARKSAM PARK - - - - - - - - - -MAYFIELD PARK - - 44,700 - - - - - - -MEMORIAL CRESCENT PARK - - - - - - - - - -MICO VALERIOTE PARK - - - - - - - - - -MOLLISON PARK - - - 48,900 - - - - - -355
<strong>City</strong> <strong>of</strong> <strong>Guelph</strong> - Park Play EquipmentEquipment Replacement Summary (Project Number PK0033)Park Name <strong>2013</strong> 2014 2015 2016 2017 2018 2019 2020 2021 2022MORNINGCREST PARK - - - - - - - - - -NORM JARY PARK - 43,600 - - - - - - - -OAK STREET PARK - SENIOR & SWIN - - - - - - - - - -OAK STREET PARK - JUNIOR - - - 38,700 - - - - - -O'CONNOR LANE PARK - - - - - - - - 51,800 -ORIN REID PARK - - - - - - - - - -PETER MISERSKY PARK - - - - - 120,400 - - - -PINCH PARK - - - - - - - - - -PINE RIDGE PARK - - - - - - - - - -RICKSON PARK - - - - - - - - - -RIVERSIDE PARK (WEST) - - 312,900 - - - - - - -RIVERSIDE PARK (EAST) 42,600 - - - - - - - - -ROYAL CITY PARK (NORTH) - - - - - - 49,300 - - -ROYAL CITY PARK (SOUTH) - - - - - - - - - -SEVERN DRIVE PARK - - - - - - - - - 74,400SKOV PARK - - - - - - - 50,600 - -SLEEMAN PARK - - - - - - - - - -SOUTH END COMMUNITY PARK - - - - - - - - 464,100SPRINGDALE PARK - - - 45,800 - - - - - -ST. GEORGE'S PARK - - - - - - - 50,600 - -STARVIEW CRS PARK 42,600 - - - - - - - - -STEFFLER PARK - - - - - 48,100 - - - -STEPHANIE DR PARK - - - - - - - - - -SUFFOLK ST PARK - - - - - 48,100 - - - -SUMMIT RIDGE PARK - - - - - - - - - -SUNNY ACRES PARK - - - 45,800 - - - - - -UNIVERSITY VILLIAGE PARK - - - - - - 41,100 - - -WAVERLEY DR PARK - - - - 47,000 - - - - -W.E. HAMILTON PARK - - - - - - - 50,600 - -WESTMINSTER WOODS PARK - - - - - - - 50,600 - -WEST END COMMUNITY CENTRE - - - 45,800 - - - - - -WHITELAW GARDENS PARK - - - - - - - - - -WINDSOR PARK - - 44,700 - - - - - - -WOODLAND GLEN PARK - - - - - - - - - 53,100YEWHOLME PARK 42,600 - - - - - - - - -ST. JOHN ELEM SCHOOL - - - - - 48,100 - - - -Funding Required $ 170,400 $ 238,700 $ 447,000 $ 408,200 $ 376,000 $ 457,100 $ 413,000 $ 354,200 $ 285,300 $ 644,700356
<strong>City</strong> <strong>of</strong> <strong>Guelph</strong> - Waste Management ServicesEquipment Replacement Summary (Project WC0006)InventoryAnnual Replacement# In<strong>2013</strong>2014 2015 2016 2017 2018 20192020 2021 2022Equipment Type Inventory $ # $ # $ # $ # $ # $ # $ # $ # $ # $ #MRFAir Compressor 1 168,000 1 60,000 1Bag Breaker Hopper 1Bag Breaker 1 150,000Bag Breaker conveyor 2Baler 2Baler Infeed Conveyer 2 275,000 275,000Compactor 3 156,000 2 78,000 1 79,000 1Disk Screen 3 52,500 1Dock Levelers 1Dust Collector 1 50,000 1Feeder 1 - - 52,500Ferrous Seperator - Dry 1 115,500 52,500Fiber Screen 1 100,000 1Fiber Walking Floors 2 252,000Hydraulic units 1Glass Breaker 2 95,000 1 170,000 1 129,500Glass Hopper 1 60,000 1HY.D unit walking floors 2Man Door 35 5,000 5Pet Blower 2Plastic Crusher 2Roller Chain Belt 3 250,000 1 450,000 2Ro<strong>of</strong> 1Separator 1 94,000 1Transfer Conveyor 50 150,000Truck Door 16 95,000 2 50,000 1 105,500 2 201,000 4 215,200 4 110,000 2Bunker Walking Floor 2 150,000 1Fire Suppression 25,000 1 25,000 1 25,000 1 25,000 1 25,000 1 25,000 1 25,000 1 25,000 1 25,000 1 25,000 1Dock Locks 6Bale Breaker 1 500,000 1Pump House 1Tip Floor 1 500,000 1Bale Floor 1 500,000 1Electrical 50,000 50,000 50,000 100,000357
<strong>City</strong> <strong>of</strong> <strong>Guelph</strong> - Waste Management ServicesEquipment Replacement Summary (Project WC0006)InventoryAnnual Replacement# In<strong>2013</strong>2014 2015 2016 2017 2018 20192020 2021 2022Equipment Type Inventory $ # $ # $ # $ # $ # $ # $ # $ # $ # $ #ORGANICAir Makeup Unit 1Bi<strong>of</strong>ilters 1Blower Fans 1Compactors 1Compost Bag Breaker 1Compost Incline Conveyer 1Compost Sprinkler System 2Conveyors 1Ferrous Separators (Organic) 1Misting System 1Ro<strong>of</strong> 1Spreader Screw 1Sprinkler Hangers 1Trommel 1Truck Doors 7Turning Machine 4Wind Curtains 7OTHERAdministration 1 10,000Administration Ro<strong>of</strong> 1Central Filing and Documentation 1 5,000HHW 1HVAC Units 6 50,000 1 50,000 1Natural Perimiter 1 100,000 50,000 1 50,000 1Pumping station 1 64,000Roll<strong>of</strong>f Bins 40 62,900 8 50,000 7 82,000 10 40,000 6Security System 1Scalehouse 1Scalehouse Inbound 1Scalehouse Outbound 1Truck Scale 1Upgrade Telephone System 1 35,000Public Drop Off SawteethAsphalt/Paving 124,200 250,000 125,000 1Outdoor Lights 50,000 65,000 70,000Transformers 125,000 150,000Fire Hydrants 25,000Wells/Separators 35,000 40,000Residential Carts 55,000 25,000 77,000 242,300 107,000COLLECTIONS/EASTVIEWGas collection system 1Lechate System 1TRANSFER STATIONAir System and Ventilation 1 1Compactor 1 250,000 1Dust Suppression/Odor 1 126,000Floor 1Pumping Station 3Push Wall 1Ro<strong>of</strong> 1 300,000 1Scale 1 100,000Scalehouse 1Truck doors 4 131,000Electrical 90,000TOTAL FUNDED FROM RESERVE $894,900 15 $982,700 16 $850,000 19 $700,000 4 $800,000 5 $816,000 2 $1,323,000 11 $801,000 6 $1,290,000 8 $1,000,000 3358
<strong>City</strong> <strong>of</strong> <strong>Guelph</strong> - FleetVehicle & Equipment Replacement Summary (Project # GG0187)INVENTORYANNUAL REPLACEMENT# In<strong>2013</strong>2014 2015 2016 2017 2018 20192020 2021 2022Inventory $ # $ # $ # $ # $ # $ # $ # $ # $ # $ #Location <strong>of</strong> AssetsParks1 TON DUMP 1 - - - - - - - - - - - - - - - - 84,700 1 - -1/2 TON PICKUP 2 - - 57,962 2 - - - - - - - - 62,000 2 - - - - - -3/4 TON PICKUP 2 29,500 1 - - - - - - 71,400 2 - - - - - - - - 74,925 23/4 TON PICKUP 4x4 1 - - - - - - - - - - - - - - - - 73,000 1 - -4x4 DUMP 4 - - - - - - - - - - - - - - 237,100 3 - - - -6FT BALL DIAMOND GROOM 2 - - - - - - - - - - - - 12,200 2 - - - - -AERATOR 1 - - - - - - - - - - - - 39,000 1 - - - - -AERIFIER 2 - - - - - - - - - - - - - - - - - - 34,000 2BACKHOE 1 - - - - - - 87,800 1 - - - - - - - - - - - -BALL DIAMNOND GROOMER 1 12,400 - - - - - - - - - - - 27,000 1 - - - - -BK BLOWER 1 - - - - - - - - - - - - - - - - - - - -BOX TRAILER 0 - - - - - - - - - - - - - - - - - - - -BROOM 2 - - - - - - 23,900 2 - - - - - - - - - - - -BRUSH MULCHER 1 - - - - - - - - - - - - 14,000 1 - - - - -CAROUSEL 0 - - - - - - - - - - - - - - - - - - - -CEMENT MIXER 1 - - - - - - - - - - - - - - - - - - - -CHAIN SAW 1 - - - - - - 900 1 - - - - - - - - 1,000 1 - -COMPACT PICKUP 3 42,800 2 24,530 1 - - - - 51,000 2 - - 26,000 1 - - - - 58,600 2COMPRESSOR 1 - - - - - - - - - - - - - - - - - - - -CON SAW 0 - - - - - - - - - - - - - - - - - - - -CREW CAB 1 67,400 1 - - - - - - - - - - - - - - - - - -DIAMOND GROOMER 1 - - 12,834 1 - - - - - - - - - - - - - - - -DISC 1 - - - - - - - - - - - - - - - - - - - -DUMP 2 110,000 1 150,286 1 - - - - - - - - - - - - - - - -EDGER 1 - - - - - - - - - - - - - - - - - - - -ELECTRIC IN-FIELD RAKE 1 - - - - - - - - - - - - 23,400 1 - - - - -EZ-GO ELECTRIC UTILITY 2 - - 23,806 2 - - - - - - - - - - - - - - -FERTILIZER SPREADER 2 - - - - - - - - - - - - 2,700 1 - - - - - -FLAIL MOWER ATTACHMENT 2 - - - - - - - - - - - - - - - - - - - -GATOR 1 - - - - - - - - - - - - - - - - - - 16,900 1GATOR TRAILER 1 - - - - - - - - - - - - - - - - - - 6,900 1GENERATOR 1 - - - - - - - - - - - - - - - - - - - -GRADER BLADE 1 - - - - - - - - - - - - - - - - - - - -GRACO FIELD LASER 2 - - 4,347 2 - - - - - - - - - - - - - - -HAUL-ALL 1 - - - - 155,900 1 - - - - - - - - - - - - - -HEDGE TRIMMER 0 - - - - - - - - - - - - - - - - - - - -JD ELECTRIC GATOR 1 - - - - - - - - - - - - 13,400 1 - - - - - -LANDSCAPE TRAILER 1 - - - - - - - - - - - - 4,000 1 - - - - -LAWN MOWER 0 - - - - - - - - - - - - - - - - - - - -LEAF VAC 1 - - - - - - - - - - - - - - - - - - - -LOADER 1 - - - - - - - - - - 62,300 1 - - - - - - - -MOWER 14 159,000 3 121,616 1 141,800 3 - - 293,200 2 132,300 2 - - 324,300 4 36,700 1 37,500 1OVER SEEDER 1 54,000 1 - - - - - - - - - - - - - - - - - -PADDLE BOATS 1 - - - - - - - - - - 5,200 1 - - - - - - - -PLOW 1 - - - - - - - - - - - - - - - - - - - -PORTABLE WELDER 1 - - - - - - 5,500 1 - - - - - - - - - - - -POST AUGER 0 - - - - - - - - - - - - - - - - - - - -POST POUNDER 0 - - - - - - - - - - - - - - - - - - - -POWER RAKE 1 - - - - - - - - - - - - - - - - - - - -POWER WASH 0 - - - - - - - - - - - - - - - - - - - -POWERSWEEP 1 - - - - - - - - - - - - - - - - - - - -PULVERIZER 1 - - - - - - - - - - - - - - - - - - - -QUAD CAB 1 45,000 1 - - - - - - - - 61,000 1 - - - - - - - -REAR LOAD PACKER 1 - - - - - - - - - - - - - - - - 132,000 - -ROLLER 1 - - - - - - - - - - - - - - - - - - - -ROOT PRUNER 1 - - - - - - - - - - - - - - - - - - - -ROTOTILLER 1 - - - - - - - - - - - - - - - - - - - -ROTOTILLER 3PT 0 - - - - - - - - - - - - - - - - - - - -359
<strong>City</strong> <strong>of</strong> <strong>Guelph</strong> - FleetVehicle & Equipment Replacement Summary (Project # GG0187)INVENTORYANNUAL REPLACEMENT# In<strong>2013</strong>2014 2015 2016 2017 2018 20192020 2021 2022Inventory $ # $ # $ # $ # $ # $ # $ # $ # $ # $ #SAND CLEANER 1 - - - - - - - - - - - - 18,500 1 - - - - -SEEDER 1 - - - - - - - - - - - - - - - - - - - -SKID STEER 1 49,900 1 - - - - - - - - - - - - - - - - - -SNOW BLOWER 2 - - 7,556 2 - - - - - - - - 8,400 2 - - - - - -SNOW BLOWER PTO 3 7,600 2 - - - - 4,400 1 - - - - - - - - - - - -SOD CUTTER 1 - - - - - - - - - - - - - - - - - - - -SOIL RENOVATOR 2 - - - - - - - - - - - - 42,600 2 - - - - -SOIL SHRED. 0 - - - - - - - - - - - - - - - - - - - -SPRAYER 2 - - - - - - - - - - - - - - - - - - - -SPRINTER PLAYGROUNDS V 1 - - - - - - - - - - - - - - 82,000 1 - - -SWEEPER 1 - - - - - - - - - - 15,400 1 - - - - - - - -TAMPER 1 - - - - - - - - - - - - 2,900 1 - - - - - -TANDEM TRAILER 7 13,400 3 - - 6,400 1 16,000 1 5,200 1 - - 5,400 1 - - 17,600 1 - -TOP DRESSER 1 54,000 1 - - - - - - - - - - - - - - - - - -TRACKLESS BOOM 1 - - - - 32,600 1 - - - - - - - - - - - - - -TRACKLESS FLAIL 2 - - - - 11,300 1 14,500 1 - - - - - - - - - - - -TRACTOR 7 130,500 3 - - 31,200 1 - - - - - - 34,500 1 44,000 1 72,800 1 - -TRACTOR FLAIL MOWER 1 - - - - - - - - - - - - - - - - - - - -TRAIL GROOMER 1 - - 7,142 1 - - - - - - - - - - - - - - - -TRAILER 6 5,600 1 - - - - - - - - 6,600 1 5,600 1 - - 3,800 1 - -TRAILER TANDEM 2 - - - - - - - - - - - - 11,200 2 - - - - -TRAIN 1 - - - - - - - - - - 534,100 1 - - - - - - - -TREE DIGGER 1 - - - - - - - - - - - - - - - - - - - -TRU PLAY 3 - - - - - - - - - - - - - - - - - - - -UTILITY 1 80,900 1 - - - - - - - - - - - - - - - - - -VAN 2 26,300 1 28,981 1 - - - - 29,800 1 - - 31,000 1 - - - - 33,900 1WALKER MOWER 1 - - - - - - - - - - - - - - - - 57,800 1 - -WATER TANK 1 - - - - - - - - - - - - - - - - - - - -WEEDEATER 0 - - - - - - - - - - - - - - - - - - - -WELDER 0 - - - - - - - - - - - - - - - - - - - -YORK RAKE 1 - - - - - - - - - - - - - - - - - - - -ZT MOWER 3 - - - - - - 65,700 3 - - - - - - - - - - -Sub-total Parks 135 888,300 23 439,059 14 379,200 8 218,700 11 450,600 8 816,900 8 383,800 24 687,400 9 479,400 8 262,725 10ClerksCAR 1 - - - - - - - - 23,200 1 - - - - - - - - - -Sub-total Clerks 1 - - - - - - - - 23,200 1 - - - - - - - - - -PlanningCAR 1 26,000 1 - - - - - - 23,200 1 - - - - - - - - - -Sub-total Planning 1 26,000 1 - - - - - - 23,200 1 - - - - - - - - - -Recreation1/2 TON PICKUP 1 - - 35,812 1 - - - - - - - - - - 32,500 1 - - - -CARPET 2 - - - - - - - - - - - - - - - - 3,900 1 - -FORKLIFT 1 - - - - - - 46,500 1 - - - - - - - - - - - -ICE EDGER 2 - - - - - - - - - - - - - - - - - - - -ICE EDGER ELECTRIC 3 - - 20,908 3 - - - - - - - - - - 21,000 3 - - -ICE RESURFACER 6 - - - - 99,200 1 203,400 2 - - 244,200 2 - - 97,500 1 - - - -PICKUP 1 - - 40,056 1 - - - - - - - - - - 45,500 1 - - -POLISHER 5 - - - - - - - - - - - - - - - - - - - -POWER WASH 1 - - - - - - - - - - - - - - - - - - - -SCRUBBER 8 - - - - - - 19,600 2 - - - - - - - - - - - -SKATEBOARD TRAILER 0 - - - - - - - - - - - - - - - - - - - -SNOW BLOWER 2 - - - - - - - - - - - - - - - - 5,400 1 - -VAN 0 - - - - - - - - - - - - - - - - - - - -Sub-total Recreation 32 - - 96,775 5 99,200 1 269,500 5 - - 244,200 2 - - 196,500 6 9,300 2 - -360
<strong>City</strong> <strong>of</strong> <strong>Guelph</strong> - FleetVehicle & Equipment Replacement Summary (Project # GG0187)INVENTORYANNUAL REPLACEMENT# In<strong>2013</strong>2014 2015 2016 2017 2018 20192020 2021 2022Inventory $ # $ # $ # $ # $ # $ # $ # $ # $ # $ #Building DivisionCAR 13 104,000 3 94,395 4 - - 113,500 5 92,800 4 - - 100,000 4 - - 127,500 8 135,200 4COMPACT PICKUP 2 22,500 1 31,361 1 - - - - 25,500 1 - - 33,300 1 - - - 1 - -Sub-total Building Division 15 126,500 4 125,756 5 - - 113,500 5 118,300 5 - - 133,300 5 - - 127,500 9 135,200 4Corporate BuildingsVAN 2 52,600 2 - - - - - - 59,600 2 - - - - - - 68,400 2 - -SNOW BLOWER W/B 1 - - 2,588 1 - - - - - - - - 2,800 1 - - - - -Sub-total Corporate Buildings 3 52,600 2 2,588 1 - - - - 59,600 2 - - 2,800 1 - - 68,400 2 - -Waste CollectionCOMPACT PICKUP 4 45,000 2 - - - - - - 104,600 4 - - - - - - - - 132,600 4PACKERS 18 - - - - - - - - - - 2,370,800 7 1,740,000 5 1,074,000 3 - - - -PICKUP 1 - - 26,393 1 - - - - - - - - 28,000 1 - - - - -Sub-total Waste Collection 23 45,000 2 26,393 1 - - - - 104,600 4 2,370,800 7 1,768,000 6 1,074,000 3 - - 132,600 4Engineering1/2 TON PICKUP 2 - - 55,892 2 - - - - - - - - 59,400 2 - - - - - -CAR 1 - - 23,599 1 - - - - - - - - 25,000 1 - - - - - -PICKUP 4X4 CC 2 - - 70,796 2 - - - - - - - - 75,200 2 - - - - - -PICKUP 1 - - 25,876 1 - - - - - - - - 27,500 1 - - - - -Sub-total Engineering 6 - - 176,162 6 - - - - - - - - 187,100 6 - - - - - -LandfillPICKUP 0 - - - - - - - - - - - - - - - - - - - -SCRAPER 0 - - - - - - - - - - - - - - - - - - - -COMPACTOR 0 - - - - - - - - - - - - - - - - - - - -BACKHOE 0 - - - - - - - - - - - - - - - - - - - -ATV 0 - - - - - - - - - - - - - - - - - - - -Sub-total Landfill 0 - - - - - - - - - - - - - - - - - - - -Public Works1 TON DUMP 2 - - - - - - - - - - - - - - - - 151,000 2 - -1.5 TON DUMP 1 - - - - 65,000 1 - - - - - - - - - - - - - -1/2 TON PICKUP 2 - - - - - - 66,100 2 - - - - - - - - 74,100 2 - -15000 GVW 6 - - - - - - - - 107,200 1 - - - - - - 464,200 5 - -3/4 TON PICKUP 5 88,500 3 - - - - - - 176,800 5 - - - - - - - - 192,500 63/4 TON PICKUP 4X4 W/ LIFT 1 - - - - - - 94,400 1 - - - - - - - - - - - -32000 GVW 3 263,000 1 - - - - - - - - - - - - - - - - 500,000 235000 GVW 1 - - - - - - 239,700 1 - - - - - - - - - - - -4 x 4 DUMP 1 - - - - - - - - - - 81,900 1 - - - - - - - -70 ft FORESTRY AERIAL 1 - - - - - - - - - - - - - - 420,000 1 - - -AERIAL 1 - - - - - - - - - - - - - - - - 362,000 1 - -AIR CONDITIONER 1 - - - - - - - - 10,400 1 - - - - - - - - - -ASPHALT TRAILER 1 - - - - 24,100 1 - - - - - - - - - - - - - -BACKHOE 1 - - - - - - - - - - - - - - - - - - 214,500 1BAND SAW 1 - - - - 11,300 1 - - - - - - - - - - - - - -BK BLOWER 0 - - - - - - - - - - - - - - - - - - - -BRAKE DRUM 1 - - - - 65,600 1 - - - - - - - - - - - - - -BRAKE ROTOR 1 - - - - - - - - - - - - - - 32,000 1 - - - -BOX TRAILER 1 - - - - - - - - - - - - - - - - - - - -BUS WASH 1 - - - - - - - - - - - - - - - - - - - -CAR 1 - - - - - - 22,700 1 - - - - - - - - 27,300 1 - -CAR FLEET 1 26,000 1 - - - - - - - - - - - - - - - - -CASE LOADER 1 - - - - - - - - - - - - - - - - - - 250,000 1CCTV TRUCK 1 - - - - - - - - - - - - - - 358,000 1 - - -CHAIN SAW 0 - - - - - - - - - - - - - - - - - - - -CHIPPER 3 51,300 1 - - 56,700 1 - - - - - - - - 31,800 1 - - - -COMPACT PICKUP 8 112,500 5 - - 72,900 3 - - 127,500 5 - - - - 83,700 3 - - 198,900 6COMPACT 4x4 PICKUP 2 22,500 1 - - - - - - 51,000 2 - - - - - - - - - -COMPRESSOR 5 - - 54,442 2 14,200 2 - - 29,800 1 - - - - - - - - - -CON SAW 1 - - - - 1,300 1 - - - - - - - - 1,700 1 - - - -CON VIBRATOR 1 - - - - - - - - - - - - - - - - - - - -CRANE 2 - - 64,379 1 - - - - - - - - - - - - - - - -CREW CAB DUMP 2 101,200 1 - - - - 71,900 1 - - - - - - - - - - 131,600 1CUTOFF SAW 1 - - - - - - 1,700 1 - - - - - - - - - - - -DEHUMIDIFIER 1 - - - - - - - - - - 7,600 1 - - - - - - - -DUMP W/ CRANE 0 - - - - - - - - - - - - - - - - - - - -EMISSION TESTER 1 - - - - 35,400 1 - - - - - - - - - - - - - -EPOKE SALT/SANDER 1 - - - - - - - - 102,400 1 - - - - - - - - -EXHAUST SYSTEM 2 - - - - - - - - - - - - - - - - - - - -FALL ARREST SYSTEM 1 - - - - - - - - - - - - - - - - - - - -FILTER CART 1 - - - - - - - - - - - - - - - - - - - -FLUSHER 0 - - - - - - - - - - - - - - - - - - - -FORKLIFT 1 - - - - - - 46,500 1 - - - - - - - - - - - -FUEL COMPUTERS 4 - - 47,197 3 - - - - - - - - - - - - - - - -FUEL SYSTEM 5 150,000 1 - - 112,000 1 - - - - - - - - - - - - - -FUEL TANK MONITOR 1 - - 18,631 1 - - - - - - - - - - - - - - - -GATOR CAM 1 - - - - 17,000 1 - - - - - - - - - - - - - -GENERATOR 4 - - - - - - - - - - - - 13,000 1 19,200 1 - - - -GRADER 1 - - 300,469 1 - - - - - - - - - - - - - - - -361
<strong>City</strong> <strong>of</strong> <strong>Guelph</strong> - FleetVehicle & Equipment Replacement Summary (Project # GG0187)INVENTORYANNUAL REPLACEMENT# In<strong>2013</strong>2014 2015 2016 2017 2018 20192020 2021 2022Inventory $ # $ # $ # $ # $ # $ # $ # $ # $ # $ #GRINDER 1 - - - - - - - - - - - - - - - - - - - -HANDHELD BLOWER 0 - - - - - - - - - - - - - - - - - - - -HEDGE TRIMMER 0 - - - - - - - - - - - - - - - - - - - -HOOK-LIFT FLAT BED 1 - - - - - - - - - - - - 229,200 1 - - - - -HOIST 8 35,000 1 17,000 1 - - 223,300 1 - - - - - - - - - -JACK 3 9,400 1 22,874 2 - - - - - - - - - - - - - - - -LOADER 2 - - - - 240,900 1 - - 303,700 1 - - - - - - - - - -LUBRICATION PUMPS 1 - - - - - - - - - - - - - - - - - - - -MAIL VAN 1 - - - - 39,700 1 - - - - - - - - - - - - - -MIXER 1 - - - - - - - - - - - - - - - - - - - -OIL SYSTEM 1 - - 42,954 1 - - - - - - - - - - - - - - - -PARTS WASHER 2 - - - - - - - - - - - - - - - - - - 23,900 1PAVER 1 - - - - - - - - - - 53,300 1 - - - - - - - -PICKUP 4X4 QC 1 - - 48,750 1 - - - - - - - - - - 53,800 1 - - -POLE SAW 1 - - - - - - 1,500 1 - - - - - - - - 1,800 1 - -POST POUNDER 1 - - - - - - - - - - - - - - - - - - - -POWER PACK 1 - - - - - - - - - - - - - - - - - - - -POWER STEER FLUID MACH 1 - - - - - - - - - - - - 7,800 1 - - - - - -POWER WASHER 1 - - - - - - - - 20,800 1 - - - - - - - - - -PRESSURE WASHER 1 - - - - - - - - - - - - - - - - - - - -PUMP 3 - - - - - - 13,500 2 - - - - - - - - - - - -RADIO SYSTEM 1 - - 115,923 1 - - - - - - - - - - - - - - - -ROAD SAW 1 - - 22,874 1 - - - - - - - - - - - - - - - -RODDER 0 - - - - - - - - - - - - - - - - - - - -ROLLER 4 - - 145,939 3 - - - - - - - - - - - - 75,500 1 - -ROTOTILLER 1 - - - - - - - - - - - - - - - - - - - -SAND BLASTER 1 - - - - - - - - - - - - - - - - - - - -SCREENER 0 - - - - - - - - - - - - - - - - - - - -SEWER CLEANER 1 - - - - - - - - - - - - - - - - - - - -SEWER FLUSHER 1 - - 436,471 1 - - - - - - - - - - - - - - - -SHOP PRESS 1 - - - - - - - - - - - - 10,400 1 - - - - - -SMALL SHOP WASHER 1 - - - - - - - - - - - - - - - - - - - -SNOW BLOWER 4 - - 12,731 3 - - - - - - 110,900 1 14,500 3 - - - - - -STEAMER 1 - - - - - - - - 11,700 1 - - - - - - - - 15,200 1STUMP CUTTER 1 - - - - - - 62,200 1 - - - - - - - - - - - -SWEEPER 3 - - - - - - 43,600 1 - - - - - - - - 346,600 1 320,000 1TAMPER 6 7,400 1 10,764 2 - - - - 16,400 2 - - - - 9,000 1 - - 16,400 2TANDEM DUMP 10 - - - - - - 392,100 2 - - - - 1,228,500 5 240,500 1 - - 680,000 2TANDEM TRAILER 2 - - - - - - - - - - - - - - - - - - - -TAPPING MACHINE 1 - - - - - - - - - - - - - - - - - - - -TIRE BALANCER 1 - - - - - - - - - - 7,600 1 - - - - - - - -TIRE MACHINE 1 - - - - - - - - - - - - 10,400 1 - - - - - -TOOL TRAILER 1 - - - - - - 19,500 1 - - - - - - - - - - - -TOOL WAGON 0 - - - - - - - - - - - - - - - - - - - -TRACKLESS 11 - - - - - - 162,700 1 666,800 4 - - 338,000 2 - - 342,000 2 625,675 4TRACTOR 2 - - - - - - - - - - - - 61,000 1 73,300 1 - - - -TRACTOR BROOM 1 - - - - - - 101,700 1 - - - - - - - - - - - -TRAILER 7 - - - - 5,700 1 2,900 1 - - - - 6,000 1 - - 7,700 1 - -UTILITY 1 - - - - - - - - 81,900 1 - - - - - - - - - -VACALL 0 - - - - - - - - - - - - - - - - - - - -VACTOR TRUCK 1 - - - - - - - - - - - - 352,000 1 - - - - -VEHICLE SCAN SOFTWARE 1 - - - - 8,500 1 - - - - - - - - - - - - - -WELDER 2 - - - - - - - - - - - - - - 16,000 1 - - - -Sub-total Public Works 186 866,800 17 1,344,398 23 787,300 19 1,342,700 19 1,929,700 27 261,300 5 2,270,800 18 1,339,000 14 1,852,200 17 3,168,675 28Traffic ServicesCAR 1 - - - - - - 22,700 1 - - - - - - 24,400 1 - - - -Sub-total Traffic Services 1 - - - - - - 22,700 1 - - - - - - 24,400 1 - - - -Public Works Traffic1/2 TON PICKUP 0 - - - - - - - - - - - - - - - - - - - -3/4 TON PICKUP 2 59,000 2 - - - - - - 71,400 2 - - - - - - - - 115,500 3HIGH ROOF VAN 58,500 1AERIAL 1 300,000 1 - - - - - - - - - - - - - - - - - -AERIAL F-350 1 - - - - - - 159,800 1 - - - - - - - - - - - -CUBE VAN 1 95,000 1 - - - - - - - - - - - - - - - - - -CUTOFF SAW 1 - - - - - - - - - - - - - - - - - - - -ERT TRAILER 1 - - - - - - - - - - - - - - - - - - - -FORD F250 PICKUP 1 29,500 1 - - - - - - - - - - 32,100 1 - - - - -GENERATOR 4 - - - - - - - - - - - - - - - - - - - -GRINDER 1 - - - - - - - - - - - - - - - - - - - -PAINT MACHINE 3 - - - - - - - - 17,900 1 13,400 1 - - - - - - - -POLE TRAILER 1 - - - - - - - - - - - - - - - - - - - -POST POUNDER 1 - - - - - - - - - - - - - - - - - - - -SPRINTER W/POST PULLER 1 - - - - - - - - - - 97,700 1 - - - - - - -TRAILER 4 - - - - - - - - - - - - - - 6,100 1 - - - -UTILITY S-DUTY 0 - - - - - - - - - - - - - - - - - - - -Sub-total Public Works Traffic 23 483,500 5 - - - - 159,800 1 89,300 3 111,100 2 32,100 1 6,100 1 - - 174,000 4Parking3/4 TON PICKUP 1 - - - - - - - - 38,700 1 - - - - 40,300 1 - - - -3/4 TON PICKUP 4X4 1 - - 57,237 1 - - - - - - - - - - - - - - - -362
<strong>City</strong> <strong>of</strong> <strong>Guelph</strong> - FleetVehicle & Equipment Replacement Summary (Project # GG0187)INVENTORYANNUAL REPLACEMENT# In<strong>2013</strong>2014 2015 2016 2017 2018 20192020 2021 2022Inventory $ # $ # $ # $ # $ # $ # $ # $ # $ # $ #BK BLOWER 0 - - - - - - - - - - - - - - - - - - - -CAR 3 - - 45,955 2 - - 22,700 1 47,800 2 - - - - - - - - 33,800 1COMPACT PICKUP 2 22,500 1 - - - - - - 52,300 2 - - - - - - - - 66,300 2DODGE CAR 1 60,000 1 - - 23,400 1 - - - - 25,200 1 - - - - - - -JD TRACTOR 0 - - - - - - - - - - - - - - - - - - - -LAWN MOWER 0 - - - - - - - - - - - - - - - - - - - -POWER WASH 1 - - - - - - - - - - - - - - - - - - - -SNOW BLOWER 1 - - 2,588 1 - - - - - - - - - - - - - - - -SWEEPER 1 - - - - 42,500 1 - - - - - - - - - - - - - -STREET VAC 1 - - - - - - - - - - - - - - - - 120,000 1 - -TRACKLESS 2 1 160,222 1 - - - - - - - - - - 182,400 1 - - - -Sub-total Parking 14 82,500 3 266,002 5 65,900 2 22,700 1 138,800 5 25,200 1 - - 222,700 2 120,000 1 100,100 3363
<strong>City</strong> <strong>of</strong> <strong>Guelph</strong> - FleetVehicle & Equipment Replacement Summary (Project # GG0187)INVENTORYANNUAL REPLACEMENT# In<strong>2013</strong>2014 2015 2016 2017 2018 20192020 2021 2022Inventory $ # $ # $ # $ # $ # $ # $ # $ # $ # $ #Wet/Dry3 YARD LOADER 3 - - - - 368,400 1 - - 387,100 1 - - - - - - - - - -3/4 TON PICKUP 2 29,500 1 - - - - - - 71,400 2 - - - - - - - - 38,500 13/4 TON PICKUP 4X4 2 - - - - - - - - - - - - - - - - 123,400 2 - -6 YARD LOADER 1 438,400 1 - - - - - - - - - - - - - - - - 400,600 1FORKLIFT 2 43,000 1 - - - - 46,500 1 - - - - - - - - - - - -LAWN MOWER 0 - - - - - - - - - - - - - - - - - - - -LIFT PLATFORM 1 - - - - - - 65,400 1 - - - - - - - - - - - -ROLL-OFF TRUCK 2 - - - - - - - - 495,800 2 - - - - - - - - -SKID STEER 2 - - 102,468 2 - - - - 106,600 2 - - - - 56,000 1 - - - -SNOW BLOWER 1 - - - - - - - - - - - - - - - - - - - -WELDER 1 - - - - - - 29,000 1 - - - - - - - - - - - -WEEDEATER 0 - - - - - - - - - - - - - - - - - - - -Sub-total Wet/Dry 17 510,900 3 102,468 2 368,400 1 140,900 3 1,060,900 7 - - - - 56,000 1 123,400 2 439,100 2TOTAL EXPENDITURE $3,082,100 60 $2,579,600 62 $1,700,000 31 $2,290,500 46 $3,998,200 63 $3,829,500 25 $4,777,900 61 $3,606,100 37 $2,780,200 41 $4,412,400 55364
<strong>City</strong> <strong>of</strong> <strong>Guelph</strong> - TransitVehicle Replacement Summary (Project Number TC0008)InventoryAnnual Replacement# In<strong>2013</strong> 2014 2015 2016 2017 2018 2019 2020 20212022Vehicle Type Inventory $ # $ # $ # $ # $ # $ # $ # $ # $ # $ #Vehicle ReplacementConventional Buses 65 1,374,000 3 1,980,153 4 1,800,000 4 1,840,000 4 2,087,200 4 2,187,600 4 2,238,000 4 2,280,800 4 2,390,400 4 2,672,000 4Mobility Buses 7 - - - - - - - - 633,800 3 437,600 2 - - 692,600 3Other Vehicles:Passenger Van 2 - - - - - - - - 80,600 1 - - - - - - - - - -Service Vehicle 1 - - - - - - - - - - - - - - - - - - - -SUV - Hybrid 1 35,000 1Pickup Trucks 1 - - - - - - - 40,300 1 - - - - - - - - - -Floor Sweeper 1 - - - - - - 37,500 1 - - - - - - - - - - - -Fork Lift 1 - - - - - - 37,500 1 - - - - - - - - - - - -Total Other Vehicles 7 - - - - - - 110,000 3 120,900 2 - - - - - - - - - -Bus rebuilds 145,000 1 127,147 1 - - - - - - - - - - - - - - - -Total Vehicle Replacement & Rebuilds 1,519,000 4 2,107,300 5 1,800,000 4 1,950,000 7 2,208,100 6 2,821,400 7 2,675,600 6 2,280,800 4 3,083,000 7 2,672,000 4365
<strong>City</strong> <strong>of</strong> <strong>Guelph</strong> - Traffic Signal EquipmentEquipment Replacement Summary (Project Number TF0003)<strong>2013</strong> 2014 2015 2016 2017 2018 2019 2020 2021 2022Traffic Signal Rebuilds & Replacements 114,000 303,000 300,000 380,000 390,000 400,000 410,000 420,000 430,000 440,000TOTAL EXPENDITURE $ 114,000 $ 303,000 $ 300,000 $380,000 $390,000 $400,000 $410,000 $420,000 $430,000 $440,000366
<strong>City</strong> <strong>of</strong> <strong>Guelph</strong> - <strong>Guelph</strong> Police ServicesVehicle Replacement Summary (Project PS0057)<strong>2013</strong> 2014 2015 20162017 2018 2019 2020 2021 2022Vehicle Type # $ # $ # $ # $ # $ # $ # $ # $ # $ # $ #Uniform Patrol Vehicles - Full-Size 14 248,000 8 158,000 5 258,400 8 197,400 6 302,400 9 205,200 6 349,000 10 213,600 6 363,000 10 259,000 7Uniform Patrol Vehicles - Utility 4 72,000 2 73,400 2 - - 76,400 2 78,000 2 - - 81,000 2 82,800 2 - - 86,000 2Uniform Patrol Motorcycles 3 - - - - - - - - - - - - - - 69,000 2 - - - -Canine Unit Vehicles 2 - - - - 37,500 1 38,200 1 39,000 1 - - - - 41,400 1 42,200 1 43,000 1Traffic Vehicles - Full-Size 1 - - - - 64,600 2 - - - - 68,400 2 - - - - 72,600 2 - -Traffic Vehicle - Charger 1 27,200 1 - - - - 28,900 1 - - - - 30,600 1 - - - - 32,500 1Traffic Vehicle - Utility 2 36,000 1 - - - - 38,200 1 - - - - 40,500 1 - - - - 43,000 1CET Vehicles 5 50,000 5 51,000 5 52,000 5 53,000 5 54,000 5 22,000 2 56,500 5 57,500 5 58,500 5 60,000 5Investigative Support Vehicles 9 51,200 2 67,200 3 68,700 3 23,300 1 23,800 1 72,900 3 74,400 3 25,300 1 25,800 1 113,800 4Intelligence Support Vehicles 7 48,000 4 24,400 2 50,000 4 25,400 2 52,000 4 26,400 2 54,000 4 27,600 2 56,400 4 28,600 2Prisoner Transport Vehicle (Chassis only) 1 - - - - - - - - 33,300 1 - - - - - - - - - -- Insert for Prisoner Van - - - - - - - - - - - - 18,200 1 - - - - - -School Program Vehicles 6 - - - - - - - - - - - - 27,000 1 - - - - - -Tactical Vehicles 3 43,000 1 - - - - - - - - 47,500 1 - - 57,400 2 - - - -Summons/Warrants Vehicle 1 - - 22,400 1 - - - - - - 24,300 1 - - - - - - 26,300 1Community Relations Vehicle 1 - - - - - - - - 23,800 1 - - - - - - - - - -Court Security Vehicles 2 31,000 1 - - - - - - - - 34,200 1 34,900 1 - - - - - -Command Centre Vehicle (shared with F 1 - - 364,100 1 - - - - - - - - - - - - - - - -Administrative/Pooled Vehicles 4 - - 22,400 1 32,300 1 - - - - 58,500 2 - - - - 36,300 1 26,300 1TOTAL EXPENDITURE 67 $ 606,400 25 $ 782,900 20 $ 563,500 24 $ 480,800 19 $ 606,300 24 $ 559,400 20 $ 766,100 29 $ 574,600 21 $ 654,800 24 $ 718,500 25REVENUESchool Liaison Program-School Board Funding 8,000 8,000 8,000 8,000 8,000 8,000 8,000 8,000 8,000TOTAL REVENUE $ 8,000 $ 8,000 $ 8,000 $ 8,000 $ 8,000 $ 8,000 $ 8,000 $ 8,000 $ 8,000 $ -Net Funding from Reserve $ 598,400 $ 774,900 $ 555,500 $ 472,800 $ 598,300 $ 551,400 $ 758,100 $ 566,600 $ 646,800 $ 718,500** School Liaison Program funds are subject to School Boards approval annually.367
chapter 7<strong>2013</strong>Enterprise <strong>Budget</strong>368
Enterprise <strong>Budget</strong>>> OverviewThe <strong>City</strong> <strong>of</strong> <strong>Guelph</strong>’s Enterprise (Non-Tax Supported) <strong>Budget</strong> includes the Ontario Building Code (OBC), WaterServices, Wastewater Services and Court Services. An enterprise-funded budget is a budget that is selfsupportingand does not require a property tax transfer. For the <strong>City</strong> <strong>of</strong> <strong>Guelph</strong>, the costs <strong>of</strong> the respectiveservice areas will be 100 per cent recovered through user fees and other, non-tax supported, revenues.This document provides the proposed operating and capital budgets for the upcoming year (<strong>2013</strong>) andprojections for capital expenditures for the next nine years (2014 – 2022) for each <strong>of</strong> the four departments. Todevelop viable and sustainable operating and capital budgets, a budget calendar was developed to ensurethe budget process facilitates input from all levels <strong>of</strong> the organization and community.<strong>2013</strong> Enterprise Funded (non-tax-supported) <strong>Budget</strong> ProcessKey DatesJuly–August 2012September 28, 2012October 3, 2012October 10, 2012October 24, 2012November 6, 2012Enterprise Funded (Non-Tax Supported) <strong>Budget</strong>Enterprise Funded <strong>Budget</strong> Development and Transition to Multi-year <strong>Budget</strong>ingDraft Enterprise Funded <strong>Budget</strong> to Enterprise TeamFinal Executive Team Review>> <strong>Budget</strong> ApproachDistribution <strong>of</strong> Enterprise Funded Operating and Capital <strong>Budget</strong>s to CouncilPresentation, Deliberation and Approval <strong>of</strong> Enterprise Operating and Capital <strong>Budget</strong>s (Delegations welcome)Alternate Approval Date for Enterprise <strong>Budget</strong>sThe <strong>2013</strong> Enterprise <strong>Budget</strong>s mark the second year in a corporate transition to Service based budgeting.Service based budgeting can assist Council and Management in decision making and support by providingthe information required:• To ensure the alignment <strong>of</strong> services being provided with the Corporate Strategic Plan• To allow better Corporate and departmental business planning• To develop service performance measurement• To analyze optimal organization structure and alternative methods <strong>of</strong> service delivery<strong>City</strong> <strong>of</strong> <strong>Guelph</strong> – <strong>2013</strong> Enterprise <strong>Budget</strong>369
Enterprise <strong>Budget</strong>The <strong>2013</strong> Enterprise Funded <strong>Budget</strong> has been developed using a more transparent and collaborative approachin order to:• Maximize financial and management information for the <strong>City</strong>’s corporate decision-making processes byimproving the timeliness <strong>of</strong> information by transitioning the Enterprise Funds to a service-based budget.This form <strong>of</strong> budgeting will provide information <strong>of</strong> the total cost <strong>of</strong> each service provided including thedirect, indirect and capital costs• Ensure all capital projects are fully funded in accordance with debt and reserve management best practiceswith a balance between infrastructure maintenance, growth initiatives and new regulatory or legislativerequirements• Align services and projects with the Corporate Strategic Plan and Environmental, Economic, Social andCultural pillars <strong>of</strong> sustainability<strong>City</strong> <strong>of</strong> <strong>Guelph</strong> – <strong>2013</strong> Enterprise <strong>Budget</strong>370
Water and WastEWAter Services Rate OverviewThe Water and Wastewater rates are comprised <strong>of</strong> variable rates (dependent on volume used) and fixed rates(basic service charges). The <strong>2013</strong> budget is requesting a change to the rates as noted in the following table:Summary <strong>of</strong> Rate Changes and Impact on Average Residential Water/Wastewater Annual Bill (365 Days)2012 <strong>2013</strong> ChangeWater Volume Charge - $/cubic metre (m3) $1.30 $1.38 $0.08Water Basic Charge - $/day $0.22 $0.24 $0.02Wastewater Volume Charge - $/cubic metre (m3) $1.41 $1.52 $0.11Wastewater Basic Charge - $/day $0.30 $0.31 $0.01Average Residential Annual Bill (200* cubic metres consumption, January 1 rate change) $723 $781 $58 or 8.0%*A volume <strong>of</strong> 200 cubic metres represents staff’s projection <strong>of</strong> the average annual volume <strong>of</strong> water consumed by a <strong>Guelph</strong> family <strong>of</strong> 3 persons.Note: the <strong>2013</strong> rates identified in the chart above are reflective <strong>of</strong> a January-December billing cycle. This is in coordination with the pending rate change done by <strong>Guelph</strong>Hydro and avoids the need for a blended rate and pro-rating <strong>of</strong> bills.Utilities and capital financing represent the largest increase to the Water and Wastewater <strong>Budget</strong>s. Of the8.0 per cent average residential annual bill increase utilities and capital financing represents 0.94 per centand 6.78 per cent respectively.Although the average residential bill is increasing by 8.0 per cent, the Water and Wastewater operatingbudgets are increasing by 2.2 per cent and 3.1 per cent respectively, net <strong>of</strong> capital financing. This iscomparable to the 3 per cent guideline used in the development <strong>of</strong> the <strong>City</strong>’s tax-supported andoperating budget.<strong>City</strong> <strong>of</strong> <strong>Guelph</strong> – <strong>2013</strong> Enterprise <strong>Budget</strong>371
Water and WastEWAter Rate ForecastsBoth the Water and Wastewater 2011 Operating <strong>Budget</strong>s closed with significant surpluses as a result <strong>of</strong> thecollection <strong>of</strong> more rate revenue than forecast. Water rate revenue exceeded the budget projection byapproximately 6.5 per cent or $1.02 million while Wastewater collected approximately 4.5 per cent or $0.76million more rate revenue than forecast. This positive year end position for both budgets follows past years,most significantly the beginning <strong>of</strong> the past recession, when rate revenue fell significantly below forecast. Rateforecasting is a challenging process. Staff prepares conservative but complex forecasts taking into accountmany drivers including historical residential, industrial, commercial, and institutional (ICI) consumption, growthforecasts, climatic impacts, conservation and efficiency program gains, and demand impacts from changingeconomic pressures. Generally annual revenues fall within 1-2 per cent <strong>of</strong> forecasted revenue, but during times<strong>of</strong> significant and fast-paced change to one or many forecasting variables, the variation between forecast andactual revenue has grown. In recent years, ICI consumption changes driven by the start <strong>of</strong> and recovery fromthe recession, and abnormally wet and dry peak seasonal conditions, have lead to less accurate forecasts. TheWater and Wastewater Stabilization reserves are funded from operating budget surpluses, including raterevenue surpluses, and are used to stabilize future rate increases and cushion revenue forecast deficits. Indoing so, these reserves provide financial stability for the utilities and rate and bill stability for customers. Thepositions <strong>of</strong> these reserves are reviewed annually during operating budget preparations to ensure acceptablereserve ratios and targets are maintained (per council policy) while minimizing future customer water andwastewater rates and bills.The <strong>2013</strong> projections for billable consumption for Water and Wastewater are estimated to be 0.9 per centlower in both cases than 2012 actuals, mainly due to decreases in seasonal water demand, stable ICI sectorwater use, and continued implementation <strong>of</strong> conservation actions across all customer sectors. In previousannual forecasts, additional new billable water demands have also been added as the result <strong>of</strong> anticipatednew residential and ICI customer growth. Through analysis <strong>of</strong> annual building permits issued and other relatedgrowth indicators, new residential demands have been included within the <strong>2013</strong> forecast, but no additionalsignificant ICI demands have been included following consultation with the <strong>City</strong>’s Engineering ServicesDepartment regarding planned short-term growth within this sector.Projections <strong>of</strong> the Water rates over the next three years show an increase to approximately $1.65 per cubicmeter to maintain the provision <strong>of</strong> safe drinking water, ensure the timely replacement <strong>of</strong> the <strong>City</strong>’s Waterinfrastructure, and to service growth. Although the Water Rate Stabilization Reserve has increased, it remainsbelow the 10 per cent target recommended in the Council approved Water and Wastewater Long-RangeFinancial Plan 2010 (Financial Plan). Although trending upwards, the Water Capital Reserve is similarly belowtarget with respect to accumulated depreciation <strong>of</strong> our infrastructure accounting for projected actualreplacement costs.Projections <strong>of</strong> the Wastewater rates over the next three years show an increase to $1.77 per cubic meter tomaintain the legislated level <strong>of</strong> treatment for wastewater, to ensure the timely replacement <strong>of</strong> the <strong>City</strong>’sWastewater infrastructure, and to service growth. As with Water, the Wastewater Rate Stabilization Reserve isbelow the 10 per cent target recommended in the Financial Plan and the Wastewater Capital Reserve,although trending upwards, is well below target with respect to accumulated depreciation <strong>of</strong> ourinfrastructure accounting for actual replacement costs.<strong>City</strong> <strong>of</strong> <strong>Guelph</strong> – <strong>2013</strong> Enterprise <strong>Budget</strong>372
Water and WastEWAter Rate ForecastsFor both Water and Wastewater, there is currently no rate-supported debt (all debt has been retired) and theprojected rates assume no new rate-supported debt funding. In addition, the goal is for our water/wastewaterrates to remain near the average <strong>of</strong> comparative municipalities.Similar to a rate setting methodology employed by the <strong>City</strong> <strong>of</strong> Toronto, Town <strong>of</strong> Markham, <strong>City</strong> <strong>of</strong> Barrie,Regional Municipality <strong>of</strong> York, and <strong>City</strong> <strong>of</strong> Hamilton, and as recommended by staff and approved by Council forthe 2010 to 2012 budgets, staff continues to recommend an annual residential bill increase near 10 per centfor the <strong>2013</strong> budget. This approach will be reviewed in conjunction with the revenue requirements identifiedin the 2012 Sustainable Infrastructure Report and the updated Financial Plan prior to developing the 2014 andfuture budgets. The following table shows the recent trends for the volumetric rate.Water and Wastewater Volume Charges Trend2009 2010 2011 2012<strong>2013</strong>Proposed2014Projected*2015Projected*2016Projected*Water Volume Charge(per m3) $0.97 $1.07 $1.17 $1.30 $1.38 $1.53 $1.65 $1.74Wastewater Volume Charge (per m3) $1.05 $1.15 $1.26 $1.41 $1.52 $1.65 $1.77 $1.90Annual Percent Increase 18.8% 9.9% 9.5% 11.5% 8.0% 8.1% 6.6% 5.7%*Note: Forecast based on current service level and legislationThe 2012 Water and Wastewater <strong>Budget</strong>s introduced Council to a simplified rate comparison betweencomparator municipalities to best illustrate the number <strong>of</strong> factors that impact a water and wastewater bill. Thechart that follows compares the <strong>City</strong>’s approved 2012 combined water and wastewater rates with those <strong>of</strong> ourCouncil-approved comparator municipalities.<strong>City</strong> <strong>of</strong> <strong>Guelph</strong> – <strong>2013</strong> Enterprise <strong>Budget</strong>373
Water and WastEWAter Rate Comparison$6.00Comparison <strong>of</strong> Residential Water/Wastewater Total Volumetric and Service Charges by Municipality (2012 Rates)$5.00$4.00$3.00$2.00$1.00$0.00WindsorKingstonRegion <strong>of</strong> PeelBarrieChatham-KentHalton RegionNiagara FallsDurham RegionHamiltonGreater SudburyVaughanMarkhamRichmond HillTotal Volumetric Charges ($/cubic metre)Thunder BaySt. CatherinesOttawaBrantfordCambridge<strong>Guelph</strong>Total Daily Service Charges ($/day)OrangevilleWaterlooLondon<strong>Guelph</strong>/Eramosa (Rockwood)KitchenerCentre WellingtonStratfordMunicipal residential customer comparison <strong>of</strong> charges is based on combined volume charges for first cubicmeter <strong>of</strong> water consumption, wastewater treatment and daily service charges.<strong>City</strong> <strong>of</strong> <strong>Guelph</strong> – <strong>2013</strong> Enterprise <strong>Budget</strong>374
Water and WastEWAter Financial IndicatorsThe chart below summarizes Water and Wastewater financial indicators and targets based on both Council’sfinancial policies and the Council approved Water/Wastewater Financial Plan. The proposed <strong>2013</strong> Water andWastewater budgets ensure both departments will meet these targets in <strong>2013</strong> and in the near future.<strong>2013</strong> Water and Wastewater Financial IndicatorsTarget<strong>2013</strong>Predictionsfrom WaterLTFPActualsWater<strong>2013</strong>Predictions fromWastewaterLTFPActualsWastewaterDebt to Total Reserve Ratio < 1:1 0:1 0:1 0:1 0:1Operating Reserves as a % <strong>of</strong> Own Source Revenue8 - 10% <strong>of</strong>8.5% 8.6% 8.1% 8.4%RevenuesCapital Reserves as a % <strong>of</strong> Asset Value 2-3% 5.5% 8.2% 5.5% 7.5%Operating Surplus Ratio Positive Positive Positive Positive PositiveAsset Consumption Ratio 35% n/a 44.8% n/a 51.7%*LTFP = Long Term Financial Plan as approved by CouncilDebt to Total Reserve Ratio: a measure comparing the direct debt <strong>of</strong> the operation to the total <strong>of</strong> all ratesupported reserves and reserve funds. The generally accepted target is 1:1. (Note - Water and Wastewater aredebt free.)Operating Reserves as a percentage <strong>of</strong> Own Source Revenue: this measure focuses specifically on thestabilization reserves for Water and Wastewater compared to own revenues. Having operating reserves withinthe benchmark will allow both areas to avoid spikes in the user rates, if faced with dramatic change such as aneconomic decline or new legislation.Capital Reserves as a percentage <strong>of</strong> Asset Value: this measure provides insight on the level <strong>of</strong> reservefunding for future capital projects, compared to the total value <strong>of</strong> depreciable assets. The general rule is capitalreserve contributions should be approximately 2-3 per cent <strong>of</strong> the total asset value. This prevents suddenspikes in the user rate by spreading the cost <strong>of</strong> infrastructure over several years, and provides contingency forsignificant unexpected infrastructure costs. Asset Values are low as they are based on original purchase valueand not replacement value. For this reason, Capital Reserves as a percentage <strong>of</strong> Asset Value is lower than thevalues shown above. Capital reserves need to increase to address the risk to service sustainability.<strong>City</strong> <strong>of</strong> <strong>Guelph</strong> – <strong>2013</strong> Enterprise <strong>Budget</strong>375
Water and WastEWAter Financial IndicatorsOperating Surplus Ratio: this measure provides insight on how much <strong>of</strong> the department’s own sourcerevenues were available after normal operations to fund reserves. In <strong>2013</strong>, both Water and Wastewater arebudgeting to have higher reserve contributions when compared to 2012.Asset Consumption Ratio: a measure <strong>of</strong> the condition <strong>of</strong> a municipality’s assets and the potentialreplacement needs. A higher ratio may indicate significant replacement needs, however, if a replacement planis in place and followed, a high ratio is not necessarily cause for concern. Ratios for both Water and Wastewaterindicate an aging infrastructure, making contributions to reserve critical to meet current and futurereplacement needs.NOTE: Both capital reserves as a percentage <strong>of</strong> asset value and the asset consumption ratio are measured using historical assetcosts. A more appropriate measure would be replacement cost which will be used for these measures once calculated. However,replacement cost will cause these measures to look significantly worse,<strong>City</strong> <strong>of</strong> <strong>Guelph</strong> – <strong>2013</strong> Enterprise <strong>Budget</strong>376
<strong>2013</strong> Water Services <strong>Budget</strong>The Water Services department ensures a safe, secure and sustainable water supply for residential, business,recreation and firefighting purposes.Customer Service and Conservation Supply, Treatment and Protection Distribution and Metering• Revenue collection and relatedcustomer service• Mandatory staff training and development• Compliance and conformance programs• Educate, promote and support the efficientuse <strong>of</strong> water resources, includingimplementing water conservationprograms• Capital component <strong>of</strong> conservationprograms• Provide customer service andcommunications• Provide secure, treated supply <strong>of</strong> water tothe water distribution system• Implement programs to ensureenvironmental compliance• Implement programs to comply withProvincially mandated groundwater• protection requirements• Implement backflow prevention programs• Perform infrastructure planning, capacity• management, and construction related tosupply assets• Provide secure, continuous supply <strong>of</strong> waterto all customers and for fire fighting• Operate and maintain related infrastructureincluding bulk water supply• Perform infrastructure planning,replacement, capacity management,and construction• related to linear assets• Note: The capital budget for theEngineering Services department includesexpenditures associated with planning,designing, building and replacing waterinfrastructure.<strong>City</strong> <strong>of</strong> <strong>Guelph</strong> – <strong>2013</strong> Enterprise <strong>Budget</strong>377
<strong>2013</strong> Water Services <strong>Budget</strong>>> 2012 Accomplishments• Continued high scores for Ministry <strong>of</strong> the Environment Compliance Inspection• Reclaimed more than 1,800 m3/day in water service capacity through the Water Conservation andEfficiency Program, including a 1,300 m3/day reduction in water loss during distribution through the LeakDetection Pilot Program. Sustained reductions through these initiatives lead to lower operating costs anddeferred capital upgrades to service growth.• Completed <strong>Guelph</strong>’s portion <strong>of</strong> the draft Source Protection Plan for the Grand River Watershed• Ongoing implementation <strong>of</strong> the Arkell Adaptive Management Plan to secure sustainable new groundwatersupplies• Secured over $1 million in grant funding from the Province’s Showcasing Water Innovation Program for<strong>Guelph</strong>’s Water Distribution System Efficiency Project and Transit Bus Wash Rainwater Harvesting and WaterReuse Project• First recipient <strong>of</strong> the Canada Water Week Award <strong>of</strong> Recognition, as presented by the Walter and DuncanGordon Foundation, World Wildlife Fund – Canada and Living Lakes Network Canada• Continued significant progress delivering the provincially-mandated lead reduction program• Completed the Paisley-Clythe Feedermain Environmental Assessment• Ongoing implementation <strong>of</strong> Water/Wastewater Servicing Master Plan projects including stages <strong>of</strong>Speedvale Avenue trunk watermain and Clair Road trunk watermain• Continued watermain replacement in conjunction with road reconstruction projects<strong>City</strong> <strong>of</strong> <strong>Guelph</strong> – <strong>2013</strong> Enterprise <strong>Budget</strong>378
<strong>2013</strong> Water Services <strong>Budget</strong>>> Key Performance MeasuresWater Pumpage and Consumption<strong>Guelph</strong> Water Production vs. Water Consumption vs. PopulationWater Use (cubic metres/day)70,00065,00060,00055,00050,00045,00040,00035,000125,000120,000115,000110,000105,000Population30,0002003 2004 2005 2006 2007 2008 2009 2010 2011 2012100,000Peak DayAverage Daily Production<strong>Guelph</strong> PopulationAverage Daily Consumption<strong>City</strong> <strong>of</strong> <strong>Guelph</strong> – <strong>2013</strong> Enterprise <strong>Budget</strong>379
<strong>2013</strong> Water Services <strong>Budget</strong>SourceAverage daily production and peak day production data is measured by operational water supply sourcemeters. Average day production is calculated by dividing annual total source production in cubic metres bythe number <strong>of</strong> days in each calendar year. Peak day production is the highest amount <strong>of</strong> water produced inone given day within the calendar year. Annual water consumption is directly measured by customer billingmeters. Average daily consumption is calculated by dividing the total annual consumption in cubic meters bythe number <strong>of</strong> days in each calendar year. The reported 2012 water production, consumption, and populationinformation is based on data from the period <strong>of</strong> January 1 to July 31, 2012. Population estimations for 2012 toJuly 31 were provided by the <strong>City</strong>’s Planning Services Department.Explanation <strong>of</strong> TrendSince 2003 there has been an overall reduction in average daily water production <strong>of</strong> 11% (5,700m3/day) and areduction in average daily water consumption <strong>of</strong> 15.5% (6,700 m3/day), while population has steadilyincreased by 13,380 people (12.2%). To date, peak daily water production for 2012 is 5,650 m3 less than 2011peak day demand. Even with prolonged above average temperatures and limited precipitation in 2012,average daily consumption is 6.8% (2,700 m3/day) lower than the previous year that was also unseasonablywarm and dry. This drop in demand is largely attributed to the community’s response and compliance toelevated Outside Water Use program levels during the peak season, continued participation in the <strong>City</strong>’s waterconservation program, and implementation <strong>of</strong> associated behavioural changes amongst numerous sectorswithin the community.<strong>City</strong> <strong>of</strong> <strong>Guelph</strong> – <strong>2013</strong> Enterprise <strong>Budget</strong>380
<strong>2013</strong> Water Services <strong>Budget</strong>Residential Water Consumption Per Capita<strong>City</strong> <strong>of</strong> <strong>Guelph</strong> Average Household Water Consumption225Water Use Per Household (cubic metres/year)22021521020520019519022020072122008205200920320102012011Notes: Household demand based on annual average per capita water use, and three people per household. Data regarding average2012 residential per capita water demand was not available at time <strong>of</strong> draft budget publication.<strong>City</strong> <strong>of</strong> <strong>Guelph</strong> – <strong>2013</strong> Enterprise <strong>Budget</strong>381
<strong>2013</strong> Water Services <strong>Budget</strong>SourceResidential water consumption data measured by customer billing meters. Total residential populationinformation is provided by the <strong>City</strong>’s Planning Services Department.Explanation <strong>of</strong> TrendResidential daily per capita water consumption has decreased by almost 19 litres per day between 2007 and2011. This progressive decrease can be attributed to ongoing participation in conservation programs,increased public education, and behavior changes driven by the economy including increased water andwastewater rates. <strong>Guelph</strong>’s residential consumption is lower than the provincial and national averages <strong>of</strong> 225and 274 litres per capita per day, respectively.Annual Provincial Compliance Inspection ResultsWater Services Annual Provincial Compliance Inspection ResultsYear 2006-07 2007-08 2008-09 2009-10 2010-11 2011-12<strong>City</strong> System 100% 91.97% 93.74% 97.38% 100% 96%Gazer Mooney System 100% 100% 98.84% 100% 100% 100%SourceAnnual Ministry <strong>of</strong> the Environment water compliance inspection results. Instance <strong>of</strong> non-compliance with thefollowing major Provincial regulations lead to lower inspection scores: Clean Water Act, 2006, Ontario WaterResources Act, 1990, Safe Drinking Water Act, 2002, and Water Opportunities and Conservation Act, 2010.Explanation <strong>of</strong> TrendTo receive a perfect score, Water Services must successfully schedule, collect, analyze, and report on over20,000 sampling events each year. Lower results received through 2007 to 2009 resulted from administrativenon-compliance with sample scheduling.<strong>City</strong> <strong>of</strong> <strong>Guelph</strong> – <strong>2013</strong> Enterprise <strong>Budget</strong>382
<strong>2013</strong> Water Services <strong>Budget</strong>>> <strong>2013</strong> Objectives>> Key changes in <strong>2013</strong>• Complete Water Supply Master Plan update• Complete <strong>of</strong> departmental organizational review• Complete <strong>of</strong> Facility Master Plan• Revise Water By-law and Outside Water Use By-law to improve management <strong>of</strong> <strong>Guelph</strong>’s water resources• Water and wastewater rate structure review study• Continue implementing Showcasing Water Innovation Program-funded Water Distribution SystemEfficiency Project and Transit Bus Wash Rainwater Harvesting and Water Reuse Project• Complete water distribution servicing plan for south <strong>Guelph</strong>• Begin Paisley-Clythe Feedermain construction project to service planned growth and meet additionaldemandWater Services will be impacted by reduced Federal Gas Tax as <strong>Guelph</strong> continues to address and upgradeaging water infrastructure. Increasing prices for energy and other goods and services continue to impact thedepartment as well.The department is also forecasting a decline in <strong>2013</strong> billable water consumption.Healthy reserve contributions are critical to addressing the <strong>City</strong>’s infrastructure gap and adhering to theapproved financial plan to facilitate growth as new infrastructure is required.Increase capital financing by $1,571,200 to pay for the <strong>City</strong>’s portion <strong>of</strong> current and future capital expenditures.These funds are transferred to Water Services capital and Development Charge Exemption reserve fundsIncrease purchased by $238,080 due to environmental charges related to soil disposal ($90,000), increasedwater metre reading and billing costs ($98,500), and minor increases to building and computer networkingcostsIncrease purchased goods by $103,150 predominately due to increased hydro costs ($121,000) and minor costincreases related to plant operating supplies. These increases are <strong>of</strong>fset by a reduction in equipmentexpendituresIncrease internal charges by $60,550 reflecting a chargeback from Engineering Services ($211,300) for theSource Protection Risk Management Official (RMO). This increase is <strong>of</strong>fset by a reduction in the chargeback forfleet maintenance costsIncrease external recoveries by $211,300 due to a charge back to capital projects for the proposed RMO SourceProtection expansion<strong>City</strong> <strong>of</strong> <strong>Guelph</strong> – <strong>2013</strong> Enterprise <strong>Budget</strong>383
<strong>2013</strong> Water Services <strong>Budget</strong>>> <strong>2013</strong> Operating <strong>Budget</strong>The proposed <strong>2013</strong> Water Services Operating <strong>Budget</strong> has gross expenditures <strong>of</strong> $24,637,340, including internalcharges and transfers to reserves. The chart below shows the cost by service area.<strong>2013</strong> Water Services Proposed Operating <strong>Budget</strong> (by Service Area)2012 Approved<strong>Budget</strong>CustomerService andConservation<strong>2013</strong> <strong>Budget</strong> by ServiceSupply,Treatment andProtectionDistributionand Metering<strong>2013</strong> TotalRequested<strong>Budget</strong>Year/YearChange ($)Year/YearChange (%)RevenueUser Fees & Service Charges (20,925,150) (22,791,940) (22,791,940) (1,866,790) 8.9%Product Sales (5,000) (5,000) (5,000) 0.0%Licenses & Permits (14,500) (14,500) (14,500) 0.0%Interest & Penalties (13,000) (13,000) (13,000) 0.0%External Recoveries (826,000) (257,800) (76,100) (703,400) (1,037,300) (211,300) 25.6%Internal Recoveries (760,400) (775,600) (775,600) (15,200) 2.0%Total Revenue (22,544,050) (23,857,840) (76,100) (703,400) (24,637,340) (2,093,290) 9.3%ExpenditureCompensation 5,039,300 1,589,800 1,489,000 2,080,810 5,159,610 120,310 2.4%Purchased Goods 2,940,850 267,100 1,818,200 958,700 3,044,000 103,150 3.5%Purchased Services 2,997,200 1,740,380 816,200 678,700 3,235,280 238,080 7.9%Other Transfers 595,200 595,200 595,200 0.0%Capital Financing 8,358,800 1,196,872 3,717,243 5,015,885 9,930,000 1,571,200 18.8%Internal Charges 2,612,700 1,770,550 301,500 601,200 2,673,250 60,550 2.3%Total Expenditure 22,544,050 7,159,902 8,142,143 9,335,295 24,637,340 2,093,290 9.3%Net <strong>Budget</strong> 0 (16,697,938) 8,066,043 8,631,895 0 0 0.0%Full Time Equivalents 54.5 18.8 14.8 20.9 54.5 - 0.0%<strong>City</strong> <strong>of</strong> <strong>Guelph</strong> – <strong>2013</strong> Enterprise <strong>Budget</strong>384
<strong>2013</strong> Water Services <strong>Budget</strong>Customer Service and ConservationPurchased Goods4%Compensation22%Purchased Services24%Internal Charges25%Other Transfers8%Capital Financing17%Supply, Treatment and ProtectionPurchased Services10%Purchased Goods22%Capital Financing46%Compensation18%Internal Charges4%<strong>City</strong> <strong>of</strong> <strong>Guelph</strong> – <strong>2013</strong> Enterprise <strong>Budget</strong>385
<strong>2013</strong> Water Services <strong>Budget</strong>Distribution and MeteringPurchased Services7%Purchased Goods10%Compensation22%Capital Financing54%Internal Charges7%The <strong>2013</strong> Water Services <strong>Budget</strong> requests two additional Full Time Equivalent (FTE) staff positions – SourceProtection Risk Management Official (RMO) and Water and Wastewater Communications Coordinator. TheCommunications Coordinator position is funded through a reallocation <strong>of</strong> existing funds and will notcontribute to increased rates in the proposed Water or Wastewater <strong>2013</strong> <strong>Budget</strong>s. The CommunicationsCoordinator will result in a new FTE in the Corporate Communications department and is funded jointly byboth the Water and Wastewater budgets. The RMO position is driven by the requirements <strong>of</strong> the Ontario CleanWater Act and is proposed to add an FTE position in Engineering Services. This FTE is funded through existingcapital projects in the Water Services <strong>Budget</strong>. These expansions are explained further in the FTE Requestssummary table at the end <strong>of</strong> the Water Services section (Tab 2).<strong>City</strong> <strong>of</strong> <strong>Guelph</strong> – <strong>2013</strong> Enterprise <strong>Budget</strong>386
<strong>2013</strong> Water Services <strong>Budget</strong>>> Multi-year Operating <strong>Budget</strong>Water Services’ multi-year budget is based on a general forecast that considers major budget expense driversincluding compensation, energy costs and inflation. Staff will work to further refine this forecast in futurebudgets and include anticipated program expansions.The summary below is being provided for information only.<strong>2013</strong> TotalRequested<strong>Budget</strong>2014Projected<strong>Budget</strong>2015Projected<strong>Budget</strong>2016Projected<strong>Budget</strong>RevenueUser Fees & Service Charges (22,791,940) (24,722,421) (26,305,679) (27,512,696)Product Sales (5,000) (5,000) (5,000) (5,000)Licenses & Permits (14,500) (14,500) (14,500) (14,500)Interest & Penalties (13,000) (13,000) (13,000) (13,000)External Recoveries (1,037,300) (1,037,300) (1,037,300) (1,037,300)Internal Recoveries (775,600) (775,600) (775,600) (775,600)Total Revenue (24,637,340) (26,567,821) (28,151,079) (29,358,096)ExpenditureCompensation 5,159,610 5,346,194 5,560,042 5,782,444Purchased Goods 3,044,000 3,171,734 3,309,017 3,452,396Purchased Services 3,235,280 3,398,218 3,544,563 3,697,364Other Transfers 595,200 624,960 656,208 689,018Capital Financing 9,930,000 11,300,000 12,300,000 12,900,000Internal Charges 2,673,250 2,726,715 2,781,249 2,836,874Total Expenditure 24,637,340 26,567,821 28,151,079 29,358,096Net <strong>Budget</strong> 0 0 0 0Forecast Rates (per m3) $1.38 $1.53 $1.65 $1.74Full Time Equivalents 54.5 54.5 54.5 54.5<strong>City</strong> <strong>of</strong> <strong>Guelph</strong> – <strong>2013</strong> Enterprise <strong>Budget</strong>387
<strong>2013</strong> Water Services <strong>Budget</strong>>> <strong>2013</strong> Capital <strong>Budget</strong>The <strong>2013</strong> capital budget and forecast provide a budget for the coming year and subsequent projections forthe next nine years. The capital budget identifies the most appropriate timing for capital work, project costsand funding sources. The total expenditures for the Water Services’ <strong>2013</strong> Capital <strong>Budget</strong> is $12,303,900, and thenine year forecast is $179,097,900.<strong>2013</strong>–2022 Water Services Capital <strong>Budget</strong> & Forecast - Service Based (‘000s)Project CategoryProjectCostGrants &SubsidiesFederalGas TaxPartnerContributionDevelopmentChargesCapitalReservesGrowthCustomer Service & Conservation 2,143.0 0.0 0.0 1,928.7 214.3Supply, Treatment & Protection 43,950.0 0.0 0.0 38,218.6 5,731.4Distribution & Metering 57,936.0 0.0 0.0 34,378.9 23,557.1Total Growth 104,029.0 0.0 0.0 0.0 74,526.2 29,502.8Infrastructure ReplacementCustomer Service & Conservation 1,239.8 642.6 0.0 109.0 0.0 488.2Supply, Treatment & Protection 45,333.0 0.0 0.0 0.0 0.0 45,333.0Distribution & Metering 40,800.0 0.0 281.2 0.0 0.0 40,518.8Total Infrastructure Replacement 87,372.8 642.6 281.2 109.0 0.0 86,340.0Total Capital <strong>Budget</strong> 191,401.8 642.6 281.2 109.0 74,526.2 115,842.8The capital budget is well-balanced between growth and infrastructure rehabilitation and replacementprojects over the 10 year forecast. Highlights include:Meeting the Needs <strong>of</strong> GrowthThe Council-approved 2007 Water Supply Master Plan (WSMP) had identified a number <strong>of</strong> short term options,including water efficiency and conservation, optimization <strong>of</strong> existing groundwater, and new local groundwatersupplies to satisfy future demand and provide more redundancy <strong>of</strong> supply for existing customers. Thecompletion <strong>of</strong> Environmental Assessments and related studies for these short-term groundwater options, asapproved in the WSMP, are included in the capital budget (WT0002 New Water Supply). However, relatedcapital funding for construction <strong>of</strong> infrastructure has been deferred until 2015 and beyond. In <strong>2013</strong> staff will becompleting the five-year update to the Water Supply Master Plan, with a review <strong>of</strong> proposed projects, timing,and funding requirements.<strong>City</strong> <strong>of</strong> <strong>Guelph</strong> – <strong>2013</strong> Enterprise <strong>Budget</strong>388
<strong>2013</strong> Water Services <strong>Budget</strong>The Council-approved 2009 Water/Wastewater Servicing Master Plan (WWSMP) has identified a number <strong>of</strong>significant infrastructure upgrades required in the short-term to service growth, including the installation innew transmission mains, reservoirs and water towers, and new and upgraded pumping stations. In <strong>2013</strong>, morethan $3.6 million is budgeted for growth related upgrades, for water supply and distribution.Sustaining InfrastructureThe Province has enacted Bill 175, the Sustainable Water and Sewage Systems Act, which mandatesaccelerated replacement schedules for all water and wastewater infrastructure. Over 80 per cent <strong>of</strong> the <strong>City</strong>’swater system is underground. The underground infrastructure replacement program is managed andadministered by Engineering Services, which allows for road and water/wastewater infrastructure replacementto occur concurrently and cost-effectively.As previously mentioned, the <strong>2013</strong> capital budget includes increased funding to allow Engineering Services towork towards industry standards and mandatory replacement schedules for all linear infrastructure. In 2012Engineering Services completed a Sustainable Infrastructure Report that includes updates on the watersystem. The report highlights the full lifecycle costs <strong>of</strong> sustaining the <strong>City</strong>’s water system in perpetuity. Anannual water infrastructure spending gap <strong>of</strong> $2.3 million was determined based on the equivalent annual costto sustain this infrastructure less the current 2012 operating and capital budget amount approved for theseassets. The infrastructure scorecard developed as part <strong>of</strong> this project indicates that the relative reinvestmentgrade for water based on 2012 funding levels is “A” at 90% <strong>of</strong> the Average Annual Cost. The proposed <strong>2013</strong>capital financing level will close the gap further to less than $1 million per year.Despite closing the infrastructure gap funding, funding needs to continue to increase to reach thesustainability target and to help address the estimated $46.0 million infrastructure backlog for water systemassets that have theoretically reached the end <strong>of</strong> their lifecycle.Regulatory ComplianceFinally, the <strong>2013</strong> capital budget and forecast includes approximately $3.4 million in funding over the next fiveyears to support a host <strong>of</strong> groundwater protection initiatives resulting from the Province’s Clean Water Act andthe proposed Grand River Source Protection Plan (WT0009 – Groundwater Protection), and to ensure thesecurity and reliability <strong>of</strong> the <strong>City</strong>’s groundwater dependent water supply.A detailed list <strong>of</strong> projects is included at the end <strong>of</strong> this section.<strong>City</strong> <strong>of</strong> <strong>Guelph</strong> – <strong>2013</strong> Enterprise <strong>Budget</strong>389
<strong>2013</strong> Water Services <strong>Budget</strong>>> Reserves and reserve FundsThe <strong>City</strong> maintains four reserves and reserve funds used to fund Water Services capital works and operations.The following chart describes the purpose <strong>of</strong> each reserve and reserve fund, the forecasted <strong>2013</strong> endingbalance, the target and <strong>2013</strong> forecasted target.Water Services Reserves and Reserve FundsReserve or Reserve FundWater ServicesStabilization ReservePurposeThe reserve is funded from operating surpluses. Funds are transferred out atthe direction <strong>of</strong> Council to help stabilize the rate as part <strong>of</strong> the annual budgetprocess, to fund a year-end operating deficit or to pay for capital projects thatwill result in operating savings. The balance in this reserve should be 8-10% <strong>of</strong>gross operating revenue.<strong>2013</strong>ForecastedBalance Target$2,114,186 8-10% <strong>of</strong> grossoperatingrevenue<strong>2013</strong>Forecast8.6%Water Services CapitalReserve FundFunds are transferred in as contributions from the operating budget or anyremaining surplus not committed to another reserve upon closing individualcapital projects. This reserve is used to fund the <strong>City</strong>'s share <strong>of</strong> capital worksrelated to Water Services infrastructure. Annual contributions to this reserveshould, at a minimum, equal depreciation expense.$10,504,300 > = 100% <strong>of</strong>annualdepreciationexpense100%Water Service DCExempt Reserve FundFunds transferred in as contributions from the operating budget. This reservefund is used to fund approved growth related costs not eligible under theDevelopment Charges Act. Annual contributions should equal the last knownvalue <strong>of</strong> Council approved exemptions.$2,795,906 100% <strong>of</strong> lastknown value<strong>of</strong> Councilapprovedexemptions$6,755,287 Monitor thatDC collectionsare occuringas forecast100%Water Services DevelopmentCharges Reserve FundFunds are transferred in as collected from developers. The reserve fund is usedto fund the growth-related component <strong>of</strong> water projects identified in theDevelopment Charges Background Study and approved in the capital budget.Updatedreserve fundforecastsquarterly<strong>City</strong> <strong>of</strong> <strong>Guelph</strong> – <strong>2013</strong> Enterprise <strong>Budget</strong>390
<strong>2013</strong> Water Services <strong>Budget</strong>The graph below shows the forecasted <strong>2013</strong>-22 balance for reserves and reserve funds. The ending balance forthe Water Services Development Charges Reserve Fund goes into a negative position later in the 10-yearforecast primarily due to lower than forecasted revenue collections. A strategy for addressing the revenueshortfall and project needs, timing and cost will be reviewed as part <strong>of</strong> the 2014 Development ChargesBackground Study already underway. In the meantime, staff will continue to monitor revenue collections anddelay starting projects or scale back on project scope as required.<strong>2013</strong>–2021 Water Services Reserves and Reserve Funds(Projected Balances)$50$40$30Millions$20$10$0-$10<strong>2013</strong> 2014 2015 2016 2017 2018 2019 2020 2021 2022DC Capital DC Exempt Stabilization<strong>City</strong> <strong>of</strong> <strong>Guelph</strong> – <strong>2013</strong> Enterprise <strong>Budget</strong>391
<strong>2013</strong> to 2022 Capital <strong>Budget</strong> Water ServicesGrowthUse & AwarenessWW0106 CONSERVATION & EFFICIENCY305.0 305.0 305.0 274.0 258.0 696.0 2,143.0 1,928.7 214.3 214.3Total Use & Awareness 305.0 305.0 305.0 274.0 258.0 696.0 2,143.0 1,928.7 214.3 214.3Plant OperationsWT0002 NEW SUPPLY1,000.0 500.0 2,050.0 1,700.0 1,800.0 13,000.0 20,050.0 18,045.0 2,005.0 2,005.0WT0003 WF3 CLYTHE BOOSTER UPGRADE1,125.0 3,375.0 500.0 5,000.0 4,500.0 500.0 500.0WT0004 WF5 QUALITY UPGRADE- CORROSION CL200.0 200.0 200.0 200.0 1,000.0 1,800.0 534.6 1,265.4 1,265.4WT0005 WF6 ZONE 1A/1B BPS & RESERVOIR500.0 1,000.0 12,000.0 13,500.0 12,150.0 1,350.0 1,350.0WT0006 WF7 ZONE 3 ELEVATED TANK500.0 2,200.0 2,700.0 2,430.0 270.0 270.0WW0105 WS1-7 MASTERPLAN STUDIES450.0 450.0 900.0 559.0 341.0 341.0Total Plant Operations 1,000.0 2,775.0 6,625.0 14,900.0 4,200.0 14,450.0 43,950.0 38,218.6 5,731.4 5,731.4Distribution & TransmissionWD0001 GORDON- CLAIR TO MALTBY1,415.0 1,415.0 1,273.5 141.5 141.5WD0002 WI3 HANLON- WELLINGTON TO CLAIR250.0 3,000.0 3,000.0 3,500.0 9,750.0 7,020.0 2,730.0 2,730.0WD0003 WI4 EDINBURGH TO KORTRIGHT1,200.0 1,200.0 864.0 336.0 336.0WD0004 WI5 KORTRIGHT- EDINBURGH TO GORDO1,500.0 1,500.0 1,080.0 420.0 420.0WD0005 WI6 SPEEDVALE-WATSON-WESTMOUNT 200.0 1,000.0 600.0 600.0 600.0 3,000.0 1,350.0 1,650.0 1,650.0WD0007 WI9 WELLINGTON- HANLON TO WATSON 500.0 1,500.0 1,300.0 400.0 1,300.0 5,900.0 10,900.0 4,905.0 5,995.0 5,995.0WD0008 WI12 ZONE A/B SPLIT500.0 500.0 225.0 275.0 275.0WD0009 WI14 ARKELL WELL TRANSMISSION MAIN14,500.0 14,500.0 6,525.0 7,975.0 7,975.0WD0011 WI11 KORTRIGHT IB EDIN TO RICKSON486.0 486.0 349.9 136.1 136.1WD0012 WI-1 CLAIR - CRAWLEY TO GORDON750.0 750.0 675.0 75.0 75.0WD0013 WI-18 EXHIBITION/DUBLIN5,060.0 5,060.0 4,554.0 506.0 506.0WD0017 WI-15 WATSON: SPEEDVALE TO HWY 25975.0 975.0 877.5 97.5 97.5WD0018 EAST SIDE TRANSMISSION LINE200.0 800.0 800.0 1,800.0 810.0 990.0 990.0WD0019 EAST SIDE ZONE 2 UPGRADES40.0 180.0 180.0 400.0 180.0 220.0 220.0WT0012 EAST SIDE ELEVATION TANK200.0 1,500.0 1,500.0 3,200.0 1,440.0 1,760.0 1,760.0WW0139 W-I-25 DEVELOPMENT OVERSIZING250.0 250.0 250.0 250.0 250.0 1,250.0 2,500.0 2,250.0 250.0 250.0Total Distribution & Transmission 2,390.0 8,230.0 7,630.0 1,250.0 6,136.0 32,300.0 57,936.0 34,378.9 23,557.1 23,557.1Infrastructure ReplacementUse & AwarenessTotal Growth 3,695.0 11,310.0 14,560.0 16,424.0 10,594.0 47,446.0 104,029.0 74,526.2 29,502.8 29,502.8WT0016 SWI WATER EFFICIENCY1,178.0 61.8 1,239.8 642.6 109.0 488.2 488.2Total Use & Awareness 1,178.0 61.8 1,239.8 642.6 109.0 488.2 488.2Plant OperationsGross Project Cost ('000s)Project Number & Description <strong>2013</strong> 2014 2015 2016 2017Next5 YearsGG0202 WATERWORKS FLEET REPL 2011234.6 596.1 480.6 114.8 287.6 924.0 2,637.7 2,637.7 2,637.7IT0021 WW ITS REPLACEMENT98.3 41.0 74.1 90.5 75.8 386.6 766.3 766.3 766.3WT0007 WATER FACILITY UPG AND STUDIES750.0 1,000.0 2,350.0 2,400.0 2,450.0 13,000.0 21,950.0 21,950.0 21,950.0WT0008 UFW REMEDIAL ACTION PLAN135.0 140.0 140.0 145.0 150.0 825.0 1,535.0 1,535.0 1,535.0WT0009 GROUNDWATER PROTECTION875.0 900.0 925.0 700.0 3,500.0 6,900.0 6,900.0 6,900.0WT0010 LEAD REPLACEMENT578.0 578.0 578.0 1,734.0 1,734.0 1,734.0WT0011 WF1 PAISLEY PUMP UPGRADES750.0 750.0 750.0 750.0WT0013 BURKE TREATMENT1,700.0 650.0 1,000.0 3,350.0 3,350.0 3,350.0WT0015 WF-4 ROBERTSON BOOSTER UPGRADES600.0 1,500.0 3,500.0 5,600.0 5,600.0 5,600.0WT0019 WIRELESS PROJECT110.0 110.0 110.0 110.0TotalProjectCostGrants &SubsidiesFederalGas TaxSources <strong>of</strong> External FundingOtherDevelopmentChargesDCDebtNet Costto <strong>City</strong>EquipmentReplacementCapitalEnvelopeOtherCapitalDebt392
<strong>2013</strong> to 2022 Capital <strong>Budget</strong> Water ServicesTotal Plant Operations 3,605.9 4,630.1 5,522.7 4,275.3 5,163.4 22,135.6 45,333.0 45,333.0 45,333.0Distribution & TransmissionGross Project Cost ('000s)Project Number & Description <strong>2013</strong> 2014 2015 2016 2017Next5 YearsWD0014 WATERMAIN REPLACEMENT2,500.0 2,250.0 2,250.0 2,250.0 2,250.0 11,250.0 22,750.0 281.3 22,468.8 22,468.8WD0015 WARD ONE -WATERMAIN REPLACEMEN 750.0 1,600.0 1,000.0 1,000.0 1,000.0 5,000.0 10,350.0 10,350.0 10,350.0WD0016 WI16 HANLON CROSSING TO PAISLEY575.0 825.0 500.0 1,900.0 1,900.0 1,900.0WD0020 WI-13 CARTER AQUADUCT5,000.0 5,000.0 5,000.0 5,000.0WD0021 WI-7 ZONE 1/2 BOUNDARY NORTH OF SPE200.0 200.0 400.0 400.0 400.0WD0022 DOWNTOWN CIP200.0 200.0 400.0 400.0 400.0Total Distribution & Transmission 3,825.0 5,075.0 4,150.0 3,250.0 3,250.0 21,250.0 40,800.0 281.3 40,518.8 40,518.8Total Infrastructure Replacement 8,608.9 9,766.9 9,672.7 7,525.3 8,413.4 43,385.6 87,372.8 642.6 281.3 109.0 86,340.0 86,340.0Total Water Services 12,303.9 21,076.9 24,232.7 23,949.3 19,007.4 90,831.6 191,401.8 642.6 281.3 109.0 74,526.2 115,842.8 115,842.8TotalProjectCostGrants &SubsidiesFederalGas TaxSources <strong>of</strong> External FundingOtherDevelopmentChargesDCDebtNet Costto <strong>City</strong>EquipmentReplacementCapitalEnvelopeOtherCapitalDebt393
2018 TO 2022Capital <strong>Budget</strong>Water ServicesGrowthUse & AwarenessWW0106 CONSERVATION & EFFICIENCY245.0 145.0 102.0 102.0 102.0 696.0 626.4Total Use & Awareness 245.0 145.0 102.0 102.0 102.0 696.0 626.4Plant OperationsWT0002 NEW SUPPLY2,000.0 2,750.0 2,750.0 2,750.0 2,750.0 13,000.0 11,700.0WT0004 WF5 QUALITY UPGRADE- CORROSION CL2 200.0 200.0 200.0 200.0 200.0 1,000.0 297.0 670.0 670.0WW0105 WS1-7 MASTERPLAN STUDIES450.0 450.0 279.5 139.5 139.5Total Plant Operations 2,200.0 3,400.0 2,950.0 2,950.0 2,950.0 14,450.0 12,276.5 809.5 809.5Distribution & TransmissionWD0001 GORDON- CLAIR TO MALTBY1,415.0 1,415.0 1,273.5WD0003 WI4 EDINBURGH TO KORTRIGHT300.0 300.0 300.0 300.0 1,200.0 864.0 240.0 240.0WD0004 WI5 KORTRIGHT- EDINBURGH TO GORDO500.0 500.0 500.0 1,500.0 1,080.0 300.0 300.0WD0007 WI9 WELLINGTON- HANLON TO WATSON 1,900.0 2,000.0 2,000.0 5,900.0 2,655.0 2,950.0 2,950.0WD0008 WI12 ZONE A/B SPLIT500.0 500.0 225.0 250.0 250.0WD0009 WI14 ARKELL WELL TRANSMISSION MAIN 1,000.0 4,500.0 4,500.0 4,500.0 14,500.0 6,525.0 7,250.0 7,250.0WD0013 WI-18 EXHIBITION/DUBLIN2,530.0 2,530.0 5,060.0 4,554.0WD0017 WI-15 WATSON: SPEEDVALE TO HWY 25975.0 975.0 877.5WW0139 W-I-25 DEVELOPMENT OVERSIZING250.0 250.0 250.0 250.0 250.0 1,250.0 1,125.0Total Distribution & Transmission 3,150.0 8,965.0 10,580.0 9,055.0 550.0 32,300.0 19,179.0 10,990.0 10,990.0Infrastructure ReplacementPlant OperationsTotal Growth 5,595.0 12,510.0 13,632.0 12,107.0 3,602.0 47,446.0 32,081.9 11,799.5 11,799.5GG0202 WATERWORKS FLEET REPL 2011573.4 242.7 107.9 924.0 924.0 924.0IT0021 WW ITS REPLACEMENT73.2 81.9 76.0 83.5 72.0 386.6 386.6 386.6WT0007 WATER FACILITY UPG AND STUDIES2,500.0 2,550.0 2,600.0 2,650.0 2,700.0 13,000.0 13,000.0 13,000.0WT0008 UFW REMEDIAL ACTION PLAN155.0 160.0 165.0 170.0 175.0 825.0 825.0 825.0WT0009 GROUNDWATER PROTECTION800.0 700.0 700.0 700.0 600.0 3,500.0 3,500.0 3,500.0WT0015 WF-4 ROBERTSON BOOSTER UPGRADES 2,000.0 1,500.0 3,500.0 3,500.0 3,500.0Total Plant Operations 5,528.2 5,565.3 3,783.7 3,711.4 3,547.0 22,135.6 22,135.6 22,135.6Distribution & TransmissionGross Project Cost ('000s)Project Number & Description 2018 2019 2020 2021 2022WD0014 WATERMAIN REPLACEMENT2,250.0 2,250.0 2,250.0 2,250.0 2,250.0 11,250.0 11,250.0 11,250.0WD0015 WARD ONE -WATERMAIN REPLACEMEN 1,000.0 1,000.0 1,000.0 1,000.0 1,000.0 5,000.0 5,000.0 5,000.0WD0020 WI-13 CARTER AQUADUCT4,000.0 1,000.0 5,000.0 5,000.0 5,000.0Total Distribution & Transmission 3,250.0 3,250.0 3,250.0 7,250.0 4,250.0 21,250.0 21,250.0 21,250.0Total Infrastructure Replacement 8,778.2 8,815.3 7,033.7 10,961.4 7,797.0 43,385.6 43,385.6 43,385.6Total Water Services 14,373.2 21,325.3 20,665.7 23,068.4 11,399.0 90,831.6 32,081.9 55,185.1 55,185.1TotalProject Cost(2018-2022)Grants &SubsidiesFederalGas TaxOtherSources <strong>of</strong> External FundingDevelopmentChargesDCDebtNet Costto <strong>City</strong>EquipmentReplacementCapitalEnvelopeOtherCapitalDebt394
<strong>2013</strong> Wastewater Services Operating and Capital <strong>Budget</strong>Wastewater Services delivers reliable sanitary services and high quality effluent that meets or exceedsregulatory requirements. The department is responsible for planning, design, construction, operation,maintenance and overall management <strong>of</strong> over $530 million in wastewater infrastructure assets.Customer Service and WaterConservation• Educate, promote and support efficient use<strong>of</strong> water resources• Implement water conservation programs• Provide customer education, promotionand communications• Safety program and mandatory trainingPlant Operations and Maintenance• Operate, maintain and optimize WWTP• Manage biosolids program, planning andcompliance• Perform new capital projects to upgradethe treatment process• Laboratory servicesSpills Response, Sewer Use By-lawEnforcement, Wastewater ServicesCollection System Operations andManagement• Enforce <strong>Guelph</strong>’s Sewer Use By-law• Respond to spills, address sewer blocks,conduct video sewer inspections andrepairs, conduct sewer flushing• Address issues at road interface• Perform infrastructure planning andreplacementNote: The Engineering Services department provides capital design and construction services for the wastewater conveyance system. These activities are included in theEngineering Services capital budget.<strong>City</strong> <strong>of</strong> <strong>Guelph</strong> – <strong>2013</strong> Enterprise <strong>Budget</strong>395
<strong>2013</strong> Wastewater Services Operating and Capital <strong>Budget</strong>>> 2012 Accomplishments• Wastewater staff conducted a workshop on primary mass control for facility operators <strong>of</strong> wastewaterfacilities as part <strong>of</strong> the Grand River watershed-wide wastewater optimization pilot project.• Helped secure $1 million provincial Showcasing Water Innovation Program Funding received• Continued capacity demonstration aimed at deferring the need for over $20 million in capital expansion• Completed design and construction <strong>of</strong> septage receiving station, truck unloading bay and environmentalprotection facility• Completed cleaning and gas-pro<strong>of</strong>ing digester one• Completed design <strong>of</strong> Process Operations Centre and tendering in progress• Substantially completed HVAC upgrade contract• Began tendering biosolids storage facility• Ongoing replacement and upgrades to wastewater conveyance system• Completed wastewater collection system inflow and infiltration study• Completion first stage <strong>of</strong> sewer condition assessment program• Completion Environmental Assessment for York trunk sanitary sewer• Supported southern Ontario Water consortium (part <strong>of</strong> a $60 million federal grant), including a researchcentre to be constructed next to <strong>Guelph</strong>’s treatment facility• Upgraded headwork screw pumps>> Key Performance MeasuresWastewater Treatment PerformanceThe <strong>Guelph</strong> wastewater treatment plant (WWTP) is an advanced tertiary treatment plant that discharges intothe Speed River. Figure 1 illustrates the impact <strong>of</strong> our optimization process. When faced with challengingemerging effluent requirements staff have worked to optimize the existing infrastructure and processes,thereby avoiding the need for additional capital infrastructure, ultra violet disinfection, at an estimated cost <strong>of</strong>$8 million.<strong>City</strong> <strong>of</strong> <strong>Guelph</strong> – <strong>2013</strong> Enterprise <strong>Budget</strong>396
<strong>2013</strong> Wastewater Services Operating and Capital <strong>Budget</strong>0.10.09Figure 1Final Effluent Monthly Average Chlorine Residual2007 to 20120.08Process Control Established March 2008mg/L0.070.060.050.040.030.020.01Progressive reduction in residual chlorine0Dec-07Feb-08Apr-08Jun-08Aug-08Oct-08Dec-08Feb-09Apr-09Jun-09Aug-09Oct-09Dec-09Feb-10Apr-10Jun-10Aug-10Oct-10Dec-10Feb-11Apr-11Jun-11Aug-11Oct-11Dec-11Feb-12Apr-12Jun-12Aug-12Sep-12Chlorine residualFuture Env Canada Guidline<strong>City</strong> <strong>of</strong> <strong>Guelph</strong> – <strong>2013</strong> Enterprise <strong>Budget</strong>397
<strong>2013</strong> Wastewater Services Operating and Capital <strong>Budget</strong>Figure 2 illustrates very consistent and exemplary performance from the <strong>City</strong>’s Wastewater Treatmentinfrastructure that is a result and reflection <strong>of</strong> the commitment and dedication <strong>of</strong> the Wastewater ServicesTeam. The consistent higher percentage removal <strong>of</strong> Ammonia indicates that there is improved process controland we are able to achieve higher removal rates.Figure 2WWTP Percent Removal Efficiencies1009998979695949392912006 2007 2008 2009 2010 2011Total Suspended SolidsAmmoniaBODTotal Phosporous<strong>City</strong> <strong>of</strong> <strong>Guelph</strong> – <strong>2013</strong> Enterprise <strong>Budget</strong>398
<strong>2013</strong> Wastewater Services Operating and Capital <strong>Budget</strong>Megalitres <strong>of</strong> Wastewater TreatedOver the past six years, there has been fluctuation <strong>of</strong> flows to the WWTP that reflects customer use and rainfallevents. There was an increase in flows to the plant in 2011 due to several severe rainfall events and a year-overyearincrease in industrial flows.WWTP Annual Flow Treated (MLD)2050020000195001900018500180001750017000165001600015500150002006 2007 2008 2009 2010 2011Annual Total Flow (MLD)<strong>City</strong> <strong>of</strong> <strong>Guelph</strong> – <strong>2013</strong> Enterprise <strong>Budget</strong>399
<strong>2013</strong> Wastewater Services Operating and Capital <strong>Budget</strong>Customer ServiceWastewater Services staff enforces the sewer use by-law. The chart below shows the department’s responsesto spills over the past 5 years. Increased awareness about the importance <strong>of</strong> reporting spills contributes to theincrease in spills reported.Spills Responded5004504004034613503002503173292001501441005002007 2008 2009 2010 2011Number <strong>of</strong> spills<strong>City</strong> <strong>of</strong> <strong>Guelph</strong> – <strong>2013</strong> Enterprise <strong>Budget</strong>400
<strong>2013</strong> Wastewater Services Operating and Capital <strong>Budget</strong>>> <strong>2013</strong> Objectives• Continue supporting southern Ontario water consortium pilot scale treatment facility• Continue capacity demonstration at the wastewater treatment plant to defer capital expansion• Apply to the Ontario Ministry <strong>of</strong> Environment to rerating <strong>of</strong> the facility to 73.3 Mld• Complete construction <strong>of</strong> the Process Operations Centre• Complete construction <strong>of</strong> Biosolids storage facility• Complete the Biosolids Management Master plan update• Continue digester cleaning program• Begin construction on York trunk sanitary sewer• Continue sewer condition assessments• Ongoing replacement and upgrades to wastewater conveyance system and the wastewater treatmentfacility>> Key Changes in <strong>2013</strong>The department continues to face increasing capital costs associated with maintaining and replacing aginginfrastructure and accommodating growth in both wastewater collection and treatment.Wastewater Services must adhere to regulatory and legislative framework <strong>of</strong> Federal and provincialgovernments.The department forecasts a decline in <strong>2013</strong> billable water consumption while prices for energy and otherpurchased goods and services are expected to continue increasing.Increase transfer to capital reserves and the DC exempt reserve by $1,782,020 to address the infrastructuredeficit and fund current and future capital workIncrease purchase goods by $412,760 predominantly due to increasing cost <strong>of</strong> heat and electricity ($350,710)and minor increases to operating suppliesIncrease purchased services by $105,356 due to increased billing and collection costs, increased repairs,maintenance and equipment rental costsDecrease internal charges by $197,250 due to a reduction in the chargeback for fleet maintenance costs <strong>of</strong>f setby the shared cost <strong>of</strong> the communications coordinator.<strong>City</strong> <strong>of</strong> <strong>Guelph</strong> – <strong>2013</strong> Enterprise <strong>Budget</strong>401
<strong>2013</strong> Wastewater Services Operating and Capital <strong>Budget</strong>>> <strong>2013</strong> Operating <strong>Budget</strong>The <strong>2013</strong> Wastewater Services Operating <strong>Budget</strong> has gross expenditures <strong>of</strong> $26,884,950, including internalcharges and transfers to reserves.<strong>2013</strong> Wastewater Services Proposed Operating <strong>Budget</strong> (by Service Area)2012 Approved<strong>Budget</strong>CustomerService andConservation<strong>2013</strong> <strong>Budget</strong> by ServicePlantOperations andMaintenanceSpills Response,Sewer Use,Enforcement andWastewaterCollections<strong>2013</strong> TotalRequested<strong>Budget</strong>Year/YearChange ($)Year/YearChange (%)RevenueUser Fees & Service Charges (24,535,184) (26,815,950) (26,815,950) (2,280,766) 9.3%Internal Recoveries (67,800) (60,300) (8,700) (69,000) (1,200) 1.8%Total Revenue (24,602,984) (26,876,250) (8,700) (26,884,950) (2,281,966) 9.3%ExpenditureCompensation 4,466,580 969,470 2,340,290 1,335,900 4,645,660 179,080 4.0%Purchased Goods 4,537,100 534,560 4,137,300 278,000 4,949,860 412,760 9.1%Purchased Services 3,801,552 1,091,120 2,582,938 232,850 3,906,908 105,356 2.8%Other Transfers 892,800 892,800 892,800 0.0%Capital Financing 8,267,980 3,397,265 6,652,735 10,050,000 1,782,020 21.6%Internal Charges 2,636,972 1,847,250 428,572 163,900 2,439,722 (197,250) -7.5%Total Expenditure 24,602,984 5,335,200 12,886,365 8,663,385 26,884,950 2,281,966 9.3%Net <strong>Budget</strong> 0 (21,541,050) 12,877,665 8,663,385 0 0 0.0%Full Time Equivalents 51 8 14 29 51 0 0.0%<strong>City</strong> <strong>of</strong> <strong>Guelph</strong> – <strong>2013</strong> Enterprise <strong>Budget</strong>402
<strong>2013</strong> Wastewater Services Operating and Capital <strong>Budget</strong>Plant Operations and MaintenanceCompensation18%Internal Charges3%Purchased Goods32%Captial Financing27%Purchased Services20%Spills Response, Sewer Use,Enforcement and Wastewater CollectionsPurchased Services3%Purchased Goods3%Capital Financing77%Compensation15%Internal Charges2%<strong>City</strong> <strong>of</strong> <strong>Guelph</strong> – <strong>2013</strong> Enterprise <strong>Budget</strong>403
<strong>2013</strong> Wastewater Services Operating and Capital <strong>Budget</strong>Customer Service and ConservationOther Transfers17%Internal Charges35%Purchased Services20%Purchased Goods10%Compensation18%<strong>City</strong> <strong>of</strong> <strong>Guelph</strong> – <strong>2013</strong> Enterprise <strong>Budget</strong>404
<strong>2013</strong> Wastewater Services Operating and Capital <strong>Budget</strong>>> Multi-year Operating <strong>Budget</strong>Wastewater Services multi-year budget is based on a forecasted compensation and energy costs and inflation.Staff will work to further refine this forecast in future budgets and will include anticipated program expansions.The summary below is being provided for information only<strong>2013</strong> TotalRequested<strong>Budget</strong>2014Projected<strong>Budget</strong>2015Projected<strong>Budget</strong>2016Projected<strong>Budget</strong>RevenueUser Fees & Service Charges (26,815,950) (28,777,703) (30,482,143) (32,142,248)Interest & PenaltiesExternal RecoveriesInternal Recoveries (69,000) (69,000) (69,000) (69,000)Total Revenue (26,884,950) (28,846,703) (30,551,143) (32,211,248)ExpenditureCompensation 4,645,660 4,804,419 4,948,552 5,097,008Purchased Goods 4,949,860 5,139,718 5,387,498 5,609,756Purchased Services 3,906,908 4,076,609 4,292,495 4,481,903Long Term Debt ChargesOther Transfers 892,800 937,440 984,312 1,033,528Capital Financing 10,050,000 11,400,000 12,400,000 13,400,000Internal Charges 2,439,722 2,488,516 2,538,287 2,589,053Total Expenditure 26,884,950 28,846,703 30,551,143 32,211,248Net <strong>Budget</strong> 0 0 0 0Forecast Rate (per m3) $1.52 $1.65 $1.77 $1.90Full Time Equivalents 51 51 51 51<strong>City</strong> <strong>of</strong> <strong>Guelph</strong> – <strong>2013</strong> Enterprise <strong>Budget</strong>405
<strong>2013</strong> Wastewater Services Operating and Capital <strong>Budget</strong>>> <strong>2013</strong> Capital <strong>Budget</strong>The capital budget identifies the most appropriate timing for capital work, project costs and funding sources.The total expenditures for the Wastewater Services’ <strong>2013</strong> capital <strong>Budget</strong> is $12,417,600 and the nine yearforecast is $164,703,700.<strong>2013</strong>–2022 Wastewater Services Capital <strong>Budget</strong> & Forecast - Service Based (‘000s)Service CategoryProjectCostDevelopmentChargesCapitalReservesGrowthTreatment Plant Operations 72,517.0 36,684.4 35,832.5Sewer Use and Collection 55,332.0 26,007.3 29,324.8Total Growth 127,849.0 62,691.7 65,157.3Infrastructure ReplacementTreatment Plant Operations 9,907.3 0.0 9,907.3Sewer Use and Collection 39,365.0 0.0 39,365.0Total Infrastructure Replacement 49,272.3 0.0 49,272.3Total Capital <strong>Budget</strong> 177,121.3 62,691.7 114,429.6The capital <strong>Budget</strong> is weighted towards major growth projects i.e. the side stream treatment and biosolidsfacility upgrades. The need for these projects is directly tied to increased pressures related to capacityrequirements to accommodate future growth.Note: a large plant expansion (approximate cost is $60 million) is anticipated beyond the 10-year forecast. Staff will continue tomonitor the need for this project and reintroduce it into the forecast when required.<strong>City</strong> <strong>of</strong> <strong>Guelph</strong> – <strong>2013</strong> Enterprise <strong>Budget</strong>406
<strong>2013</strong> Wastewater Services Operating and Capital <strong>Budget</strong>Highlights <strong>of</strong> the <strong>2013</strong> capital <strong>Budget</strong> and Forecast include:• Construction <strong>of</strong> the annamox side stream treatment and pilot mainstream treatment• Digester cleaning program• Infrastructure and equipment upgrades related to the Wastewater treatment plant• Funding for various linear infrastructure upgrades as outlined in the Water/Wastewater Servicing MasterPlan such as implementation <strong>of</strong> the detailed design and phased construction <strong>of</strong> the York trunk sewer (morethan $4.9 million for growth related upgrades to the wastewater conveyance system)• Funding for the replacement and rehabilitation <strong>of</strong> existing sewers in conjunction with various roadreconstruction projects ($3.2 million for infrastructure replacement to the wastewater conveyance system)• sustaining infrastructure• The province has enacted Bill 175, the Sustainable Water and Sewage Systems Act, which mandatesaccelerated replacement schedules for all water and wastewater infrastructure. Over 54 per cent <strong>of</strong><strong>Guelph</strong>’s wastewater system is underground, and underground infrastructure replacement is managedand administered by Engineering Services, which allows for road and water/wastewater infrastructurereplacement to occur concurrently and cost-effectively.• The capital budget includes increased funding to allow Engineering Services to work towards industrystandards and mandatory replacement schedules for all plant and linear infrastructure. In 2012Engineering Services completed a Sustainable Infrastructure Report that highlighted the full life cyclecosts <strong>of</strong> sustaining the <strong>City</strong>’s wastewater system in perpetuity. An annual wastewater infrastructurespending gap <strong>of</strong> $6.4 million was determined based on the equivalent annual cost to sustain thisinfrastructure less the current 2012 operating and capital budget amount approved for these assets. Theinfrastructure scorecard developed as part <strong>of</strong> this project indicates that the relative reinvestment gradefor wastewater based on 2012 funding levels is “C” at 79% <strong>of</strong> the average annual cost. The <strong>2013</strong> capitalfinancing level will close the gap further to less than $4.7 million per year. Despite closing theinfrastructure gap funding, funding needs to continue to increase to reach the sustainability target andhelp address the estimated $53.0 million infrastructure backlog for wastewater system assets that havetheoretically reached the end <strong>of</strong> their lifecycle.A complete list <strong>of</strong> projects is included at the end <strong>of</strong> this section.<strong>City</strong> <strong>of</strong> <strong>Guelph</strong> – <strong>2013</strong> Enterprise <strong>Budget</strong>407
<strong>2013</strong> Wastewater Services Operating and Capital <strong>Budget</strong>>> Reserves and Reserve Funds<strong>Guelph</strong> maintains four reserves and reserve funds to fund Wastewater Services capital works and operations.The chart below describes the purpose <strong>of</strong> each reserve and reserve fund, the forecasted <strong>2013</strong> forecastedending balance, the <strong>2013</strong> target and <strong>2013</strong> forecasted target:Wastewater Services Reserves and Reserve FundsReserve or Reserve FundWastewater ServicesStablization ReserveWastewater ServicesCapital Reserve FundPurposeThe reserve is funded from operating surpluses. Funds are transferred out at thedirection <strong>of</strong> Council to help stabilize the rate as part <strong>of</strong> the annual budget process, t<strong>of</strong>und a year-end operating deficit or to pay for capital projects that will result inoperating savings. The balance in this reserve should be 8-10% <strong>of</strong> gross operatingrevenue.Funds are transferred in as contributions from the operating budget or any remainingsurplus not committed to another reserve upon closing individual capital projects.This reserve is used to fund the <strong>City</strong>'s share <strong>of</strong> capital works related to WastewaterServices infrastructure. Annual contributions to this reserve should, at a minimum,equal depreciation expense.2012 ForecastedBalanceTarget$2,242,033 8-10% <strong>of</strong>grossoperatingrevenue$7,533,174 > = 100% <strong>of</strong>annualdepreciationexpense2012Forecast8.4%100%Wastewater ServiceDC Exempt Reserve FundFunds are transferred in as contributions from the operating budget. This reserve fundis used to fund approved growth related costs not eligible under the DevelopmentCharges Act. Annual contributions should equal the last known value <strong>of</strong> Councilapproved exemptions.$859,499 100% <strong>of</strong> lastknown value<strong>of</strong> Councilapprovedexemptions100%Wastewater ServicesDevelopment ChargesReserve FundFunds are transferred in as collected from developers. The reserve fund is used to fundthe growth-related component <strong>of</strong> wastewater projects identified in the DevelopmentCharges Background Study and approved in the capital budget.-$745,671 Monitorthat DCcollectionsare occuringas forecastUpdatedreserve fundforecastsquarterly<strong>City</strong> <strong>of</strong> <strong>Guelph</strong> – <strong>2013</strong> Enterprise <strong>Budget</strong>408
<strong>2013</strong> Wastewater Services Operating and Capital <strong>Budget</strong>The graph below shows the forecasted <strong>2013</strong>-22 balance for each <strong>of</strong> the reserves and reserve funds. The endingbalance for the Wastewater Services Development Charges Reserve Fund is in a negative position primarilydue to lower than forecasted revenue collections. A strategy to address the revenue shortfall and projectneeds, timing and cost will be reviewed as part <strong>of</strong> the 2014 Development Charges Background Study alreadyunderway. In the meantime, staff will continue to monitor revenue collections and delay starting projects orscale back on project scope as required.<strong>2013</strong>–2022 Wastewater Services Reserves and Reserve Funds(Projected Balances)Millions706050403020100-10-20<strong>2013</strong> 2014 2015 2016 2017 2018 2019 2020 2021 2022DC Capital DC Exempt Stabilization<strong>City</strong> <strong>of</strong> <strong>Guelph</strong> – <strong>2013</strong> Enterprise <strong>Budget</strong>409
<strong>2013</strong> to 2022 Capital <strong>Budget</strong> WastewaterGrowthProject Number & Description <strong>2013</strong> 2014 2015 2016 2017Treatment & Plant OperationsST0001 PLANT RERATING- PHOS REDN IN51.0 51.0 51.0 51.0 306.0 510.0 459.0 51.0 51.0ST0002 WWTP - UPGRADES & STUDIES50.0 198.0 198.0 504.0 249.0 846.0 2,045.0 471.6 1,573.3 1,573.3ST0003 WWTP BIOSOLIDS FACILITY UPGRD2,870.0 2,646.0 2,646.0 3,053.0 32,339.0 43,554.0 19,431.5 24,122.5 24,122.5ST0004 WWTP PHASE 2 EXPANSION2,000.0 6,250.0 6,400.0 51.0 14,701.0 13,230.9 1,470.1 1,470.1ST0005 WWTP UPGRADES500.0 407.0 3,328.0 5,393.0 224.0 631.0 10,483.0 2,471.4 8,011.6 8,011.6ST0006 SCADA UPGRADES102.0 102.0 102.0 408.0 714.0 161.0 553.0 553.0ST0008 WASTEWATER MASTERPLAN102.0 102.0 102.0 204.0 510.0 459.0 51.0 51.0Total Treatment & Plant Operations 2,652.0 3,526.0 12,677.0 15,198.0 3,730.0 34,734.0 72,517.0 36,684.4 35,832.5 35,832.5Distribution & TransmissionSC0001 SPEEDVALE- ELMIRA TO W GOVERNORS217.0 217.0 195.3 21.7 21.7SC0002 WWI0/WWS4 FLOW MONITORING750.0 750.0 337.5 412.5 412.5SC0003 WW12 STEVENSON- YORK TO ERAMOSA825.0 510.0 1,335.0 252.3 1,082.7 1,082.7SC0004 WWI3 SPEED- HANLON TO ERAMOSA300.0 850.0 3,100.0 4,250.0 841.7 3,408.3 3,408.3SC0005 WWI4 WATERLOO- HANLON TO YORKSHIR1,780.0 1,780.0 560.7 1,219.3 1,219.3SC0006 WWI7 SPEEDVL- MARLBORO TO METCALF915.0 915.0 823.5 91.5 91.5SC0007 WWI9 DOWNEY- DOWNEY-HZLWD-TEAL620.0 1,000.0 1,620.0 1,458.0 162.0 162.0SC0008 WWI10 RIVER CROSSING/HANLON EXP350.0 350.0 350.0 350.0 1,750.0 3,150.0 1,219.5 1,930.5 1,930.5SC0009 WWF3 YORK/SPEED TRUNK EQUALIZN535.0 535.0 1,070.0 2,140.0 1,926.0 214.0 214.0SC0010 WWS6 WASTEWATER MPLAN UPDATE300.0 300.0 270.0 30.0 30.0SC0011 YORK RD- VICTORIA TO WATSON775.0 1,550.0 2,325.0 2,092.5 232.5 232.5SC0012 WW-I-5 REPL YORKSHIRE TRUNK2,760.0 2,760.0 2,484.0 276.0 276.0SC0018 WWI12 SIPHON IMPROVEMENTS240.0 600.0 600.0 600.0 3,000.0 5,040.0 2,268.0 2,772.0 2,772.0SC0019 WWI14 I&I REDUCTION IMPL250.0 250.0 1,700.0 2,200.0 990.0 1,210.0 1,210.0SC0020 WWI15 NEW GRAVITY SEWERS250.0 250.0 250.0 1,250.0 2,000.0 1,800.0 200.0 200.0SC0021 WWI16 NEW FORCEMAINS150.0 150.0 150.0 750.0 1,200.0 1,080.0 120.0 120.0SC0023 WWF1 DECOMMISION GORDON SPS2,700.0 2,700.0 2,430.0 270.0 270.0SC0027 GORDON- CLAIR TO MALTBY1,500.0 1,500.0 1,350.0 150.0 150.0SC0029 SERVICING STUDIES150.0 150.0 33.8 116.3 116.3WD0023 SERVICING STUDIES100.0 100.0 22.5 77.5 77.5WS0085 WWI1 YORK - HANLON-VICTORIA3,780.0 3,780.0 3,780.0 3,780.0 3,780.0 18,900.0 3,572.0 15,328.0 15,328.0Total Distribution & Transmission 5,020.0 6,687.0 8,360.0 7,515.0 7,540.0 20,210.0 55,332.0 26,007.3 29,324.8 29,324.8Infrastructure ReplacementTreatment & Plant OperationsTotal Growth 7,672.0 10,213.0 21,037.0 22,713.0 11,270.0 54,944.0 127,849.0 62,691.7 65,157.3 65,157.3GG0203 WASTEWATER FLEET REPL122.4 171.0 30.8 74.5 249.6 648.3 648.3 648.3IT0022 WS ITS REPLACEMENT60.2 56.8 62.7 62.7 53.8 299.8 596.0 596.0 596.0ST0013 DIGESTER CLEANING PROGRAM153.0 153.0 204.0 204.0 204.0 1,020.0 1,938.0 1,938.0 1,938.0ST0014 DIGESTER GAS PROOFING100.0 750.0 750.0 750.0 2,350.0 2,350.0 2,350.0ST0015 REPAIRS TO PROCESS STRUCTURES500.0 500.0 500.0 2,000.0 3,500.0 3,500.0 3,500.0ST0016 WIRELESS PROJECT120.0 120.0 120.0 120.0ST0017 SCUM TROUGH190.0 190.0 190.0 190.0ST0018 EQUIP REPLACE & UPGRADES300.0 165.0 100.0 565.0 565.0 565.0Total Treatment & Plant Operations 1,545.6 1,295.8 1,647.5 766.7 332.3 4,319.4 9,907.3 9,907.3 9,907.3Distribution & TransmissionGross Project Cost ('000s)Next5 YearsTotalProjectCostGrants &SubsidiesFederalGas TaxSources <strong>of</strong> External FundingOtherDevelopmentChargesDCDebtNet Costto <strong>City</strong>EquipmentReplacementCapitalEnvelopeOtherCapitalDebt410
<strong>2013</strong> to 2022 Capital <strong>Budget</strong> WastewaterGross Project Cost ('000s)Project Number & Description <strong>2013</strong> 2014 2015 2016 2017Next5 YearsSC0013 WARD ONE - SEWER REPLACEMENT1,000.0 1,500.0 1,000.0 1,000.0 1,000.0 5,000.0 10,500.0 10,500.0 10,500.0SC0014 SEWER REPL VARIOUS1,750.0 2,500.0 2,000.0 2,000.0 2,000.0 10,000.0 20,250.0 20,250.0 20,250.0SC0015 WWI8 WATER- MAPLE TO GORDON865.0 865.0 865.0 865.0SC0025 SEWER INVESTIGATION VARIOUS250.0 300.0 300.0 600.0 1,450.0 1,450.0 1,450.0SC0026 WWI13 INFRASTRUCTURE IMPROVEMENT 200.0 200.0 200.0 200.0 1,400.0 2,200.0 2,200.0 2,200.0SC0028 DOWNTOWN CIP500.0 1,000.0 1,500.0 1,500.0 1,500.0ST0010 WWF2 SPS/FORCEMAIN IMPROVEMENT200.0 200.0 200.0 2,000.0 2,600.0 2,600.0 2,600.0Total Distribution & Transmission 3,200.0 4,400.0 3,000.0 3,700.0 4,200.0 20,865.0 39,365.0 39,365.0 39,365.0Total Infrastructure Replacement 4,745.6 5,695.8 4,647.5 4,466.7 4,532.3 25,184.4 49,272.3 49,272.3 49,272.3Total Wastewater 12,417.6 15,908.8 25,684.5 27,179.7 15,802.3 80,128.4 177,121.3 62,691.7 114,429.6 114,429.6TotalProjectCostGrants &SubsidiesFederalGas TaxSources <strong>of</strong> External FundingOtherDevelopmentChargesDCDebtNet Costto <strong>City</strong>EquipmentReplacementCapitalEnvelopeOtherCapitalDebt411
2018 TO 2022Capital <strong>Budget</strong>WastewaterGrowthTreatment & Plant OperationsST0001 PLANT RERATING- PHOS REDN IN51.0 51.0 102.0 51.0 51.0 306.0 275.4ST0002 WWTP - UPGRADES & STUDIES46.0 198.0 204.0 200.0 198.0 846.0 190.5 634.5 634.5ST0003 WWTP BIOSOLIDS FACILITY UPGRD3,358.0 15,752.0 13,229.0 32,339.0 14,384.7 16,169.5 16,169.5ST0005 WWTP UPGRADES356.0 275.0 631.0 141.9 473.3 473.3ST0006 SCADA UPGRADES102.0 102.0 102.0 102.0 408.0 92.0 306.0 306.0ST0008 WASTEWATER MASTERPLAN102.0 102.0 204.0 183.6Total Treatment & Plant Operations 3,913.0 16,378.0 13,637.0 353.0 453.0 34,734.0 15,268.1 17,583.3 17,583.3Distribution & TransmissionSC0004 WWI3 SPEED- HANLON TO ERAMOSA775.0 775.0 775.0 775.0 3,100.0 614.0 2,418.0 2,418.0SC0005 WWI4 WATERLOO- HANLON TO YORKSHIR180.0 800.0 800.0 1,780.0 560.7 1,157.0 1,157.0SC0008 WWI10 RIVER CROSSING/HANLON EXP350.0 350.0 350.0 350.0 350.0 1,750.0 677.5 997.5 997.5SC0009 WWF3 YORK/SPEED TRUNK EQUALIZN535.0 535.0 1,070.0 963.0SC0011 YORK RD- VICTORIA TO WATSON775.0 775.0 1,550.0 1,395.0SC0012 WW-I-5 REPL YORKSHIRE TRUNK1,380.0 1,380.0 2,760.0 2,484.0SC0018 WWI12 SIPHON IMPROVEMENTS600.0 600.0 600.0 600.0 600.0 3,000.0 1,350.0 1,500.0 1,500.0SC0019 WWI14 I&I REDUCTION IMPL250.0 250.0 400.0 400.0 400.0 1,700.0 765.0 850.0 850.0SC0020 WWI15 NEW GRAVITY SEWERS250.0 250.0 250.0 250.0 250.0 1,250.0 1,125.0SC0021 WWI16 NEW FORCEMAINS150.0 150.0 150.0 150.0 150.0 750.0 675.0SC0027 GORDON- CLAIR TO MALTBY1,500.0 1,500.0 1,350.0Total Distribution & Transmission 3,150.0 3,865.0 6,740.0 3,325.0 3,130.0 20,210.0 11,959.2 6,922.5 6,922.5Infrastructure ReplacementTreatment & Plant OperationsTotal Growth 7,063.0 20,243.0 20,377.0 3,678.0 3,583.0 54,944.0 27,227.3 24,505.8 24,505.8GG0203 WASTEWATER FLEET REPL88.5 127.2 33.9 249.6 249.6 249.6IT0022 WS ITS REPLACEMENT59.8 52.8 66.5 74.1 46.6 299.8 299.8 299.8ST0013 DIGESTER CLEANING PROGRAM204.0 204.0 204.0 204.0 204.0 1,020.0 1,020.0 1,020.0ST0014 DIGESTER GAS PROOFING750.0 750.0 750.0 750.0ST0015 REPAIRS TO PROCESS STRUCTURES500.0 500.0 500.0 500.0 2,000.0 2,000.0 2,000.0Total Treatment & Plant Operations 852.3 884.0 304.4 778.1 1,500.6 4,319.4 4,319.4 4,319.4Distribution & TransmissionGross Project Cost ('000s)Project Number & Description 2018 2019 2020 2021 2022SC0013 WARD ONE - SEWER REPLACEMENT1,000.0 1,000.0 1,000.0 1,000.0 1,000.0 5,000.0 5,000.0 5,000.0SC0014 SEWER REPL VARIOUS2,000.0 2,000.0 2,000.0 2,000.0 2,000.0 10,000.0 10,000.0 10,000.0SC0015 WWI8 WATER- MAPLE TO GORDON865.0 865.0 865.0 865.0SC0025 SEWER INVESTIGATION VARIOUS300.0 300.0 600.0 600.0 600.0SC0026 WWI13 INFRASTRUCTURE IMPROVEMENT 200.0 200.0 200.0 400.0 400.0 1,400.0 1,400.0 1,400.0SC0028 DOWNTOWN CIP200.0 200.0 200.0 200.0 200.0 1,000.0 1,000.0 1,000.0ST0010 WWF2 SPS/FORCEMAIN IMPROVEMENT 200.0 200.0 400.0 600.0 600.0 2,000.0 2,000.0 2,000.0Total Distribution & Transmission 3,900.0 3,600.0 4,665.0 4,200.0 4,500.0 20,865.0 20,865.0 20,865.0Total Infrastructure Replacement 4,752.3 4,484.0 4,969.4 4,978.1 6,000.6 25,184.4 25,184.4 25,184.4Total Wastewater 11,815.3 24,727.0 25,346.4 8,656.1 9,583.6 80,128.4 27,227.3 49,690.2 49,690.2TotalProject Cost(2018-2022)Grants &SubsidiesFederalGas TaxOtherSources <strong>of</strong> External FundingDevelopmentChargesDCDebtNet Costto <strong>City</strong>EquipmentReplacementCapitalEnvelopeOtherCapitalDebt412
<strong>2013</strong> Court Services Operating and Capital <strong>Budget</strong>The <strong>City</strong> provides mandatory Court Services under its agreement with the province <strong>of</strong> Ontario. This service isprovided in accordance with the principles <strong>of</strong> justice and legislative and provincial policy requirements. TheProvincial Offences Act (POA) Court ensures public access to justice within the framework <strong>of</strong> individual rightsguaranteed by the Canadian Charter <strong>of</strong> Rights and Freedoms.Court Administration Court Facilities Court Support Prosecutions• Administer public servicecomponents <strong>of</strong> courtoperations and managestakeholder relations• Administer charges andcourt-related processes andmanage caseload and courtscheduling• Manage Court financialsincluding fine enforcement.• Maintain provincial charge andstatistical databases.• Maintain enhanced publicaccess to justice through theprovision <strong>of</strong> barrier-free courtfacilities including publicservice counters, waiting areasand courtrooms.• Maintain facilities and amenityareas for judicial, administration,prosecution and in-custodyfunctions.• Administer in-courtproceedings and maintain thecourt record• Provide transcript productionand Judicial support services• Provide prosecutorial resourcesand support for trials andappeals <strong>of</strong> provincial regulatoryand municipal <strong>of</strong>fences• Maintain early resolutioninitiatives supportingefficiencies in casemanagement and public accessto justice• Manage case work includingcase law research and thepreparation <strong>of</strong> factums andlegal arguments<strong>City</strong> <strong>of</strong> <strong>Guelph</strong> – <strong>2013</strong> Enterprise <strong>Budget</strong>413
<strong>2013</strong> Court Services Operating and Capital <strong>Budget</strong>>> 2012 AccomplishmentsCourt Administration• Implemented and presented the multi-year operating budget forecast• Used digital reporting to reduce costs and improve use <strong>of</strong> provincial reports• Enhanced communications through the Court Services website and implemented on-line court formsCourt Facilities• On target to complete outstanding interior, exterior and grounds improvements associated with the POAcourt construction and renovation.Prosecutions• Implemented electronic Charge Wording database.• Enhanced statistical database to help manage program improvements to early resolution processes andtime to trial initiativesCourt Support• Provided in-court support and transcription services to expanded Master Court plan including severalsignificant long-term trials• Increased use <strong>of</strong> digital transcription for Judicial Officers preparing case judgments.<strong>City</strong> <strong>of</strong> <strong>Guelph</strong> – <strong>2013</strong> Enterprise <strong>Budget</strong>414
<strong>2013</strong> Court Services Operating and Capital <strong>Budget</strong>>> Key Performance MeasuresCharges, Trial Volumes and Case Resolution35,00030,00030,654 30,81628,27331,76630,37825,00023,77420,00015,00010,0005,00005,5882,0057,1982,2435,6722,0884,7731,4825,950 6,2271,3162006 2007 2008 2009 2010 20112,013Charges Trials Cases ResolvedCharges are issued by enforcement agencies and police services within the court service area. The volume <strong>of</strong>charges in <strong>Guelph</strong>-Wellington remains relatively stable with the exception <strong>of</strong> 2009, where the volumedecreased by 16% from 2008 levels (18% below the five-year average).The average annual trial rate remains relatively stable at approximately 20% <strong>of</strong> charges per year. The number <strong>of</strong>trial matters being resolved through the Early Resolution Process (matters resulting in pleas to lesser chargeswithout proceeding to trial) has returned to a higher plea rate since the slight decline in 2010.<strong>City</strong> <strong>of</strong> <strong>Guelph</strong> – <strong>2013</strong> Enterprise <strong>Budget</strong>415
<strong>2013</strong> Court Services Operating and Capital <strong>Budget</strong>Revenue/Expenditure$4,500,000$3,500,000$3,000,000$2,500,000$2,000,000$1,500,000$1,000,000$500,00002006 2007 2008 2009 2010 2011Gross Revenue Expenditures Net RevenueGross revenue averages $3.5 million per year.Operating costs are approximately 56 per cent <strong>of</strong> gross revenue.Net revenue for distribution between the <strong>City</strong> and County averages $1.7 million per year.Gross revenue peaked in 2008, due to approximately $700,000 in fines with respect to one set <strong>of</strong> Ministry <strong>of</strong>Labour cases. Conversely, gross revenue fell by $600,000 in 2009, due to a drop in charges filed with the Courtand less fine payments being made during the global economic downturn. Gross revenue appears to havestabilized over 2010 and 2011.<strong>City</strong> <strong>of</strong> <strong>Guelph</strong> – <strong>2013</strong> Enterprise <strong>Budget</strong>416
<strong>2013</strong> Court Services Operating and Capital <strong>Budget</strong>$1,200,000$1,000,000$800,000$600,000$400,000$200,000$02006 2007 2008 2009 2010 2011Net Revenue $ to Reserve $ to Operating FundTo the end <strong>of</strong> 2011, the <strong>City</strong>’s portion <strong>of</strong> net revenue was allocated to the <strong>City</strong>’s Tax-Supported Operating Fund,less the amount dedicated to the POA Reserve to service capital debt for court facilities. Beginning in 2012, netrevenue has been allocated to the IT and Capital Reserves and the POA Contingency Fund within theframework <strong>of</strong> the Enterprise <strong>Budget</strong> model.<strong>City</strong> <strong>of</strong> <strong>Guelph</strong> – <strong>2013</strong> Enterprise <strong>Budget</strong>417
<strong>2013</strong> Court Services Operating and Capital <strong>Budget</strong>Defaulted Fines – EnforcementAt transfer <strong>of</strong> court operations from the Province to the <strong>City</strong> in May 2000, the outstanding balance <strong>of</strong> fines indefault was $6.1M. From 2000-2007 the default balance rose to $11M, although municipal collection effortsreduced the annual rate <strong>of</strong> increase from 11.9% to 2.6% during that time period. In 2008, the <strong>City</strong> undertookthe “write-<strong>of</strong>f” <strong>of</strong> $5.1M <strong>of</strong> defaulted fines in accordance with PSAB accounting principles$12,000,000$10,000,000$8,000,000$6,000,000$4,000,000$2,000,000$02001 2002 2003 2004 2005 2006 2007 2008 2009 2010 2011Fines in DefaultDefaulted Fines RecoveredThe trend from 2008 to 2011 shows the start <strong>of</strong> gradual decrease in Fines in Default and the increase in theDefaulted Fines Recovered. The trends are moving in the right direction towards lower default and highercompliance rates.<strong>City</strong> <strong>of</strong> <strong>Guelph</strong> – <strong>2013</strong> Enterprise <strong>Budget</strong>418
<strong>2013</strong> Court Services Operating and Capital <strong>Budget</strong>$1,200,000$1,000,000$800,000$600,000$400,000$200,000$02001 2002 2003 2004 2005 2006 2007 2008 2009 2010 2011Fine Recovery - Outsourced Fine Recovery - Inhouse Outsource costsFine collection was outsourced until 2007. The <strong>City</strong> established its in-house collection program in 2005, andeliminated outsourcing by the end <strong>of</strong> 2007. In-house collections efforts have increased revenue recoveredfrom defaulted fines by 73 per cent over outsourcing efforts, and have eliminated the costs <strong>of</strong> outsourcing.Collection <strong>of</strong> defaulted fines reached the $1 million mark in 2010 and 2011 and it is anticipated that this level<strong>of</strong> collection will be achieved again in 2012.<strong>City</strong> <strong>of</strong> <strong>Guelph</strong> – <strong>2013</strong> Enterprise <strong>Budget</strong>419
<strong>2013</strong> Court Services Operating and Capital <strong>Budget</strong>>> <strong>2013</strong> ObjectivesCourt Administration• Implement phase one <strong>of</strong> e-ticketing (automated charge filing by some enforcement agencies and dataupload to provincial database)• Further enhance <strong>of</strong> online fine payment systems and proceduresCourt Support• Further use <strong>of</strong> digital transcripts technology to reduce the production <strong>of</strong> manual transcriptsCourt Facilities• Implement comprehensive preventive maintenance program• Increase efficiencies associated with ongoing maintenance and repairs through a full time employeeexpansion in the <strong>2013</strong> budgetProsecutions• Enhance public access to justice be revising the early resolution process to reduce the number <strong>of</strong> courtvisits required to address a case<strong>City</strong> <strong>of</strong> <strong>Guelph</strong> – <strong>2013</strong> Enterprise <strong>Budget</strong>420
<strong>2013</strong> Court Services Operating and Capital <strong>Budget</strong>>> Key Changes in <strong>2013</strong>The department must address and mitigate the effect <strong>of</strong> rising energy and commodity prices and certaincompensation costs.All capital asset expenditures formerly included in the tax-supported budget are now funded entirely throughthe Court Services budget. The capital forecasts for the Court Services facility and its infrastructure willcontinue to be reviewed to ensure adequate contributions to reserve funds.Establish contributions to a new POA Contingency reserve to ensure adequate funds are available should anunanticipated variance occur.Expected increase use <strong>of</strong> interpreters for court proceedings and increasing rates for interpretation services.Increase by-law fines by $59,200 over 2012 due to improved collection effortsIncrease compensation costs related to a new full time employee - costs are completely <strong>of</strong>fset by a reductionin purchased services ($107,760) and internal charges ($71,920);Increase bank charges by $10,300 due to increased use <strong>of</strong> credit card paymentsNet revenue for distribution is down from 2012 resulting in a decrease in the payment to the County <strong>of</strong>Wellington <strong>of</strong> $48,796Capital financing increased by $111,920 over 2012 to pay for the <strong>City</strong>’s portion <strong>of</strong> current and future capitalexpenditures and move toward achieving target levels in the Court’s contingency reserve<strong>City</strong> <strong>of</strong> <strong>Guelph</strong> – <strong>2013</strong> Enterprise <strong>Budget</strong>421
<strong>2013</strong> Court Services Operating and Capital <strong>Budget</strong>>> <strong>2013</strong> Operating <strong>Budget</strong>The <strong>2013</strong> Court Services Operating <strong>Budget</strong> has gross expenditures <strong>of</strong> $3,644,200, including internal chargesand transfers to reserves. The chart below shows the cost by service:<strong>2013</strong> Court Services Proposed Operating <strong>Budget</strong> (by Service Area)2012Approved<strong>Budget</strong><strong>2013</strong> <strong>Budget</strong> by ServiceCourtAdministration Court Support Prosecutions Facilities TotalYear/YearChange ($)Year/YearChange (%)RevenueBy-Law Fines (72,000) (131,200) - - - (131,200) (59,200) 82.2%POA Fines (3,500,000) (3,500,000) - - - (3,500,000) - 0.0%Facility Rentals (8,250) (4,500) - - (4,500) 3,750 -45.5%Transcripts - - - - (8,500) (8,500) (8,500)Total Revenues (3,580,250) (3,635,700) - - (8,500) (3,644,200) (63,950) 1.8%ExpendituresCompensation 1,137,020 622,486 175,771 416,414 87,696 1,302,367 165,347 14.5%Purchased Goods 104,831 18,856 2,847 5,079 82,908 109,690 4,859 4.6%Purchased Services 476,429 100,270 219,386 24,562 24,451 368,669 (107,760) -22.6%Bank Charges 28,700 39,000 - - - 39,000 10,300 35.9%Payment to County 752,643 703,847 703,847 (48,796) -6.5%Debt Charges 400,000 400,000 400,000 - 0.0%Internal Charges 357,500 108,825 66,089 48,215 62,451 285,580 (71,920) -20.1%Total Expenditures 3,257,123 1,593,284 464,093 494,270 657,506 3,209,153 (47,970) -1.5%Net <strong>Budget</strong> before Allocation <strong>of</strong> (323,127) (2,042,416) 464,093 494,270 649,006 (435,047) (111,920) 34.6%Facility Costs & Reserve FinancingReserve Financing 323,127 224,445 210,602 435,047 111,920 34.6%Allocation <strong>of</strong> Facility Costs 98,937 114,389 44,180 (257,506) - -Net <strong>Budget</strong> After Allocation <strong>of</strong>- (1,719,034) 578,482 538,450 602,102 0 0Facility Costs & Reserve FinancingFull Time Equivalents 15.0 8.28 2.37 4.30 1.05 16.0 1.0 6.7%<strong>City</strong> <strong>of</strong> <strong>Guelph</strong> – <strong>2013</strong> Enterprise <strong>Budget</strong>422
<strong>2013</strong> Court Services Operating and Capital <strong>Budget</strong>As presented, the Court Services <strong>2013</strong> Operating budget includes a request for 1 FTE. Full details about thisrequest can be found at the end <strong>of</strong> the Court Services section (Tab 4).Court SupportCompensation38%Purchased Goods1%Purchased Services47%Internal Charges14%Court AdministrationPurchased Services6%Purchased Goods1%Compensation34%Bank Charges2%Payment to County39%Reserve Financing12%Internal Charges6%<strong>City</strong> <strong>of</strong> <strong>Guelph</strong> – <strong>2013</strong> Enterprise <strong>Budget</strong>423
<strong>2013</strong> Court Services Operating and Capital <strong>Budget</strong>FacilitiesCompensation10%Reserve Financing24%Purchased Goods10%Purchased Services3%Internal Charges7%Debt Charges46%ProsecutionsInternal Charges10%Purchased Services5%Purchased Goods1%Compensation84%<strong>City</strong> <strong>of</strong> <strong>Guelph</strong> – <strong>2013</strong> Enterprise <strong>Budget</strong>424
<strong>2013</strong> Court Services Operating and Capital <strong>Budget</strong>>> Multi-year Operating <strong>Budget</strong>Assumptions used in developing the multi-year operating budget forecast include:• Salaries, Wages & Benefits – annual percentage increases pursuant to collective agreements and increasesin required pr<strong>of</strong>essional trade licence fees;• Purchased Goods – annual increases <strong>of</strong> 2% for most goods, but projecting some cost reductions wheretransitioning from goods (e.g. printing, stationary and forms) to innovative solutions (e.g. more on-lineservices and the implementation <strong>of</strong> e-ticketing initiatives)• Purchased Services – annual increases <strong>of</strong> 2% for most services, but projecting overall purchased servicescost reductions each year due to program changes to reduce expenses related to provincial charge backsfor court time (adjudication and crown prosecution costs)• Financial Expenses – annual increases based on an analysis <strong>of</strong> historical trends which shows more finepayments being made by credit card resulting in higher financial processing charges• Program Support Costs – usual annual increases assessed by most internal departments, but projectingoverall program support cost reductions each year due to reducing maintenance expenditures as a result <strong>of</strong>transitioning to in-house maintenance personnel• Revenues – most revenues will remain relatively stable in future years with some increase projected in rentrevenue due to higher use <strong>of</strong> POA courtrooms by other levels <strong>of</strong> court.<strong>City</strong> <strong>of</strong> <strong>Guelph</strong> – <strong>2013</strong> Enterprise <strong>Budget</strong>425
<strong>2013</strong> Court Services Operating and Capital <strong>Budget</strong>The forecast below is provided for information only.<strong>2013</strong> Multi Year Court Services Proposed Operating <strong>Budget</strong><strong>2013</strong>Proposed<strong>Budget</strong>Total 2014Forecasted<strong>Budget</strong>Total 2015Forecasted<strong>Budget</strong>Total 2016Forecasted<strong>Budget</strong>RevenueBy-Law Fines (131,200) (132,200) (132,200) (132,200)POA Fines (3,500,000) (3,550,000) (3,575,000) (3,600,000)Facility Rentals (4,500) (4,650) (4,800) (4,950)Transcript Revenue (8,500) (8,500) (8,500) (8,500)Total Revenues (3,644,200) (3,695,350) (3,720,500) (3,745,650)ExpendituresCompensation 1,302,367 1,334,917 1,368,286 1,402,496Purchased Goods 109,690 106,645 108,640 110,835Purchased Services 368,669 367,020 366,194 364,400Bank Charges 39,000 42,000 45,000 48,000Payment to County 703,847 715,044 710,851 706,620Debt Charges 400,000 400,000 400,000 400,000Internal Charges 285,580 282,480 278,480 274,480Total Expenditures 3,209,153 3,248,106 3,277,449 3,306,830Net <strong>Budget</strong> before Allocation <strong>of</strong> Facility Costs & Reserve Financing (435,047) (447,244) (443,051) (438,820)Reserve Financing 435,047 447,244 443,051 438,820Allocation <strong>of</strong> Facility Costs -Net <strong>Budget</strong> After Allocation <strong>of</strong> Facility Costs & Reserve Financing 0 0 0 0Full Time Equivalents 16.0 16.0 16.0 16.0<strong>City</strong> <strong>of</strong> <strong>Guelph</strong> – <strong>2013</strong> Enterprise <strong>Budget</strong>426
<strong>2013</strong> Court Services Operating and Capital <strong>Budget</strong>>> <strong>2013</strong> Capital <strong>Budget</strong>POA Capital SummaryCourt Services’ capital budget identifies the most appropriate timing for capital work, the project costs andfunding sources. In <strong>2013</strong>, total capital expenditures are $77,900, and the nine year forecast is $461,900.The capital budget and forecast is allocated between the following categories and funding sources:Project CategoryProjectCostCountyContributionsCapitalReservesCourt Facilities 270.0 135.0 135.0Court Administration 269.8 134.9 134.9Total Capital <strong>Budget</strong> 539.8 269.9 269.9The <strong>2013</strong> Courts Services capital budget includes regular replacement for information technology equipmentsuch as computers, s<strong>of</strong>tware, printers and scanners. Subsequent years allocate funds for life cycle capitalrepairs to the POA Court facility.A detailed project list is included at the end <strong>of</strong> this section.<strong>City</strong> <strong>of</strong> <strong>Guelph</strong> – <strong>2013</strong> Enterprise <strong>Budget</strong>427
<strong>2013</strong> Court Services Operating and Capital <strong>Budget</strong>>> Reserves and Reserve FundsThe <strong>City</strong> maintains three separate funds used for Court Services capital works and operations. The chart belowdescribes the purpose <strong>of</strong> each reserve (non-interest earning) and reserve fund (interest earning), theforecasted <strong>2013</strong> ending balance, the reserve or reserve fund target and <strong>2013</strong> forecasted target.Court Services Reserves and Reserve FundsReserve or Reserve FundCourt Services Contingency ReserveCourt Services Capital Reserve FundCourt Services DC Reserve FundPurposeThe reserve is funded from operating surpluses. Funds are transferredout at the direction <strong>of</strong> Council to help stabilize the rate as part <strong>of</strong> theannual budget process, to fund a year-end operating deficit or to payfor capital projects that will result in operating savings. The balance inthis reserve should be 10% <strong>of</strong> gross operating expenditures.Funds are transferred in as contributions from the operating budgetor any remaining surplus not committed to another reserve uponclosing individual capital projects. This reserve is used to fund the<strong>City</strong>'s share <strong>of</strong> capital works related to Court Services assets as well asfund the annual debt servicing costs <strong>of</strong> debt related to the POAfacility. Annual contributions to this reserve should, at a minimum,equal depreciation expense.Funds are transferred in as collected from developers. The reservefund is used to fund the growth-related component <strong>of</strong> Court Servicesprojects identified in the Development Charges Background Studyand approved in the capital budget.<strong>2013</strong>ForecastedBalance Target$23,995 10% <strong>of</strong> grossoperatingexpenditures$499,705 > = 100% <strong>of</strong>annualdepreciationexpense$56,291 Monitor that DCcollections areoccurring asforecast<strong>2013</strong>Forecast15%100%Updatedreserve fundforecastsquarterly<strong>City</strong> <strong>of</strong> <strong>Guelph</strong> – <strong>2013</strong> Enterprise <strong>Budget</strong>428
<strong>2013</strong> Court Services Operating and Capital <strong>Budget</strong>The graph below shows the forecasted <strong>2013</strong>-22 balance for each <strong>of</strong> the reserves and reserve funds. As shown,the balance in the contingency reserve levels out in 2015. As long as the <strong>City</strong>’s share <strong>of</strong> expenditures is paid forand reserves are adequately funded the <strong>City</strong> would be eligible to receive a dividend.<strong>2013</strong>–2022 Court Services Reserves and Reserve Funds(Projected Balances)$3.5$3$2.5Millions$2$1.5$1$0.5$02012<strong>2013</strong> 2014 2015 2016 2017 2018 2019 2020 2021DC Capital Contingency<strong>City</strong> <strong>of</strong> <strong>Guelph</strong> – <strong>2013</strong> Enterprise <strong>Budget</strong>429
CITY OF GUELPH<strong>2013</strong> TAX SUPPORTED CAPITAL BUDGET2014 TO 2022 TAX SUPPORTED CAPITAL FORECASTPOACourt FacilitiesGG0158 LIFE CYCLE- POA45.0 225.0 270.0 135.0 135.0 135.0Total Court Facilities 45.0 225.0 270.0 135.0 135.0 135.0Court AdministrationGross Project Cost $(000's)Project Number & Description <strong>2013</strong> 2014 2015 2016 2017GG0220 POA SCANNING EQUIPMENT25.0 25.0 12.5 12.5 12.5IT0014 POA ITS REPLACEMENT25.4 10.4 26.5 26.4 21.5 109.0 219.2 109.6 109.6 109.6IT0028 IT STRATEGIC PLAN - POA7.5 10.6 7.5 25.6 12.8 12.8 12.8Total Court Administration 32.9 21.0 34.0 26.4 21.5 134.0 269.8 134.9 134.9 134.9Total POA 77.9 21.0 34.0 26.4 21.5 359.0 539.8 269.9 269.9 269.9Next5 YearsTotalProjectCostGrants &SubsidiesFederalSources <strong>of</strong> External FinancingGas Tax Other DC'sDCDebtNet Costto <strong>City</strong>EquipmentReplacement<strong>City</strong>ReservesDebt430
CITY OF GUELPH2018 TO 2022 TAX SUPPORTED CAPITAL FORECAST DETAILSPOAGross Project Cost $(000's)Sources <strong>of</strong> External FinancingTotalProject CostGrants &FederalDCNet CostEquipment<strong>City</strong>Court FacilitiesProject Number & Description 2018 2019 2020 2021 2022(2018-2022)GG0158 LIFE CYCLE- POA25.0 200.0 225.0 112.5 112.5 112.5SubsidiesGas Tax Other DC'sDebtto <strong>City</strong>ReplacementReservesDebtTotal Court Facilities 25.0 200.0 225.0 112.5 112.5 112.5Court AdministrationGG0220 POA SCANNING EQUIPMENT25.0 25.0 12.5 12.5 12.5IT0014 POA ITS REPLACEMENT26.3 19.3 21.0 23.6 18.8 109.0 54.5 54.5 54.5Total Court Administration 26.3 44.3 21.0 23.6 18.8 134.0 67.0 67.0 67.0Total POA 26.3 69.3 221.0 23.6 18.8 359.0 179.5 179.5 179.5431
<strong>2013</strong> Ontario Building Code (OBC) Administration <strong>Budget</strong>The Building Services department authorizes all building construction and demolition in <strong>Guelph</strong>. Thedepartment is provincially mandated to administer and enforce the Ontario Building Code, and provinciallegislation requires staff to maintain certification to meet provincial standards, perform mandatory inspections,and issue permits within mandated time frames.Building Services provides the following public services associated with the administration and enforcement<strong>of</strong> the Ontario Building Code:• Pre-permit consultation, plans examination, technical reviews and application processing• Issue permits within mandated time frames to ensure conformity to the Ontario Building Code• On-site inspections to ensure conformity with approved permit drawings, specifications, the OntarioBuilding Code Act and regulations• Provide enforcement and initiate legal proceedings as requiredThese activities are completely funded by revenues generated from building permit fees.Note: Building Services also administers and enforces several <strong>City</strong> by-laws, facilitates <strong>Guelph</strong>’s Committee <strong>of</strong> Adjustment andmanages <strong>Guelph</strong>’s termite control and backflow prevention programs. These activities are included in the tax-supported operatingbudget.>> 2012 AccomplishmentsBuilding Services implemented mobile technology allowing staff to enter building inspection results while inthe field. The technology increases efficiency by giving staff and customers quick access to current onlineinformation.In partnership with industry partners, <strong>Guelph</strong>’s Building Services department implemented significant BuildingCode changes related to energy conservation. Changes came into effect January 1, 2012.<strong>City</strong> <strong>of</strong> <strong>Guelph</strong> – <strong>2013</strong> Enterprise <strong>Budget</strong>432
<strong>2013</strong> Ontario Building Code (OBC) Administration <strong>Budget</strong>>> Key Performance MeasuresIssuing Building PermitsPermits Issued3000250020001500100050002009 2010 2011 2012 <strong>2013</strong>• 2012 and <strong>2013</strong> permit volumes reflect a decrease in single-detached dwellings and an increase in multiresidentialprojects.• The percentage <strong>of</strong> permits not issued within the legislated time frames decreased in 2012 and will continueto decrease with the addition <strong>of</strong> a Plans Examiner.<strong>City</strong> <strong>of</strong> <strong>Guelph</strong> – <strong>2013</strong> Enterprise <strong>Budget</strong>433
<strong>2013</strong> Ontario Building Code (OBC) Administration <strong>Budget</strong>1) Turnaround Times for House PermitsTurnaround Times for House PermitsThe <strong>City</strong> acknowledges it has not been meeting the expectations <strong>of</strong> its industry partners and customers, and isworking to improve turnaround times for house permits.Staff reductions in 2010 impacted the department’s ability to meet the maximum turnaround time <strong>of</strong> five daysfor all house permits – a service level established in partnership with the <strong>Guelph</strong> and District HomebuildersAssociation and maintained since 1995.The addition <strong>of</strong> a Plans Examiner will reduce turnaround times significantly.2010 Actual 2011 Actual 2012 Projected <strong>2013</strong> ForecastPermits Issued 359 256 245 245Legislated Turnaround Time (days) 10 10 10 10Average Turnaround Times (days) 5.6 7.6 8.5 6.5Permits Issued Within Legislated Turnaround Times 96% 93% 95% 97%<strong>City</strong> <strong>of</strong> <strong>Guelph</strong> – <strong>2013</strong> Enterprise <strong>Budget</strong>434
<strong>2013</strong> Ontario Building Code (OBC) Administration <strong>Budget</strong>Building InspectionsIn 2012 and <strong>2013</strong>, Building Services staff will conduct approximately 23,500 on-site inspections within thelegislated 48 hours. Currently the majority <strong>of</strong> inspections are performed within 24 hours. Building Services staffbelieve that this service level is necessary to accommodate demanding schedules associated withconstruction projects.30,00025,00020,00015,000Building Inspections10,0005,00002009 2010 2011 2012 <strong>2013</strong><strong>City</strong> <strong>of</strong> <strong>Guelph</strong> – <strong>2013</strong> Enterprise <strong>Budget</strong>435
<strong>2013</strong> Ontario Building Code (OBC) Administration <strong>Budget</strong>>> <strong>2013</strong> ObjectivesIn collaboration with the <strong>City</strong>’s Information Technology department, Building Services plans to enhance thecity’s integrated electronic building permit, inspection and licensing system (AMANDA) making the systemmore efficient and improving service to all customer groups.Implement recommendations <strong>of</strong> the Joint Operational Review <strong>of</strong> the development application review processmanaged by the Planning, Building and Engineering and Economic development departments.To improve the department’s ability to meet mandated time frames for building inspections and permits,additional staff resources will be allocated to initiatives designed to increase efficiency and enhance customerservice.>> Key Changes in <strong>2013</strong>Uncertain economic conditions continue to result in a high variability in building permit activity, making itdifficult to predict future revenues.Hiring three additional staff will not impact permit fees, but will reduce the department’s contribution to theOBC Administration reserve in <strong>2013</strong>. The Council-approved policy regarding the OBC Administration reservefund permits this use and the department expects to continue contributing to the reserve fund in 2014.Reduce contribution to OBC reserve to zero in <strong>2013</strong> to fund three additional staff. The department expects tocontinue contributing to the reserve starting in 2014.Transfer $36,700 from reserves to <strong>of</strong>fset one time costs associated with hiring three additional staff (ie: vehicleacquisitions, advertising)Increase internal charges ($400,170), purchased goods ($92,100) and purchased services ($41,100) due to threeadditional staffIncrease licensing and permit revenue by $400,000 due to higher permit activity experienced through 2012<strong>City</strong> <strong>of</strong> <strong>Guelph</strong> – <strong>2013</strong> Enterprise <strong>Budget</strong>436
<strong>2013</strong> Ontario Building Code (OBC) Administration <strong>Budget</strong>>> <strong>2013</strong> Operating <strong>Budget</strong>The <strong>2013</strong> OBC Administration <strong>Budget</strong> has gross expenditures <strong>of</strong> $2,836,700, including internal charges andtransfers from reserves. The chart below shows the cost by service area:Proposed <strong>2013</strong> OBC Administration Operating <strong>Budget</strong> (by Service Area)2012Approved<strong>Budget</strong><strong>2013</strong> OBCRequested<strong>Budget</strong>Year/YearChange ($)Year/YearChange (%)RevenueLicenses and Permits ($2,400,000) ($2,800,000) ($400,000) 17%Transfer from Reserves ($94,680) ($36,700) $57,980 0%Total Revenue ($2,494,680) ($2,836,700) ($342,020) 14%ExpendituresPurchased Goods 30,200 122,300 92,100 305%Purchased Services 39,400 80,500 41,100 104%Bank Charges 20,000 20,000 0 0%Internal Charges 2,213,730 2,613,900 400,170 18%Transfer to Reserves 191,350 0 (191,350) -100%Total Expenditures 2,494,680 2,836,700 342,020 14%Net <strong>Budget</strong> $0 $0 $0 0%<strong>City</strong> <strong>of</strong> <strong>Guelph</strong> – <strong>2013</strong> Enterprise <strong>Budget</strong>437
<strong>2013</strong> Ontario Building Code (OBC) Administration <strong>Budget</strong>As presented, the OBC Administration budget reflects increased recoveries for three new FTE’s. Descriptions <strong>of</strong>these FTEs are available at the end <strong>of</strong> the OBC Administration section (Tab 5).<strong>2013</strong> OBC Administration <strong>Budget</strong>($2.8 million)Bank Charges1%Purchased Services3%Purchased Goods4%Internal Charges92%2012/<strong>2013</strong> Internal Charges Details2012 <strong>2013</strong>Year/YearChangeDirect Support Costs from Non-OBC Administration 1,702,830 2,155,400 452,570Interdepartmental Service Area Support Costs (e.g. Legal, HR, etc) 510,900 458,500 (52,400)Total Internal Charges 2,213,730 2,613,900 400,170<strong>City</strong> <strong>of</strong> <strong>Guelph</strong> – <strong>2013</strong> Enterprise <strong>Budget</strong>438
<strong>2013</strong> Ontario Building Code (OBC) Administration <strong>Budget</strong>>> Multi-year Operating <strong>Budget</strong>Building Services revenue estimates are based on projected building permit sales, and expenditures are basedon the following:Increased compensation costs by three per cent per year in line with historical year over year changes(recognized as an internal charge)Estimated increases <strong>of</strong> two per cent per year for other expendituresThe summary below is being provided for information only.<strong>2013</strong> – 20 16 Multi-year Operating <strong>Budget</strong><strong>2013</strong> OBCRequested<strong>Budget</strong>2014Proposed<strong>Budget</strong>2015Proposed<strong>Budget</strong>2016Proposed<strong>Budget</strong>RevenueLicenses and Permits ($2,800,000) ($2,875,000) ($2,950,000) ($3,000,000)Transfer from Reserves ($36,700) $0 $0 $0Total Revenue ($2,836,700) ($2,875,000) ($2,950,000) ($3,000,000)ExpendituresPurchased Goods 122,300 48,900 49,900 50,800Purchased Services 80,500 57,000 58,100 59,300Bank Charges 20,000 20,400 20,800 21,200Internal Charges 2,613,900 2,687,100 2,761,900 2,838,700Transfer to Reserves 0 61,600 59,300 30,000Total Expenditures 2,836,700 2,875,000 2,950,000 3,000,000Net <strong>Budget</strong> $0 $0 $0 $0<strong>City</strong> <strong>of</strong> <strong>Guelph</strong> – <strong>2013</strong> Enterprise <strong>Budget</strong>439
<strong>2013</strong> Ontario Building Code (OBC) Administration <strong>Budget</strong>>> <strong>2013</strong> Capital <strong>Budget</strong>A recommendation from the Corporate Technology Strategy is to review and enhance the AMANDA system.Building Services will contribute to this capital project as follows:<strong>2013</strong> - $9,0002014 - $31,2002015 - $31,200<strong>2013</strong>–2022 Ontario Building Code Capital <strong>Budget</strong> & Forecast - Service Based(‘000s)Project Category Project Cost Reserve FundedIT Strategic Plan 71.4 71.4Total Capital <strong>Budget</strong> 71.4 71.4A detailed list <strong>of</strong> projects is included at the end <strong>of</strong> this section.>> Reserves and Reserve FundsThe Building Code Act allows municipalities to set permit fees to cover the cost <strong>of</strong> the administration andenforcement <strong>of</strong> the Building Code Act and make reasonable contributions to a reserve.The OBC Administration reserve can be used to <strong>of</strong>fset lean years, implement service enhancements and coverunexpected expenses. A Council-approved maximum reserve limit - equal to one year <strong>of</strong> operating costs -allows staff to prevent automatic increases while maintaining a healthy reserve.<strong>City</strong> <strong>of</strong> <strong>Guelph</strong> – <strong>2013</strong> Enterprise <strong>Budget</strong>440
<strong>2013</strong> Ontario Building Code (OBC) Administration <strong>Budget</strong>The chart that follows describes the purpose <strong>of</strong> the reserve, the forecasted 2012 to 2015 year end balancesand the upset limits.Reserve or Reserve FundPurpose<strong>2013</strong>ForecastedBalanceUpset Limit<strong>2013</strong>ForecastBuilding ServicesStabilization ReserveFunds are transferred in from any surplus buildingpermit fee revenues generated as a result <strong>of</strong>volume. Funds are transferred out, with Councilapproval, to stablize revenues in lean years or tocover unexpected expenses such as training, legalfees, staffing needs, and associated support costs.1,344,963 100% <strong>of</strong> one-year<strong>of</strong> Operating Costs(not including transfersto reserves)47%With future expenditures such as mobile technology and the volatile nature <strong>of</strong> the construction industry, it isprojected that the reserve will be at the maximum limit within 7 to 10 years.The graph below shows the inter-relationship between permit fees, operating costs and reserve activities.$3,000,000$2,500,000$2,000,000$1,500,000$1,000,000$500,000Permit Fees, Operating Costs and Reserve Activities$02006 2007 2008 2009 2010 2011 2012 <strong>2013</strong>2014 Projected2015 Projected2016 ProjectedPermit Fees ($) Operating Costs ($) Reserve Balance ($)<strong>City</strong> <strong>of</strong> <strong>Guelph</strong> – <strong>2013</strong> Enterprise <strong>Budget</strong>441
Full-Time Equivalent (FTE) Summary<strong>2013</strong> Tax Supported Full-time Equivalent SummaryDepartment<strong>2013</strong> BaseFTEGrowthNewServicesImpactFromCapitalCSP<strong>2013</strong> FTEChanges<strong>2013</strong> TotalFTEDetail A B C D E F=B+C+D+E G=A+FCAO - Mayor, Strategic Planning & Initiatives 7.00 1.00 1.00 8.0Operations, Transit & Emergency Services 612.8 5.20 1.50 - - 6.70 619.5Planning, Building Engineering & Environment* 205.60 3.50 1.00 4.50 210.1Community & Social Services 147.30 3.48 3.48 150.8Corporate and Human Resources 70.00 1.00 5.00 6.00 76.0Finance 43.00 1.00 1.00 44.0Total <strong>City</strong> Departments 1,085.70 10.70 2.50 3.48 6.00 22.68 1,108.38Police 284.20 - 284.2Library 80.50 - 80.5Total Local Boards 364.70 - - - - - 364.70TOTAL 1,450.40 10.70 2.50 3.48 6.00 22.68 1,473.08FTE Count (FTE = Full Time Equivalent)FTE= a budgeted amount representing permanent full and part-time productive hours <strong>of</strong> work. Department's budget hours depending on service needs.Full time hours can vary from 2184 to 1820 hours per year, while part time hours can vary from 20 hours to 30 hours in most cases.FTE’s are NOT the same thing as headcount or the number <strong>of</strong> positions and jobs in the <strong>City</strong>.442
Appendix 2: <strong>City</strong> <strong>of</strong> <strong>Guelph</strong><strong>2013</strong> Tax Supported Operating <strong>Budget</strong>Growth RequestsPosition NameDescriptionBusinessUnitFTE ImpactSalaries &BenefitsPurchasedGoods &ServicesOne-TimeCostsRevenue /ReducedExpenditure<strong>2013</strong> Total 2014 Total 2015 TotalPlanning & Building, Engineering, EnvironmentProperty Standards Inspector (Part-Time)A casual part-time position as a Property Standards Inspector who will work in theInspection Services area <strong>of</strong> Building Services is being requested. The primary focus<strong>of</strong> this position will be to enhance enforcement <strong>of</strong> the <strong>City</strong>’s Property Standards andYard Maintenance By-laws in the spring and summer months to ensure response tocomplaints within our customer service standard <strong>of</strong> 3 business days.713-0100 0.50 19,200 4,900 4,300 0 28,400 24,400 24,800Supervisor <strong>of</strong> Inspections (Funded through the Enterprise<strong>Budget</strong>)Building Inspector II (Funded through the Enterprise<strong>Budget</strong>)A permanent full time position, the Supervisor <strong>of</strong> Inspections will report to theManager <strong>of</strong> Inspection Services and will be responsible for the supervision, guidanceand direction <strong>of</strong> all Building Inspectors and related support staff. The Supervisor <strong>of</strong>Inspections will also be responsible for the implementation <strong>of</strong> several bold culturalchange initiatives, such as a Dormant Permits Program related to permits withoutstanding inspections, a Mentoring and Job Shadowing Program, a Training andDevelopment Program for Building Inspectors and an enhanced Legal ProceedingsProgram.A permanent full time position, the Building Inspector II will work in the InspectionServices area <strong>of</strong> Building Services. The primary purpose <strong>of</strong> this position will be toconduct Ontario Building Code inspections. Duties will also include inspections andfollow up-up efforts on non-compliance issues such as dormant permits withoutstanding inspections.It is proposed that the present Manager <strong>of</strong> Permit and Zoning Services position beseparated into two positions;a) A Manager <strong>of</strong> Permit Services position, andb) A Manager <strong>of</strong> Zoning Services position.713-0100 1.00 115,900 16,700 33,800 (166,400) 0 0 0713-0100 1.00 95,100 14,400 33,800 (143,300) 0 0 0Manager <strong>of</strong> Permit Services (Funded through theEnterprise <strong>Budget</strong>)The Manager <strong>of</strong> Permit Services will report to the Chief Building Official and will beresponsible for the management, supervision, guidance, and direction <strong>of</strong> all PermitServices Staff. This person will be responsible for the issuance <strong>of</strong> all Building Permitsin the <strong>City</strong> <strong>of</strong> <strong>Guelph</strong>, as well as monitoring the quality <strong>of</strong> permit review and theprovincially mandated building permit turnaround times.The Manager <strong>of</strong> Zoning Services will report to the Chief Building Official and will beresponsible for the management, supervision, guidance, and direction <strong>of</strong> all ZoningServices Staff. This person will be responsible for the administration andenforcement <strong>of</strong> the Zoning By-law and related municipal by-laws.It is proposed that the present Manager <strong>of</strong> Permit and Zoning Services position beseparated into two positions;a) A Manager <strong>of</strong> Permit Services position, andb) A Manager <strong>of</strong> Zoning Services position.713-0100 1.00 140,600 12,700 6,800 (160,100) 0 0 0Total Planning & Building, Engineering, EnvironmentThe Manager <strong>of</strong> Permit Services will report to the Chief Building Official and will beresponsible for the management, supervision, guidance, and direction <strong>of</strong> all PermitServices Staff. This person will be responsible for the issuance <strong>of</strong> all Building Permitsin the <strong>City</strong> <strong>of</strong> <strong>Guelph</strong>, as well as monitoring the quality <strong>of</strong> permit review and thei i ll d t d b ildi it t d ti3.50 370,800 48,700 78,700 (469,800) 28,400 24,400 24,800Operations, Transit & Emergency ServicesMobility SupervisorThe provision <strong>of</strong> mobility services in the <strong>City</strong> <strong>of</strong> <strong>Guelph</strong> was subject to a detailedreview as part <strong>of</strong> the Transit Growth Strategy. The Transit Growth Strategyrecommended a number <strong>of</strong> changes to the existing model to improve service levelsand accommodate growing demand for mobility services in the future. One <strong>of</strong> therecommendations was the creation <strong>of</strong> the Mobility Supervisor position. The positionwould be responsible for the day to day operations <strong>of</strong> <strong>Guelph</strong> Transit’s MobilityServices area, assisting the Supervisor, Transit Operations with planning,efficiencies, statistical analysis, etc, thereby allowing the administration andtransportation functions to be consolidated and managed effectively.735-0100 1.00 84,500 500 3,200 0 88,200 86,100 87,800443
Appendix 2: <strong>City</strong> <strong>of</strong> <strong>Guelph</strong><strong>2013</strong> Tax Supported Operating <strong>Budget</strong>Growth RequestsSchool Crossing Guard Coordinator/Clerical SupportCrossing Guards and Spare Crossing GuardsFleet Asset Safety & Efficiency TrainerTechnical Assistant for Operations, Transit, andEmergency ServicesTotal Operations, Transit & Emergency ServicesThis position will work closely with the Supervisor <strong>of</strong> Traffic Investigations toadminister the adult school crossing guard program, train new employees, establishworking relationships with the school boards, develop educational materials for theschool crossing guard program, and be a backup when guards are not available. Inaddition, this position will lend much needed clerical support to the Traffic & ParkingDivision when not acting as the Co-ordinator.Six new crossing guards are required at five existing school crossings as part <strong>of</strong> theschool crossing guard program to improve safety for children attending <strong>City</strong> schools.Three additional spare guards are required as stand-by to ensure coverage whenregularly scheduled guards are unexpectedly unavailable. The practice <strong>of</strong> usingbylaw staff or other staff to address the unavailability <strong>of</strong> the school crossing guardhas increased, impacting other service levels in other areas and is not financiallysustainableThis position would address due diligence gaps in driver training and monitoring <strong>of</strong><strong>City</strong> drivers and equipment operators and provide continuous awareness <strong>of</strong> properfuel efficient driving techniques. This position would have a direct impact onensuring the <strong>City</strong> <strong>of</strong> <strong>Guelph</strong> meets the Ministry <strong>of</strong> Transportation CVOR standards forthe corporate fleet.This position will provide needed technical support to the Service Area by compilingtechnical information for Tenders; assisting with the researching, assessment andimplementation <strong>of</strong> industry best practices; and assisting with the investigation andprocessing <strong>of</strong> third party claims against the <strong>City</strong>. The position will also assist with themore timely handling <strong>of</strong> directions from Council and Committees <strong>of</strong> Council.720-3640 1.00 75,200 2,000 6,300 0 83,500 79,300 81,400720-3640 1.20 52,900 5,500 600 0 59,000 58,100 59,700720-0510 1.00 73,500 1,000 0 (66,000) 8,500 75,500 77,600720-2552 1.00 88,300 1,000 10,600 0 99,900 96,200 98,0005.20 374,400 10,000 20,700 (66,000) 339,100 395,200 404,500Corporate & Human ResourcesLegal Consulting FeesWater and Wastewater Communications Coordinator(Funded through the Enterprise <strong>Budget</strong>)Total Corporate & Human ResourcesFinance & EnterpriseAccounting ClerkTotal Finance & EnterpriseAn increase to the Legal consulting fees <strong>of</strong> $125,000 is to lessen the amount <strong>of</strong> thecontinued negative variances and to show real costs. This money is spent onexternal legal costs and, in the case <strong>of</strong> OMB files, planning consultants.Water Services and Wastewater Services are requesting a Water and WastewaterCommunications Coordinator FTE to more efficiently and best support ongoingdepartmental communications needs, including enhanced capacity for strategiccommunications, stakeholder engagement and issues management. The proposedexpansion poses no net financial impact (net zero) to the <strong>2013</strong> Enterprise <strong>Budget</strong>.Funding for the position is created through internal efficiencies stemming from priorfunding <strong>of</strong> a Communications Coordinator contract position (2012) and a decrease incurrent annual expenditures for external pr<strong>of</strong>essional communications servicesRecommend hiring a full time Accounting Clerk to provide segregation <strong>of</strong> duties,complete tasks that for the past year were done by a part time clerk, and to providecoverage during peak times <strong>of</strong> activity708-0100 - 0 125,000 0 0 125,000 125,000 125,000707-0199 1.00 79,000 3,300 3,500 (85,800) 0 0 01.00 79,000 128,300 3,500 (85,800) 125,000 125,000 125,000705-0200 1.00 58,700 0 0 (75,000) (16,300) (15,100) (13,900)1.00 58,700 0 0 (75,000) (16,300) (15,100) (13,900)Total Growth Requests 10.70 882,900 187,000 102,900 (696,600) 476,200 529,500 540,400444
Appendix 2: <strong>City</strong> <strong>of</strong> <strong>Guelph</strong><strong>2013</strong> Tax Supported Operating <strong>Budget</strong>New Service RequestsPosition NamePlanning & Building, Engineering, EnvironmentRisk Management Official(RMO) (Funded through theEnterprise <strong>Budget</strong>)Total Planning & Building, Engineering, EnvironmentDescriptionRequired under Part IV <strong>of</strong> the Ontario Clean Water Act, the<strong>City</strong> will assume responsibility for regulation <strong>of</strong> drinking waterthreats. The RMO will be responsible for ensuring adherenceto the legislative requirements outlined in Part IV <strong>of</strong> the Act.The role <strong>of</strong> this position includes negotiating or establishingrisk management plans, accepting risk assessments, issuingorders and notices and establishing rules, or policies.BusinessUnitFTE ImpactSalaries &BenefitsPurchasedGoods &ServicesOne-TimeCostsRevenue /ReducedExpenditures<strong>2013</strong> Total 2014 Total 2015 Total721-6218 1.00 140,200 57,100 14,000 (211,300) 0 0 01.00 140,200 57,100 14,000 (211,300) 0 0 0Operations, Transit & Emergency ServicesUrban Forest ManagementPlanThis expansion package is for the basic resources needed in<strong>2013</strong> to support the Urban Forestry Management Plan. It isproposed that 1.5 FTE's (<strong>of</strong> the original 4 requested in theCommittee report) be hired in <strong>2013</strong>. One, a Senior Foresterand the other a technical support position. The remainingpositions will be pursued in subsequent budget years.720-2326 1.50 176,500 67,100 16,400 0 260,000 474,500 483,300Total Operations, Transit & Emergency Services1.50 176,500 67,100 16,400 0 260,000 474,500 483,300Total New Service Requests 2.50 316,700 124,200 30,400 (211,300) 260,000 474,500 483,300445
Appendix 2: <strong>City</strong> <strong>of</strong> <strong>Guelph</strong><strong>2013</strong> Tax Supported Operating <strong>Budget</strong>Impact from Capital RequestsPosition NameCommunity & Social ServicesPart-time wages, benefits andmaterials for parkmaintenanceTotal Community & Social ServicesOperations, Transit & Emergency ServicesIncrease to ComputingServices ChargebackTotal Operations, Transit & Emergency ServicesCorporate & Human ResourcesIncrease to ComputingServices RecoveryTotal Corporate & Human ResourcesDescriptionCastlebury Park PK0003/Eastview Sports ParkPK0014/Wilson Farm Park GG 0219Wages, benefits and materials funding to maintain the newlydeveloped parkIn <strong>2013</strong> the computing services chargebacks to GWEMS haveincreased due to the addition <strong>of</strong> 20 computers to GWEMSinventoryIn <strong>2013</strong> the computing services recovery to ITS has increasedas a result <strong>of</strong> higher support department cost allocations toGWEMSBusinessUnitFTE ImpactSalaries &BenefitsPurchasedGoods &ServicesOne-TimeCostsRevenue /ReducedExpenditures<strong>2013</strong> Total 2014 Total 2015 TotalVarious 3.48 185,400 57,500 1,700 (49,000) 195,600 192,800 196,7003.48 185,400 57,500 1,700 (49,000) 195,600 192,800 196,700733-0100 - 0 134,300 0 0 134,300 0 0- 0 134,300 0 0 134,300 0 0704-0350 - 0 0 0 (134,300) (134,300) 0 0- 0 0 0 (134,300) (134,300) 0 0Local BoardsAddtional Police servicevehiclesTwo new motorcycles with the creation <strong>of</strong> the motorcycleunit, two additional vans in the tactical division and anadditional holdback vehicle in the neighbourhood division.There will be increased uniform, fuel, operating andmaintenance costs related to these vehicles.712-0210,712-0220,712-0270,712-0565,712-0580- 0 36,900 0 36,900 37,638 38,391Total Local Boards 0 0 36,900 0 0 36,900 37,638 38,391Total Impact from Capital Requests3.48 185,400 228,700 1,700 (183,300) 232,500 230,438 235,091446
Appendix 2: <strong>City</strong> <strong>of</strong> <strong>Guelph</strong><strong>2013</strong> Tax Supported Operating <strong>Budget</strong>CSP RequestsOffice <strong>of</strong> the CAOPosition NameDescriptionBusinessUnitFTE ImpactSalaries &BenefitsPurchasedGoods &ServicesOne-TimeCostsRevenue /ReducedExpenditures<strong>2013</strong> Total 2014 Total 2015 TotalInternal Audit Consulting Expand budget to fund external support and/or consulting for ongoing reviews/audits 703-0100 - 0 100,000 0 -100,000 0 200,000 200,000Senior Policy AdvisorTotal Office <strong>of</strong> the CAOPlanning & Building, Engineering, EnvironmentJoint Operational ReviewTotal Planning & Building, Engineering, EnvironmentCorporate & Human ResourcesCommunications and Issues Management CoordinatorOpen Government StrategyCorporate Applications AnalystCities are legislatively required to respond to policy, service and program decisionsdetermined by our provincial and federal government. The decisions <strong>of</strong>ten directlyimpact on the lives <strong>of</strong> residents and can have significant financial implications.Organizations such as the FCM, AMO and the Large Urban Mayors' Caucus <strong>of</strong> Ontario(LUMCO) are designed to interface with federal and provincial levels <strong>of</strong> government,assess policy changes and speak broadly for member cities and regions BUT notnecessarily for the interests <strong>of</strong> individual municipalities. To be successful, <strong>Guelph</strong>continues to leverage the work <strong>of</strong> these organizations but must also rely on its owncapacity to build and maintain its intergovernmental relationships, specific to its ownrequirements; to be 'at the table' to influence and advocate proactively ongovernment policy initiatives and program reviews; and to compete for partnershipopportunities with and/or receive provincial and federal funding for initiatives. Formany years, the <strong>City</strong> has acted with federal and provincial ministries and their agents,along with their respective administrations on an "ad hoc" or project basis. Anopportunity now exists to provide this service in a more coordinated and strategicmanner to delivery strong results. This position will support Council, CAO and ETthrough the provision <strong>of</strong> expert advice and guidance on provincial and federal policymatters. The position will deliver corporate policy support, critical analysis, advocacyapproaches and support the city bringing its positions forward to other levels <strong>of</strong>government and private partners. It will also ensure the enhancement <strong>of</strong> interagencyrelations and partnerships, supporting the Corporation to position the <strong>City</strong>well, for increased engagement, voice in issues, and exploration <strong>of</strong> alternative fundingoptions.Review aspects <strong>of</strong> the integration and orientation <strong>of</strong> new employees while providingmentorship and training in addition to the development <strong>of</strong> an overall CommunicationStrategy in the support <strong>of</strong> the Development Review Process.To increase the organization’s ability to effectively forecast potential issues, preventescalation and manage issues as they unfold, the Corporate Communicationsdepartment is requesting one full-time communications and issues managementcoordinator.Council approved the creation <strong>of</strong> an Innovation Pilot Project Team on OpenGovernment as a 2012 Strategic Initiative. In order to move this initiative forward, the<strong>City</strong> Clerk will be presenting an Open Government Framework to Council in the fourthquarter <strong>of</strong> 2012. The Framework will serve as a reference point for all future andrelated initiatives and will include a recommendation to strike an internal workinggroup to help guide the project. The working group will be led by the <strong>City</strong> Clerk butwill require the support <strong>of</strong> a subject matter expert to assist in developing acomprehensive strategy and implementation plan to provide clear direction in relationto project management, governance, timing, deliverables and resources. Supportfrom pr<strong>of</strong>essional consulting during this second phase <strong>of</strong> the project will ensure that itincludes practical goals and objectives which are fully sustainable. It will also ensurethat the project is well informed by experiences <strong>of</strong> other worldwide public sectororganizations who have implemented similar projects and strategies. It is estimatedthat the contract for a consultant to assist in the development <strong>of</strong> an OpenGovernment Strategy will be approximately $100,00 and will take a minimum <strong>of</strong> 3-4months to complete.These positions support the pillars <strong>of</strong> IT Sustainability and Service Delivery Standards.The strategy states “The current resource base within IT is under-resourced andunder-skilled in a number <strong>of</strong> critical areas, specifically related to the utilization andsupport <strong>of</strong> business systems. New resources need to be introduced that bring newskills into the organization, in business analysis, application support and projectmanagement.” “…these roles are critical to add both new capacity and the skill setsrequired to deliver the strategy and to sustain technology investments.”703-0000 1.00 111,700 0 8,300 120,000 115,100 118,6001.00 111,700 100,000 8,300 -100,000 120,000 315,100 318,600721-7100 - 0 75,000 0 0 75,000 75,000 75,000- 0 75,000 0 0 75,000 75,000 75,000707-0199 1.00 76,200 6,700 2,100 0 85,000 77,600 79,000704-0100 - 0 0 100,000 (100,000) 0 0 0704-0300 2.00 232,100 4,100 8,000 0 244,200 235,800 240,400447
Appendix 2: <strong>City</strong> <strong>of</strong> <strong>Guelph</strong><strong>2013</strong> Tax Supported Operating <strong>Budget</strong>CSP RequestsPosition NameDescriptionBusinessUnitFTE ImpactSalaries &BenefitsPurchasedGoods &ServicesOne-TimeCostsRevenue /ReducedExpenditures<strong>2013</strong> Total 2014 Total 2015 TotalBusiness AnalystIssues Management TrainingCivics Development TrainingCSP TrainingTotal Corporate & Human ResourcesFinance & EnterpriseFacility Optimization CoordinatorFacility Energy AuditingContinuous Facility CommissioningTotal Finance & EnterpriseThese positions support the pillars <strong>of</strong> IT Sustainability and Service Delivery Standards.The strategy states “The current resource base within IT is under-resourced andunder-skilled in a number <strong>of</strong> critical areas, specifically related to the utilization andsupport <strong>of</strong> business systems. New resources need to be introduced that bring newskills into the organization, in business analysis, application support and projectmanagement.” “…these roles are critical to add both new capacity and the skill setsrequired to deliver the strategy and to sustain technology investments.”To support the implementation <strong>of</strong> a corporate issues management framework alreadyunderway, the Corporate Communications department is requesting issuesmanagement training for <strong>City</strong> staff to reinforce the corporate framework and anyrelated policies, principles and guidelines. All employees have a role to play in issuesmanagement; identifying risks and taking actions to protect and enhance thereputation <strong>of</strong> the organization.The <strong>City</strong>’s Core Competencies will be updated to align with the new CorporateStrategic Plan. The Core Competencies identify knowledge and skill requirements fororganization-wide key capabilities for front line employees, lead hands, supervisors,manager/GMs and executive directors. The competency “Demonstratesorganizational awareness” has a knowledge component <strong>of</strong> “Understands the structure<strong>of</strong> the <strong>City</strong>’s local government including the role <strong>of</strong> Council and how your job fitswithin the overall structure.” The Civics Development Training will support thisknowledge component.The six core competencies describe knowledge and skill requirements across all levels<strong>of</strong> leadership. Once updated and aligned with the Corporate Strategic Plan a number<strong>of</strong> training courses will be required to support learning and competency development.It is anticipated that leadership development courses on topics such as creativeproblem solving, integrative thinking, and lean principles will be required.Optimizing building energy performance is a cornerstone <strong>of</strong> the Corporate EnergyManagement Program. The Coordinator function will work with maintenance staff andfacility managers in the monitoring, optimization, and trouble shooting <strong>of</strong> existing andplanned building automation systems. The Coordinator function is a critical supportrole to the Corporate Energy Management Program through their involvement intracking <strong>City</strong> facilities’ energy consumption with the utility energy managementaccounting s<strong>of</strong>tware. The Coordinator function will also be responsible for thecommissioning <strong>of</strong> mechanical and electrical systems in our new facilities andsupporting retro-commissioning <strong>of</strong> these systems in our existing buildings. Finally, theCoordinator function will also be the lead with respect to maintenance, installation,and set up <strong>of</strong> these building automation systemsThis task represents additional energy auditing beyond the 13 facility energy auditsconducted in 2012. This work will be conducted using an outside consultant inconjunction with a hired commissioning team. Estimated fee for this work is $75kWhile the work will be spearheaded using a hired commissioning team, continuouscommissioning requires the involvement <strong>of</strong> all stakeholders, including seniormanagement, engineering, O&M personnel, vendors and facility users/occupants.The commissioning process is not a one-time event, but rather an ongoing activitythat continues throughout the life-cycle <strong>of</strong> a facility. Estimated fee for this work is$50k per year704-0300 2.00 232,100 4,100 8,000 0 244,200 235,800 240,400707-0199 - 0 0 50,000 (50,000) 0 0 0706-0200 - 0 0 10,000 (10,000) 0 0 0706-0200 - 0 0 45,000 (45,000) 0 0 05.00 540,400 14,900 223,100 (205,000) 573,400 549,200 559,800707-0143 - 0 80,000 0 0 80,000 82,500 85,000707-0143 - 0 75,000 0 0 75,000 77,300 80,000707-0143 - 0 50,000 0 0 50,000 51,500 53,000- 0 205,000 0 0 205,000 211,300 218,000Total CSP Requests 6.00 652,100 319,900 231,400 (305,000) 973,400 1,075,600 1,096,400Note: $120,000 related to funding pr<strong>of</strong>essional services related to the public affairs portfolio has been included in the CAO Adminstration base budget.448
Appendix 2: <strong>City</strong> <strong>of</strong> <strong>Guelph</strong><strong>2013</strong> Enterprise <strong>Budget</strong>FTE Requests Court ServicesDept Position Name DescriptionThis expansion is to provide a Facility Maintainer to carry out cleaning and maintenance<strong>of</strong> the Provincial Offences Court facility. This expansion will reduce operating costs,provide more efficient and timely cleaning and maintenance services, reduce resourceCourt Facility Maintainerrequirements on other departments and serve to better manage liabilities and risksassociated with operating the facility.This expansion results in annual cost savings to the Court Services Department <strong>of</strong>approximately $40,000Total FTE Requests- Court ServicesPurchasedGoods &ServicesRevenue /ReducedExpenditures <strong>2013</strong> Total 2014 Total 2015 TotalBusinessSalaries &One-TimeUnit FTE Impact BenefitsCosts708-0200 1.00 79,700 1,700 5,500 (126,900) (40,000) (43,500) (41,900)1.00 79,700 1,700 5,500 (126,900) (40,000) (43,500) (41,900)449
Appendix 3: Equipment Replacement Reserve Fund Continuity SummaryFire Fire Dispatch Transit Police Waste Management Computer Play Operations Fleet Equipment TotalClosing Balance December 31, 2012 72,784 45,219 5,520 1,444,188 (22,776) 9,283 (1,572,394) (18,176)<strong>2013</strong>Transfers Out (2,311,800) (1,456,000) (1,457,700) (1,630,200) (1,418,700) (170,400) (4,027,210) (12,472,010)Debt Charges - PrincipalDebt Charges - InterestTransfers In 2,246,800 1,416,000 1,457,700 224,900 1,453,700 170,400 4,027,210 10,996,710Debt IssueInterest Earned 1,039 651 142 19,132 (136) 240 (40,568) (19,500)Closing Balance December 31, <strong>2013</strong> 8,823 5,870 5,663 58,020 12,088 9,522 (1,612,962) (1,512,976)2014Transfers Out (775,400) (1,902,300) (1,544,500) (982,700) (1,101,600) (238,700) (3,135,100) (9,680,300)Debt Charges - PrincipalDebt Charges - InterestTransfers In 775,400 1,902,300 1,544,500 982,700 1,101,600 238,700 3,595,100 10,140,300Debt IssueInterest Earned 228 151 146 1,497 312 246 (35,680) (33,101)Closing Balance December 31, 2014 9,051 6,021 5,809 59,517 12,400 9,768 (1,188,643) (1,086,077)2015Transfers Out (1,648,880) (1,800,000) (1,105,800) (850,000) (1,362,500) (447,000) (2,140,000) (9,354,180)Debt Charges - PrincipalDebt Charges - InterestTransfers In 1,648,880 1,800,000 1,105,800 850,000 1,362,500 447,000 2,600,000 9,814,180Debt IssueInterest Earned 234 155 150 1,536 320 252 (24,733) (22,087)Closing Balance December 31, 2015 9,284 6,176 5,959 61,053 12,720 10,020 (753,376) (648,163)2016Transfers Out (1,149,300) (1,950,000) (2,442,400) (700,000) (1,411,900) (408,200) (3,070,500) (11,132,300)Debt Charges - PrincipalDebt Charges - InterestTransfers In 1,149,300 1,950,000 2,442,400 700,000 1,411,900 408,200 3,530,500 11,592,300Debt IssueInterest Earned 240 159 154 1,575 328 259 (13,503) (10,789)Closing Balance December 31, 2016 9,524 6,336 6,113 62,628 13,048 10,279 (306,879) (198,952)2017Transfers Out (292,840) (2,208,100) (1,026,400) (800,000) (1,326,800) (376,000) (5,141,200) (11,171,340)Debt Charges - PrincipalDebt Charges - InterestTransfers In 292,840 2,208,100 1,026,400 800,000 1,326,800 376,000 5,601,200 11,631,340Debt IssueInterest Earned 246 163 158 1,616 337 265 (1,983) 801Closing Balance December 31, 2017 9,770 6,499 6,270 64,244 13,385 10,544 151,138 261,8492018Transfers Out (2,643,600) (2,821,400) (1,310,500) (816,000) (1,488,400) (457,100) (4,900,500) (14,437,500)Debt Charges - PrincipalDebt Charges - InterestTransfers In 2,643,600 600 2,821,400 1,310,500 816,000 1,488,400 400 457,100 5,360,500 500 14,897,500Debt IssueInterest Earned 252 168 162 1,657 345 272 9,833 12,690Closing Balance December 31, 2018 10,022 6,667 6,432 65,901 13,730 10,816 620,971 734,5392019Transfers Out (389,440) (2,675,600) (1,816,000) (1,323,000) (1,327,300) (413,000) (5,862,900) (13,807,240)Debt Charges - PrincipalDebt Charges - InterestTransfers In 389,440 2,675,600 1,816,000 1,323,000 1,327,300 413,000 6,322,900 14,267,240Debt IssueInterest Earned 259 172 166 1,700 354 279 21,955 24,885Closing Balance December 31, 2019 10,280 6,839 6,598 67,601 14,084 11,095 1,102,926 1,219,4242020Transfers Out (1,672,700) (2,280,800) (1,220,800) (801,000) (1,294,700) (354,200) (4,604,100) (12,228,300)Debt Charges - PrincipalDebt Charges - InterestTransfers In 1,672,700 2,280,800 1,220,800 801,000 1,294,700 354,200 5,064,100 12,688,300Debt IssueInterest Earned 265 176 170 1,744 363 286 34,390 37,395Closing Balance December 31, 2020 10,546 7,015 6,768 69,345 14,448 11,381 1,597,316 1,716,8192021Transfers Out (369,600) (3,083,000) (1,612,700) (1,290,000) (1,527,900) (285,300) (3,792,200) (11,960,700)Debt Charges - PrincipalDebt Charges - InterestTransfers In 369,600 3,083,000 1,612,700 1,290,000 1,527,900 285,300 4,252,200 12,420,700Debt IssueInterest Earned 272 181 175 1,789 373 294 47,145 50,228Closing Balance December 31, 2021 10,818 7,196 6,943 71,135 14,820 11,675 2,104,461 2,227,0472022Transfers Out (783,400) (2,672,000) (1,093,300) (1,000,000) (1,222,800) (644,700) (5,487,400) (12,903,600)Debt Charges - PrincipalDebt Charges - InterestTransfers In 783,400 2,672,000 1,093,300 1,000,000 1,222,800 644,700 5,947,400 13,363,600Debt IssueInterest Earned 279 186 179 1,835 382 301 60,229 63,392Closing Balance December 31, 2022 11,097 7,382 7,122 72,970 15,203 11,976 2,624,690 2,750,439450Page 1 <strong>of</strong> 8
Appendix 3: Departmental Capital Reserve Fund Continuity SummaryEconomicRecreation &DepartmentalCapital TotalParking Library Police Roads Stormwater Park Planning Policy Planning Development OperationsCulture Transit Fire Corporate Property Information Services Waste Management Closing Balance December 31, 2012 525,428 690,397 364,938 56,510 20,667 8,659 21,878 22,191 17,377 73,612 323,034 53,453 14,160 68,847 422,509 2,683,661<strong>2013</strong>Transfers Out (430,000) (95,000) (112,000) (811,000) (900,000) (115,000) (315,230) (1,082,800) (156,500) (544,150) (35,000) (903,500) (420,000) (5,920,180)Debt Charges - PrincipalDebt Charges - InterestTransfers In 95,000 112,000 776,000 885,000 115,000 295,230 1,072,800 156,500 229,625 837,500 4,574,655Debt IssueInterest Earned 8,009 17,812 9,415 1,006 340 223 306 573 319 1,899 4,277 928 365 925 5,483 51,881Closing Balance December 31, <strong>2013</strong> 103,437 708,209 374,354 22,517 6,007 8,882 2,184 22,764 7,696 75,512 12,786 19,381 14,526 3,772 7,992 1,390,0182014Transfers Out (950,000) (175,000) (130,600) (690,000) (750,000) (152,500) (378,210) (1,653,400) (20,000) (748,650) (807,900) (150,000) (6,606,260)Debt Charges - PrincipalDebt Charges - InterestTransfers In 848,000 175,000 130,600 690,000 750,000 152,500 378,210 1,653,400 20,000 748,650 807,900 150,000 6,504,260Debt IssueInterest Earned 1,353 18,272 9,658 581 155 229 56 587 199 1,988 330 500 375 97 206 34,586Closing Balance December 31, 2014 2,790 726,481 384,012 23,098 6,162 9,111 2,241 23,351 7,895 77,499 13,116 19,881 14,900 3,869 8,198 1,322,6042015Transfers Out (1,230,000) (131,000) (881,700) (365,000) (750,000) (250,000) (373,165) (1,493,100) (72,600) (415,580) (999,000) (6,961,145)Debt Charges - PrincipalDebt Charges - InterestTransfers In 1,230,000 131,000 881,700 365,000 750,000 250,000 373,165 1,493,100 72,600 415,580 999,000 6,961,145Debt IssueInterest Earned 72 18,743 9,908 596 159 235 58 602 204 2,078 338 513 384 100 212 34,202Closing Balance December 31, 2015 2,862 745,224 393,920 23,694 6,320 9,346 2,299 23,954 8,098 79,577 13,454 20,394 15,285 3,969 8,410 1,356,8062016Transfers Out (1,010,000) (250,000) (42,200) (1,605,000) (150,000) (660,000) (380,410) (1,296,670) (112,600) (181,930) (150,000) (5,838,810)Debt Charges - PrincipalDebt Charges - InterestTransfers In 1,010,000 250,000 42,200 1,605,000 150,000 660,000 380,410 1,296,670 112,600 181,930 150,000 5,838,810Debt IssueInterest Earned 74 19,227 10,163 611 163 241 59 618 209 2,171 347 526 394 102 217 35,124Closing Balance December 31, 2016 2,936 764,451 404,083 24,305 6,484 9,587 2,358 24,572 8,307 81,749 13,801 20,920 15,679 4,072 8,627 1,391,9292017Transfers Out (635,000) (150,000) (108,800) (390,000) (340,000) (1,555,000) (213,190) (1,701,020) (395,000) (244,380) (65,500) (980,000) (6,777,890)Debt Charges - PrincipalDebt Charges - InterestTransfers In 635,000 150,000 108,800 390,000 340,000 1,555,000 213,190 1,701,020 395,000 244,380 65,500 980,000 6,777,890Debt IssueInterest Earned 76 19,723 10,425 627 167 247 61 634 214 2,267 356 540 405 105 223 36,069Closing Balance December 31, 2017 3,012 784,174 414,508 24,932 6,651 9,835 2,419 25,206 8,522 84,016 14,157 21,460 16,084 4,177 8,849 1,427,9992018Transfers Out (245,000) (185,000) (43,000) (1,750,000) (300,000) (1,415,000) (1,333,980) (395,000) (43,630) (600,000) (6,310,610)Debt Charges - PrincipalDebt Charges - InterestTransfers In 245,000 185,000 43,000 1,750,000 300,000 1,415,000 1,333,980 395,000 43,630 600,000 6,310,610Debt IssueInterest Earned 78 20,232 10,694 643 172 254 62 650 220 2,365 365 554 415 108 228 37,039Closing Balance December 31, 2018 3,090 804,405 425,202 25,575 6,822 10,088 2,481 25,856 8,741 86,380 14,522 22,013 16,499 4,284 9,078 1,465,0382019Transfers Out (1,265,000) (43,400) (1,950,000) (1,350,000) (1,335,000) (170,795) (1,948,750) (576,500) (119,340) (2,200,000) (10,958,785)Debt Charges - PrincipalDebt Charges - InterestTransfers In 1,265,000 43,400 1,950,000 1,350,000 1,335,000 170,795 1,948,750 576,500 119,340 2,200,000 10,958,785Debt IssueInterest Earned 80 20,754 10,970 660 176 260 64 667 226 2,465 375 568 426 111 234 38,034Closing Balance December 31, 2019 3,169 825,159 436,173 26,235 6,998 10,349 2,545 26,523 8,967 88,845 14,897 22,581 16,924 4,395 9,312 1,503,0732020Transfers Out (460,000) (435,000) (112,000) (2,609,000) (750,000) (1,995,000) (211,075) (2,283,650) (570,000) (122,515) (80,000) (65,500) (3,225,000) (12,918,740)Debt Charges - PrincipalDebt Charges - InterestTransfers In 460,000 435,000 112,000 2,609,000 750,000 1,995,000 211,075 2,283,650 570,000 122,515 80,000 65,500 3,225,000 12,918,740Debt IssueInterest Earned 82 21,289 11,253 677 181 267 66 684 231 2,568 384 583 437 113 240 39,055Closing Balance December 31, 2020 3,251 846,448 447,426 26,912 7,179 10,616 2,611 27,207 9,198 91,413 15,281 23,164 17,361 4,508 9,552 1,542,1282021Transfers Out (1,135,000) (44,200) (3,570,000) (600,000) (1,560,000) (149,495) (3,230,260) (591,000) (110,920) (2,500,000) (13,490,875)Debt Charges - PrincipalDebt Charges - InterestTransfers In 1,135,000 44,200 3,570,000 600,000 1,560,000 149,495 3,230,260 591,000 110,920 2,500,000 13,490,875Debt IssueInterest Earned 84 21,838 11,544 694 185 274 67 702 237 2,674 394 598 448 116 246 40,102Closing Balance December 31, 2021 3,335 868,286 458,969 27,606 7,364 10,890 2,678 27,909 9,436 94,087 15,676 23,761 17,809 4,625 9,799 1,582,2302022Transfers Out (800,000) (90,000) (44,600) (5,900,000) (2,475,000) (1,090,000) (2,777,900) (380,000) (83,880) (75,000) (13,716,380)Debt Charges - PrincipalDebt Charges - InterestTransfers In 800,000 90,000 44,600 5,900,000 2,475,000 1,090,000 2,777,900 380,000 83,880 75,000 13,716,380Debt IssueInterest Earned 86 22,402 11,841 712 190 281 69 720 243 2,782 404 613 459 119 253 41,176Closing Balance December 31, 2022 3,421 890,688 470,811 28,319 7,554 11,170 2,747 28,629 9,679 96,869 16,080 24,374 18,268 4,744 10,051 1,623,406451Page 5 <strong>of</strong> 8
Appendix 3: <strong>City</strong> Strategies Reserve Fund Continuity SummaryCapital Taxation DC Exemptions Accessibility Capital Road Infrastructure Building Life CycleAsset Renewal(Hydro Note)Strategy TotalClosing Balance December 31, 2012 3,854,964 970,583 258,523 163,817 518,513 14,456,365 20,222,764<strong>2013</strong>Transfers Out (13,000) (1,169,220) (142,000) (1,445,000) (2,960,000) (1,872,700) (7,601,920)Debt Charges - PrincipalDebt Charges - InterestTransfers In 1,971,671 2,000,000 1,295,000 2,560,000 7,826,671Debt IssueInterest Earned 124,725 35,758 4,838 2,291 8,218 348,816 524,647Closing Balance December 31, <strong>2013</strong> 5,938,360 1,837,121 121,361 16,108 126,731 12,932,481 20,972,1612014Transfers Out (799,525) (200,000) (3,105,500) (2,037,000) (1,639,900) (7,781,925)Debt Charges - PrincipalDebt Charges - InterestTransfers In 1,096,634 1,500,000 200,000 3,105,500 2,037,000 95,000 8,034,134Debt IssueInterest Earned 167,356 56,434 3,131 416 3,270 313,729 544,335Closing Balance December 31, 2014 7,202,350 2,594,030 124,492 16,524 130,000 11,701,310 21,768,7052015Transfers Out (517,015) (150,000) (1,840,500) (1,791,000) (759,800) (5,058,315)Debt Charges - PrincipalDebt Charges - InterestTransfers In 1,439,811 1,500,000 150,000 1,840,500 1,791,000 95,000 6,816,311Debt IssueInterest Earned 204,394 79,606 3,212 426 3,354 293,318 584,311Closing Balance December 31, 2015 8,846,555 3,656,621 127,704 16,950 133,354 11,329,828 24,111,0122016Transfers Out (929,620) (200,000) (1,977,150) (2,526,500) (849,800) (6,483,070)Debt Charges - PrincipalDebt Charges - InterestTransfers In 2,496,517 1,500,000 200,000 1,977,150 2,526,500 95,000 8,795,167Debt IssueInterest Earned 260,446 101,699 3,295 437 3,441 282,573 651,890Closing Balance December 31, 2016 11,603,518 4,328,700 130,998 17,387 136,795 10,857,601 27,074,9992017Transfers Out (769,580) (200,000) (2,365,190) (3,077,900) (776,900) (7,189,570)Debt Charges - PrincipalDebt Charges - InterestTransfers In 3,062,664 1,500,000 200,000 2,365,190 3,077,900 95,000 10,300,754Debt IssueInterest Earned 338,879 121,103 3,380 449 3,529 271,330 738,669Closing Balance December 31, 2017 15,005,062 062 5,180,223 134,378378 17,836 140,324 10,447,030 030 30,924,8532018Transfers Out (14,000) (436,870) (200,000) (2,428,200) (2,873,000) (888,000) (6,840,070)Debt Charges - PrincipalDebt Charges - InterestTransfers In 2,620,762 1,500,000 200,000 2,428,200 2,873,000 95,000 9,716,962Debt IssueInterest Earned 420,758 147,364 3,467 460 3,620 259,304 834,973Closing Balance December 31, 2018 18,032,581 6,390,717 137,845 18,296 143,944 9,913,334 34,636,7172019Transfers Out (508,020) (200,000) (2,940,700) (2,217,500) (888,000) (6,754,220)Debt Charges - PrincipalDebt Charges - InterestTransfers In 2,316,350 1,500,000 200,000 2,940,700 2,217,500 95,000 9,269,550Debt IssueInterest Earned 495,122 177,677 3,556 472 3,714 245,534 926,075Closing Balance December 31, 2019 20,844,053 7,560,374 141,402 18,768 147,658 9,365,868 38,078,1222020Transfers Out (670,660) (200,000) (1,700,000) (1,942,500) (888,000) (5,401,160)Debt Charges - PrincipalDebt Charges - InterestTransfers In 6,646,462 1,500,000 200,000 1,700,000 1,942,500 95,000 12,083,962Debt IssueInterest Earned 623,516 205,756 3,648 484 3,810 231,410 1,068,624Closing Balance December 31, 2020 28,114,030 8,595,470 145,050 19,252 151,468 8,804,278 45,829,5482021Transfers Out (661,920) (200,000) (2,268,200) (1,065,000) (888,000) (5,083,120)Debt Charges - PrincipalDebt Charges - InterestTransfers In 9,376,448 1,500,000 200,000 2,268,200 1,065,000 95,000 14,504,648Debt IssueInterest Earned 846,298 232,574 3,742 497 3,908 216,921 1,303,940Closing Balance December 31, 2021 38,336,777 9,666,124 148,792 19,749 155,376 8,228,199 56,555,0162022Transfers Out (661,480) (200,000) (3,000,000) (917,500) (888,000) (5,666,980)Debt Charges - PrincipalDebt Charges - InterestTransfers In 15,143,597 1,500,000 200,000 3,000,000 917,500 95,000 20,856,097Debt IssueInterest Earned 1,184,441 260,203 3,839 510 4,009 202,058 1,655,059Closing Balance December 31, 2022 54,664,815 10,764,847 152,631 20,258 159,384 7,637,257 73,399,192452Page 2 <strong>of</strong> 8
Appendix 3: Miscellaneous Discretionary Reserve Fund Continuity SummaryMcCrae Moon-Sleeman Centre Tree<strong>City</strong>TransportationHouse MacKiegan Library Landfill Public Transit Naming Rights and Donation Sleeman Infrastructure Investing inRoad Industrial River Run Locomotive Demand GreenhouseBrownfield MiscellaneousDevelopment Artifacts Bequests Compensation Improvement Sponsorship Capital Program Centre Stimulus Ontario <strong>City</strong> RInC Widening Land Centre Capital 6167 ManagementGas Greening Public Art Capital (IMICO) Discretionary TotalClosing Balance December 31, 2012 137,541 13,836 178,798 67,191 (5,309) 2,776 51 36,895 2,512,321 675,411 15,726 979,080 617,726 122,766 563 21,414 240,864 57,800 207,807 14,293 5,956,937<strong>2013</strong>Transfers Out (91,415) (651,300) (600,000) (58,000) (100,000) (25,000) (200,000) (50,000) (1,775,715)Debt Charges - PrincipalDebt Charges - InterestTransfers In 90,000 75,000 147,000 50,000 362,000Debt IssueInterest Earned 3,549 357 4,613 1,734 (137) 53 1 952 64,818 9,024 406 25,260 8,197 3,387 15 552 6,821 1,169 2,781 369 135,452Closing Balance December 31, <strong>2013</strong> 141,090 14,193 183,411 68,924 (5,446) 1,414 52 37,847 2,577,138 33,135 16,132 1,004,341 25,924 143,152 578 21,967 294,684 33,969 10,588 14,662 4,678,6742014Transfers Out (30,000) (91,415) (30,000) (75,000) (25,000) (100,000) (351,415)Debt Charges - PrincipalDebt Charges - InterestTransfers In 90,000 75,000 100,000 4,369,6484,006,648 98,000 Debt IssueInterest Earned 3,253 366 4,732 1,778 (140) 18 1 589 66,490 855 416 25,912 52,355 3,693 15 567 8,867 554 273 378 172,545Closing Balance December 31, 2014 114,343 14,559 188,143 70,702 (5,586) 17 53 8,437 2,643,629 33,989 16,548 1,030,253 4,084,926 146,846 593 22,533 401,551 9,523 10,861 15,040 8,869,4512015Transfers Out (82,265) (7,300,000) (165,000) (450,000) (25,000) (8,022,265)Debt Charges - PrincipalDebt Charges - InterestTransfers In 90,000 4,826,737 75,000 122,500 25,000 5,139,237Debt IssueInterest Earned 2,950 376 4,854 1,824 (144) 100 1 218 68,206 877 427 26,581 73,486 2,628 15 581 6,135 246 280 388 191,641Closing Balance December 31, 2015 117,293 14,935 192,998 72,527 (5,730) 7,853 55 8,654 2,711,834 34,866 16,975 1,056,833 1,685,149 59,473 608 23,115 80,186 9,768 11,141 15,428 6,178,0642016Transfers Out (82,264) (4,722,036) (105,000) (100,000) (25,000) (50,000) (5,084,300)Debt Charges - PrincipalDebt Charges - InterestTransfers In 90,000 4,006,648 75,000 122,500 25,000 50,000 4,369,148Debt IssueInterest Earned 3,026 385 4,979 1,871 (148) 302 1 223 69,965 900 438 27,266 34,248 1,147 16 596 2,359 252 287 398 150,169Closing Balance December 31, 2016 120,319 15,320 197,977 74,398 (5,878) 15,891 56 8,877 2,781,800 35,766 17,413 1,084,099 1,004,010 30,621 624 23,711 105,045 10,020 11,429 15,826 5,613,0812017Transfers Out (93,156) (5,000,000) (25,000) (30,000) (75,000) (5,223,156)Debt Charges - PrincipalDebt Charges - InterestTransfers In 90,000 4,006,648 75,000 30,000 75,000 4,276,648Debt IssueInterest Earned 3,104 395 5,108 1,919 (152) 369 1 229 71,770 923 449 27,970 13,089 1,435 16 612 2,710 259 295 408 132,608Closing Balance December 31, 2017 123,423 15,715 203,085 76,317 (6,030) 13,104 58 9,107 2,853,570 36,689 17,862 1,112,069 23,747 82,056 640 24,323 107,756 10,279 11,724 16,234 4,799,1802018Transfers Out (93,155) (2,513,806) (30,000) (75,000) (2,711,961)Debt Charges - PrincipalDebt Charges - InterestTransfers In 90,000 4,006,648 75,000 30,000 75,000 4,276,648Debt IssueInterest Earned 3,184 405 5,240 1,969 (156) 297 1 235 73,622 947 461 28,691 19,870 3,085 17 628 2,780 265 302 419 144,003Closing Balance December 31, 2018 126,607 16,121 208,324 78,286 (6,185) 10,246 59 9,341 2,927,192 37,635 18,323 1,140,761 1,536,459 160,140 656 24,950 110,536 10,544 12,026 16,653 6,507,8702019Transfers Out (94,092) (9,328,076) (30,000) (100,000) (9,552,168)Debt Charges - PrincipalDebt Charges - InterestTransfers In 90,000 13,330,642 75,000 30,000 100,000 13,625,642Debt IssueInterest Earned 3,266 416 5,375 2,020 (160) 212 2 241 75,522 971 473 29,432 91,274 5,099 17 644 2,852 272 310 430 220,451Closing Balance December 31, 2019 129,874 16,537 213,699 80,306 (6,345) 6,365 61 9,582 3,002,714 38,606 18,795 1,170,192 5,630,299 240,239 673 25,594 113,388 10,816 12,336 17,083 10,801,7942020Transfers Out (34,091) (6,611,941) (75,000) (30,000) (100,000) (6,851,032)Debt Charges - PrincipalDebt Charges - InterestTransfers In 90,000 11,816,976 75,000 30,000 100,000 12,111,976Debt IssueInterest Earned 3,351 427 5,513 2,072 (164) 885 2 247 77,470 996 485 30,191 212,407 6,198 17 660 2,925 279 318 441 346,552Closing Balance December 31, 2020 133,225 16,963 219,212 82,378 (6,508) 63,159 62 9,830 3,080,184 39,602 19,280 1,200,383 11,047,741 246,438 691 26,254 116,313 11,095 12,655 17,524 16,409,2912021Transfers Out (34,090) (35,000) (100,000) (169,090)Debt Charges - PrincipalDebt Charges - InterestTransfers In 90,000 75,000 30,000 100,000 295,000Debt IssueInterest Earned 3,437 438 5,656 2,125 (168) 2,351 2 254 79,469 1,022 497 30,970 285,032 7,326 18 677 3,001 222 326 452 424,984Closing Balance December 31, 2021 136,662 17,401 224,868 84,503 (6,676) 121,420 64 10,083 3,159,652 40,624 19,778 1,231,353 11,332,772 328,763 708 26,932 119,314 6,317 12,981 17,976 16,960,1842022Transfers Out (34,090) (40,000) (400,000) (474,090)Debt Charges - PrincipalDebt Charges - InterestTransfers In 90,000 75,000 30,000 400,000 595,000Debt IssueInterest Earned 3,526 449 5,802 2,180 (172) 3,854 2 260 81,519 1,048 510 31,769 292,386 9,450 18 695 3,078 34 335 464 439,133Closing Balance December 31, 2022 140,188 17,850 230,670 86,683 (6,849) 181,184 65 10,343 3,241,171 41,672 20,288 1,263,122 11,625,158 413,213 727 27,627 122,392 (3,649) 13,316 18,440 17,520,227Page 1 <strong>of</strong> 1453
Appendix 3: Miscellaneous Obligatory Reserve Fund Continuity Summary(Projected Balances)ParklandDedicationDedicatedProvincial Gas TaxFederal Gas TaxTransitInfrastructureOntario BusReplacementInfrastructureStimulusRInC GrantMiscellaneousObligatory TotalClosing Balance Dec 31, 2012 874,909 699,117 2,263,127 15,396 54,014 (1,432,462) (638,339) 1,835,761<strong>2013</strong>Transfers Out (3,294,410) (6,839,650) (13,000) (50,000) (10,197,060)Debt Charges - PrincipalDebt Charges - InterestTransfers In 75,900 2,829,161 7,051,293 9,956,354Debt IssueInterest Earned 23,552 12,036 61,119 230 749 (36,958) (16,469) 44,258Closing Balance Dec 31, <strong>2013</strong> 974,361 245,903 2,535,889 2,625 4,763 (1,469,420) (654,808) 1,639,3132014Transfers Out (3,018,810) (6,280,000) (9,298,810)Debt Charges - PrincipalDebt Charges - InterestTransfers In 75,900 2,829,161 7,051,293 9,956,354Debt IssueInterest Earned 26,118 3,898 75,376 68 123 (37,911) (16,894) 50,777Closing Balance Dec 31, 2014 1,076,378 60,152 3,382,558 2,693 4,886 (1,507,331) (671,702) 2,347,6342015Transfers Out (2,813,810) (4,393,000) (7,206,810)Debt Charges - PrincipalDebt Charges - InterestTransfers In 75,900 2,829,161 7,051,293 9,956,354Debt IssueInterest Earned 28,750 1,750 121,562 69 126 (38,889) (17,330) 96,038Closing Balance Dec 31, 2015 1,181,028 77,253 6,162,413 2,762 5,012 (1,546,220) (689,032) 5,193,2162016Transfers Out (2,813,810) (7,040,000) (9,853,810)Debt Charges - PrincipalDebt Charges - InterestTransfers In 75,900 2,829,161 7,051,293 9,956,354Debt IssueInterest Earned 31,450 2,191 159,136 71 129 (39,892) (17,777) 135,308Closing Balance Dec 31, 2016 1,288,378 94,795 6,332,843 2,834 5,141 (1,586,112) (706,809) 5,431,0692017Transfers Out (2,813,810) (8,360,000) (11,173,810)Debt Charges - PrincipalDebt Charges - InterestTransfers In 75,900 2,829,161 7,051,293 9,956,354Debt IssueInterest Earned 34,219 2,644 146,505 73 133 (40,922) (18,236) 124,416Closing Balance Dec 31, 2017 1,398,497 112,790 5,170,641 2,907 5,274 (1,627,034) (725,045) 4,338,0292018Transfers Out (2,813,810) (6,812,800) (9,626,610)Debt Charges - PrincipalDebt Charges - InterestTransfers In 75,900 2,829,161 7,051,293 9,956,354Debt IssueInterest Earned 37,060 3,108 136,479 75 136 (41,977) (18,706) 116,175Closing Balance Dec 31, 2018 1,511,457 131,249 5,545,613 2,982 5,410 (1,669,012) (743,751) 4,783,9492019Transfers Out (2,813,810) (6,940,300) (9,754,110)Debt Charges - PrincipalDebt Charges - InterestTransfers In 75,900 2,829,161 7,051,293 9,956,354Debt IssueInterest Earned 39,975 3,584 144,509 77 140 (43,061) (19,189) 126,035Closing Balance Dec 31, 2019 1,627,332 150,184 5,801,115 3,059 5,549 (1,712,072) (762,940) 5,112,2282020Transfers Out (2,813,810) (6,310,000) (9,123,810)Debt Charges - PrincipalDebt Charges - InterestTransfers In 75,900 2,829,161 7,051,293 9,956,354Debt IssueInterest Earned 42,964 4,073 159,231 79 143 (44,171) (19,684) 142,635Closing Balance Dec 31, 2020 1,746,196 169,608 6,701,640 3,137 5,692 (1,756,244) (782,623) 6,087,4072021Transfers Out (2,813,810) (6,322,800) (9,136,610)Debt Charges - PrincipalDebt Charges - InterestTransfers In 75,900 2,829,161 7,051,293 9,956,354Debt IssueInterest Earned 46,031 4,574 182,300 81 147 (45,311) (20,192) 167,630Closing Balance Dec 31, 2021 1,868,127 189,533 7,612,433 3,218 5,839 (1,801,555) (802,815) 7,074,7822022Transfers Out (2,813,810) (9,300,000) (12,113,810)Debt Charges - PrincipalDebt Charges - InterestTransfers In 75,900 2,829,161 7,051,293 9,956,354Debt IssueInterest Earned 49,177 5,088 167,392 83 151 (46,480) (20,713) 154,698Closing Balance Dec 31, 2022 1,993,204 209,972 5,531,119 3,301 5,990 (1,848,035) (823,528) 5,072,024454Page 6 <strong>of</strong> 8
Appendix 3: 24 Year Services Development Charge Reserve Fund Continuity Summary(Projected Balances)Water Services- Wastewater Services -DRAFTDRAFT Stormwater RoadsFire ProtectionServicesPolice Services24 Year Services DCTotalClosing Balance Dec 31, 2012 3,137,103 (3,198,140) (1,325,362) (3,534,737) (1,342,429) (877,690) (7,141,254)<strong>2013</strong>Transfers Out (2,790,000) (3,868,150) (206,250) (2,596,500) (9,460,900)Debt Charges - Principal (601,220) (552,568) (176,378) (89,767) (288,199) (1,708,131)Debt Charges - Interest (180,168) (165,588) (52,855) (26,900) (86,365) (511,876)Transfers In 7,189,355 5,993,136 158,196 2,651,589 219,528 226,042 16,437,846Debt IssueInterest Earned 127,609 (64,364) (34,814) (93,443) (33,308) (24,560) (122,880)Closing Balance Dec 31, <strong>2013</strong> 6,882,679 (1,855,674) (1,408,231) (3,802,324) (1,272,875) (1,050,772) (2,507,196)2014Transfers Out (7,151,900) (3,768,200) (135,000) (5,251,050) (16,306,150)Debt Charges - Principal (626,804) (576,082) (183,883) (93,587) (300,462) (1,780,818)Debt Charges - Interest (162,432) (149,288) (385,152) (24,252) (77,863) (798,986)Transfers In 7,405,036 6,172,930 162,942 2,731,136 226,114 232,823 16,930,981Debt IssueInterest Earned 170,657 (26,213) (35,972) (137,947) (31,443) (28,987) (89,905)Closing Balance Dec 31, 2014 6,517,236 (202,526) (1,416,261) (7,029,220) (1,196,044) (1,225,261) (4,552,074)2015Transfers Out (10,472,400) (11,906,100) (315,000) (2,302,350) (24,995,850)Debt Charges - Principal (639,596) (587,839) (595,911) (95,497) (306,594) (2,225,436)Debt Charges - Interest (141,747) (130,277) (706,377) (21,164) (67,947) (1,067,512)Transfers In 7,399,803 6,168,585 162,828 2,729,221 225,901 232,839 16,919,177Debt IssueInterest Earned 118,429 (88,503) (38,503) (192,647) (29,449) (33,440) (264,112)Closing Balance Dec 31, 2015 2,781,725 (6,746,659) (1,606,935) (8,097,283) (1,116,252) (1,400,403) (16,185,807)2016Transfers Out (14,211,000) (11,741,550) (135,000) (3,680,900) (29,768,450)Debt Charges - Principal (652,388) (599,595) (620,077) (97,407) (312,726) (2,282,193)Debt Charges - Interest (118,402) (108,821) (678,604) (17,678) (56,757) (980,262)Transfers In 7,621,797 6,353,643 167,713 2,811,097 232,678 239,824 17,426,752Debt IssueInterest Earned (23,175) (252,706) (41,037) (236,883) (27,282) (37,803) (618,887)Closing Balance Dec 31, 2016 (4,601,442) (13,095,688) (1,615,259) (10,502,651) (1,025,942) (1,567,865) (32,408,847)2017Transfers Out (7,841,500) (4,535,100) (207,000) (3,359,420) (15,943,020)Debt Charges - Principal (677,972) (623,109) (649,017) (101,226) (324,990) (2,376,314)Debt Charges - Interest (92,633) (85,137) (649,064) (13,831) (44,404) (885,068)Transfers In 7,850,451 6,544,252 172,745 2,895,430 239,658 247,019 17,949,555Debt IssueInterest Earned (128,543) (321,087) (42,116) (293,699) (24,862) (42,030) (852,336)Closing Balance Dec 31, 2017 (5,491,638) (12,115,869) (1,691,630) (12,558,421) (926,203) (1,732,269) (34,516,030)2018Transfers Out (3,609,900) (3,231,600) (135,000) (1,362,870) (8,339,370)Debt Charges - Principal (703,555) (646,623) (679,028) (105,046) (337,254) (2,471,506)Debt Charges - Interest (64,497) (59,278) (617,751) (9,630) (30,917) (782,073)Transfers In 8,085,965 6,740,580 177,927 2,982,293 246,848 254,430 18,488,042Debt IssueInterest Earned (93,851) (276,430) (43,090) (319,845) (22,191) (46,160) (801,567)Closing Balance Dec 31, 2018 (1,877,476) (9,589,219) (1,691,793) (12,555,623) (816,222) (1,892,170) (28,422,504)2019Transfers Out (7,943,900) (9,530,950) (135,000) (737,730) (18,347,580)Debt Charges - Principal (729,139) (670,136) (710,166) (108,866) (349,517) (2,567,825)Debt Charges - Interest (33,540) (30,826) (584,448) (5,008) (16,078) (669,900)Transfers In 8,328,544 6,942,797 183,265 3,071,762 254,253 262,062 19,042,683Debt IssueInterest Earned (53,316) (289,831) (43,026) (310,527) (19,248) (50,154) (766,100)Closing Balance Dec 31, 2019 (2,308,828) (13,168,166) (1,686,554) (11,826,731) (695,091) (2,045,857) (31,731,227)2020Transfers Out (8,854,200) (24,321,800) (135,000) (3,435,300) (36,746,300)Debt Charges - Principal (521,074) (521,074)Debt Charges - Interest (549,174) (549,174)Transfers In 8,492,621 7,079,581 186,876 3,132,283 259,241 267,295 19,417,897Debt IssueInterest Earned (64,232) (562,163) (42,844) (322,845) (14,589) (49,335) (1,056,008)Closing Balance Dec 31, 2020 (2,734,639) (30,972,549) (1,677,522) (13,522,841) (450,439) (1,827,896) (51,185,886)2021Transfers Out (8,606,700) (21,533,700) (135,000) (1,816,070) (32,091,470)Debt Charges - Principal (547,128) (547,128)Debt Charges - Interest (522,469) (522,469)Transfers In 8,747,400 7,291,968 192,482 3,226,251 267,018 275,314 20,000,434Debt IssueInterest Earned (68,739) (982,810) (42,539) (344,496) (8,177) (43,608) (1,490,368)Closing Balance Dec 31, 2021 (2,662,678) (46,197,090) (1,662,579) (13,526,752) (191,597) (1,596,190) (65,836,887)2022Transfers Out (3,067,200) (2,392,800) (135,000) (1,654,740) (7,249,740)Debt Charges - Principal (574,484) (574,484)Debt Charges - Interest (496,453) (496,453)Transfers In 9,009,822 7,291,968 198,256 3,226,251 275,029 283,574 20,284,901Debt IssueInterest Earned 7,963 (1,128,686) (42,079) (342,533) (1,395) (37,524) (1,544,253)Closing Balance Dec 31, 2022 3,287,907 (42,426,608) (1,641,401) (13,368,711) 82,037 (1,350,140) (55,416,916)455Page 7 <strong>of</strong> 8
Appendix 3: 10 Year Services Development Charge Reserve Fund Continuity Summary(Projected Balances)Library Services Transit Administration Recreation Parks ParkingAmbulanceServicesMunicipal CourtFacility Space10 Year ServicesDC TotalClosing Balance Dec 31, 2012 416,850 (1,193,867) 746,644 6,035,469 1,461,143 1,599,718 (1,276,942) 43,779 7,832,794<strong>2013</strong>Transfers Out (484,200) (415,665) (342,355) (367,650) (1,150,380) (1,220,400) (3,980,650)Debt Charges - PrincipalDebt Charges - InterestTransfers In 240,340 536,283 168,461 1,003,262 1,263,209 495,168 15,020 12,512 3,734,255Debt IssueInterest Earned 7,609 (29,246) 17,020 163,914 39,153 31,917 (32,751) 1,291 198,908Closing Balance Dec 31, <strong>2013</strong> 180,599 (1,102,495) 589,770 6,834,995 1,613,125 906,403 (1,294,673) 57,582 7,785,3072014Transfers Out (183,200) (274,995) (350,580) (1,301,490) (461,800) (2,572,065)Debt Charges - PrincipalDebt Charges - InterestTransfers In 247,550 552,372 173,514 1,033,360 1,301,106 510,023 15,470 12,888 3,846,283Debt IssueInterest Earned 5,490 (24,866) 12,932 189,673 41,614 24,007 (33,203) 1,652 217,298Closing Balance Dec 31, 2014 250,439 (849,984) 425,636 8,058,028 1,654,355 978,634 (1,312,406) 72,122 9,276,8232015Transfers Out (170,395) (286,225) (223,560) (1,280,610) (1,960,790)Debt Charges - PrincipalDebt Charges - InterestTransfers In 243,709 551,999 173,325 1,017,434 1,281,045 509,672 15,457 12,881 3,805,521Debt IssueInterest Earned 9,605 (17,007) 9,525 218,138 42,688 31,824 (33,661) 2,027 263,139Closing Balance Dec 31, 2015 503,753 (485,388) 322,261 9,070,040 1,697,478 1,520,129 (1,330,610) 87,030 11,384,6932016Transfers Out (901,950) (241,560) (223,560) (1,517,700) (2,884,770)Debt Charges - PrincipalDebt Charges - InterestTransfers In 251,020 568,559 178,524 1,047,957 1,319,476 524,962 15,921 13,267 3,919,686Debt IssueInterest Earned 16,235 (16,824) 7,501 244,642 41,238 45,991 (34,124) 2,417 307,076Closing Balance Dec 31, 2016 771,008 (835,603) 266,727 10,139,079 1,540,492 2,091,083 (1,348,813) 102,713 12,726,6852017Transfers Out (1,025,030) (308,800) (2,025,970) (3,359,800)Debt Charges - PrincipalDebt Charges - InterestTransfers In 258,551 585,615 183,880 1,079,396 1,359,061 540,711 16,398 13,665 4,037,277Debt IssueInterest t Earned 23,227227 (27,227) 227) 5,270 275,512512 31,142142 60,925 (34,588) 2826 2,826 337,088Closing Balance Dec 31, 2017 1,052,785 (1,302,244) 147,077 11,493,987 904,724 2,692,719 (1,367,003) 119,205 13,741,2502018Transfers Out (11,400) (113,400) (2,309,150) (2,433,950)Debt Charges - PrincipalDebt Charges - InterestTransfers In 266,307 603,184 189,397 1,111,778 1,399,832 556,932 16,890 14,075 4,158,395Debt IssueInterest Earned 30,597 (25,964) 4,775 310,887 11,612 76,657 (35,051) 3,257 376,770Closing Balance Dec 31, 2018 1,349,690 (736,424) 227,848 12,916,652 7,018 3,326,308 (1,385,164) 136,537 15,842,4652019Transfers Out (182,395) (135,725) (222,750) (3,158,595) (3,699,465)Debt Charges - PrincipalDebt Charges - InterestTransfers In 274,296 621,279 195,078 1,145,131 1,441,827 573,640 17,397 14,498 4,283,147Debt IssueInterest Earned 38,360 (13,338) 6,644 345,148 (21,965) 93,219 (35,513) 3,710 416,265Closing Balance Dec 31, 2019 1,662,346 (310,878) 293,846 14,184,181 (1,731,714) 3,993,167 (1,403,280) 154,744 16,842,4132020Transfers Out (190,065) (214,490) (2,061,045) (2,465,600)Debt Charges - PrincipalDebt Charges - InterestTransfers In 278,274 633,526 198,896 1,161,782 1,462,790 584,945 17,739 14,784 4,352,735Debt IssueInterest Earned 46,478 (2,300) 7,380 380,939 (52,396) 110,569 (35,976) 4,183 458,878Closing Balance Dec 31, 2020 1,987,099 130,283 285,632 15,726,902 (2,382,366) 4,688,681 (1,421,517) 173,711 19,188,4262021Transfers Out (19,600) (209,435) (5,177,200) (5,406,235)Debt Charges - PrincipalDebt Charges - InterestTransfers In 286,623 652,532 204,862 1,196,636 1,506,673 602,493 18,271 15,228 4,483,317Debt IssueInterest Earned 54,965 11,526 7,310 421,191 (108,815) 128,740 (36,439) 4,678 483,156Closing Balance Dec 31, 2021 2,328,686 774,741 288,369 17,344,728 (6,161,707) 5,419,915 (1,439,686) 193,617 18,748,6632022Transfers Out (12,350) (4,151,250) (4,163,600)Debt Charges - PrincipalDebt Charges - InterestTransfers In 295,221 672,107 1,232,535 1,551,873 620,568 18,819 15,684 4,406,808Debt IssueInterest Earned 63,888 28,499 7,440 463,394 (192,504) 147,839 (36,901) 5,198 486,853Closing Balance Dec 31, 2022 2,687,796 1,462,997 295,809 19,040,656 (8,953,588) 6,188,322 (1,457,768) 214,499 19,478,725456Page 8 <strong>of</strong> 8
Appendix 4: Debt Continuity Schedule27-Mar-13 2012 <strong>2013</strong> 2014 2015 2016 2017 2018 2019 2020 2021 2022Opening BalanceTax Supported 74,567,700 70,063,104 81,496,794 103,661,530 100,708,603 96,685,867 90,883,711 80,971,707 68,026,649 55,524,079 45,013,602Industrial Development 10,000,000 10,000,000 10,000,000 10,000,000 10,000,000 10,000,000 - - - - -Elliott 16,493,000 14,889,679 13,249,401 11,573,166 10,167,016 8,721,952 7,250,930 5,725,037 4,143,273 2,504,636 850,000Enterprise 4,885,853 4,742,800 4,592,157 4,433,522 4,266,471 4,090,556 3,905,308 3,710,232 3,504,806 3,288,481 3,060,678Development Charges 14,828,035 13,156,247 11,448,115 23,167,297 20,941,861 18,659,668 16,283,354 13,811,848 11,244,023 10,722,949 10,175,821Total Opening Debt Outstanding 120,774,588 112,851,830 120,786,467 152,835,516 146,083,951 138,158,042 118,323,304 104,218,824 86,918,750 72,040,145 59,100,102New IssuesTax Supported 2,050,000 18,188,072 30,538,139 8,459,247 8,602,917 7,491,667 3,852,269 - - 2,481,350 9,000,000Industrial DevelopmentElliottEnterpriseDevelopment Charges - 13,500,000 - - - - - - - -Total New Debt Issued 2,050,000 18,188,072 44,038,139 8,459,247 8,602,917 7,491,667 3,852,269 - - 2,481,350 9,000,000Principal RepaymentTax Supported 6,556,444 6,754,383 8,373,402 11,412,174 12,625,653 13,293,822 13,764,274 12,945,058 12,502,570 12,991,826 9,288,345Industrial Development - - - - - 10,000,000Elliott 1,603,321 1,640,278 1,676,235 1,406,150 1,445,064 1,471,021 1,525,893 1,581,765 1,638,636 1,654,636 248,000Enterprise 143,053 150,643 158,635 167,052 175,915 185,248 195,076 205,426 216,325 227,802 227,802Development Charges 1,671,788 1,708,131 1,780,818 2,225,436 2,282,193 2,376,314 2,471,506 2,567,825 521,074 547,128 574,484Total Principal Repayment 9,974,606 10,253,435 11,989,090 15,210,812 16,528,825 27,326,405 17,956,749 17,300,074 14,878,606 15,421,393 10,338,632Ending BalanceTax Supported 70,061,257 81,496,794 103,661,530 100,708,603 96,685,867 90,883,711 80,971,707 68,026,649 55,524,079 45,013,602 44,725,257Industrial Development 10,000,000 10,000,000 10,000,000 10,000,000 10,000,000 - - - - - -Elliott 14,889,679 13,249,401 11,573,166 10,167,016 8,721,952 7,250,930 5,725,037 4,143,273 2,504,636 850,000 602,000Enterprise 4,742,800 4,592,157 4,433,522 4,266,471 4,090,556 3,905,308 3,710,232 3,504,806 3,288,481 3,060,678 2,832,876Development Charges 13,156,247 11,448,115 23,167,297 20,941,861 18,659,668 16,283,354 13,811,848 11,244,023 10,722,949 10,175,821 9,601,337Total Ending Debt Outstanding 112,849,983 120,786,467 152,835,516 146,083,951 138,158,042 118,323,304 104,218,824 86,918,750 72,040,145 59,100,102 57,761,470New Issue Detail:RD0168 Downtown Public Realm / Civic Square - <strong>2013</strong> 5,163,372RD0263 Carden Street - Wilson to Wyndham / Civic Square - <strong>2013</strong> 1,200,000SS0007 Library Land / Baker Street Redevelopment - <strong>2013</strong> 1,250,000SS0018 Library Land / Baker Street Redevelopment Phase 2 - <strong>2013</strong> 2,049,300Library Land Forecast Yet to be Approved - <strong>2013</strong> 1,995,400Library Land Forecast Yet to be Approved - 2014 755,000WC0001 Automated Waste Collection Carts - <strong>2013</strong> 5,200,000FS0044 SEES Pumper - <strong>2013</strong> 230,000RD0267 DC for Clair / Laird & Hanlon Interchange - 2014 13,500,000PS0033 Police HQ Renovations - 2014 - 11,066,800RF0051 VRRC Expansion / Renovation - 2014 - 7,150,000 -Health Unit 11,200,000Downtown Secondary Plan (Parkland Acquisition) 9,000,000CIP Liabilities - Heritage Redevelopment 2,050,000 1,100,000CIP Liabilities - Tax Assistance -CIP Liabilities - TIBG 366,339 8,459,247 8,602,917 7,491,667 3,852,269 - 2,481,350Total New Debt Issued 2,050,000 18,188,072 44,038,139 8,459,247 8,602,917 7,491,667 3,852,269 - - 2,481,350 9,000,000Annual Interest Paid 4,414,849 4,436,467 5,468,566 5,915,920 5,531,928 5,007,175 4,254,517 3,662,270 3,087,875 2,613,527 2,203,986Annual Principal Paid* 9,974,606 10,253,435 11,989,090 15,210,812 16,528,825 27,326,405 17,956,749 17,300,074 14,878,606 15,421,393 10,338,632Annual Debt Servicing (A) $ 14,389,455 $ 14,689,901 $ 17,457,656 $ 21,126,732 $ 22,060,754 $ 32,333,580 $ 22,211,266 $ 20,962,344 $ 17,966,480 $ 18,034,920 $ 12,542,617*NOTE: Debt Servicing Includes HCBP Short Term Loan Forecast $ - $ - $ - $-repayment schedule based on current land sales forecastTotal Debt (B) $ 112,849,983 $ 120,786,467 $ 152,835,516 $ 146,083,951 $ 138,158,042 $ 118,323,304 $ 104,218,824 $ 86,918,750 $ 72,040,145 $ 59,100,102 $ 57,761,470Operating Fund Revenue - ARL (C) $ 316,984,808 $ 326,038,493 $ 335,368,240 $ 344,982,897 $ 354,891,603 $ 365,103,799 $ 375,629,241 $ 386,478,011 $ 397,660,522 $ 409,187,536 $ 421,070,175Less: Other Revenue (Investment Inc., DC Earned, etc.) 51,011,452 52,031,681 53,072,314 54,133,760 55,216,436 56,320,764 57,447,180 58,596,123 59,768,046 60,963,407 62,182,675Operating Fund Revenue - S&P (D) $ 265,973,357 $ 274,006,812 $ 282,295,926 $ 290,849,137 $ 299,675,167 $ 308,783,034 $ 318,182,062 $ 327,881,887 $ 337,892,476 $ 348,224,130 $ 358,887,500Debt Servicing/Operating Fund Revenue (A/C) 5% 5% 5% 6% 6% 9% 6% 5% 5% 4% 3%Debt Servicing/Operating Fund Revenue (A/D) 5% 5% 6% 7% 7% 10% 7% 6% 5% 5% 3%Total Debt/Operating Fund Revenue (B/C) 36% 37% 46% 42% 39% 32% 28% 22% 18% 14% 14%Total Debt/Operating Fund Revenue (B/D) 42% 44% 54% 50% 46% 38% 33% 27% 21% 17% 16%General Assumptions1) New Debt (except HCBP Flexible Loan or Principal at least $10,000,000) - 10 year term, 4%3) Principal at least $10,000,000 - 20 year term, 5% (Clair / Laird & Hanlon Interchange, Police HQ Renovations, & Health Unit)2) HCBP Interest Only Short Term Construction Loan (2.5%)4) Operating Revenue - assume 3.5% annual increase for tax and 2.0% for other457