Download the presentation here - Kenya Airways
Download the presentation here - Kenya Airways
Download the presentation here - Kenya Airways

Create successful ePaper yourself
Turn your PDF publications into a flip-book with our unique Google optimized e-Paper software.
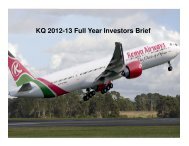
Business and Financial ReviewFull Year Ended 31 March 20121
AgendaGlobal EconomyAirline Industry OverviewKQ Business ReviewFinancial ResultsRights IssueNext YearQ & AChairman’s Remarks2
Fragile outlook in Industry Profitability Forecast Profits for Airlines globally in 2012downgraded from US$ 3.5bn to US$ 3.0bn Outlook for 2012 remain positive due improvingmacro-economic conditions Factors impacting 2012 include• Sharp rise in oil prices since Dec 2011• Euro zone crisis abatingAirline Industry• Profitability in 2012 will be sustained due slower capacitygrowthSource: IATA website4
Airline profits forecast to fall fur<strong>the</strong>r in 2012Global commercial airline profitability6.0203.0EBIT margin(left scale)15105% revenues0.0-3.0-6.0Net posttax losses(right scale)0-5-10-15-20-25US$ billion-9.01999200020012002200320042005200620072008200920102011F2012F-30Source: IATA Website5
Business confidence starting to turn upSource: IATA Website6
Industry Statistics Jan-Dec (2011 vs. 2010)RPK%GrowthASK%GrowthPLF %FTK%GrowthATK%GrowthAfrica 0.5 2.2 67.6 (1.8) 2.5Asia/Pacific 5.4 6.0 76.8 (4.6) 0.4Europe 9.1 9.6 78.0 1.3 6.2Middle East 8.6 9.1 75.5 8.1 13.4NorthAmerica 2.2 2.3 82.1 0.4 3.8LatinAmerica 11.3 9.8 74.6 6.0 4.3Industry 5.9 6.3 78.1 (0.7) 4.1KQ 14.7 11.2 71.3 10.8 13.8Source: IATA Website & KQ7
Key activities over <strong>the</strong> past year8
Category Fleet Type Seats 2012 2011Wide bodyFleet in Service as at March 2012Boeing 777-200 322 4 4Boeing 767-300 216 5 6Boeing 747-400 Freighter 1 -Narrow bodyBoeing 737-800 145 5 5Boeing 737-700 116 4 4Boeing 737-300 116 6 6Embraer 190 96 4 1Embraer 170 72 5 5Total Fleet 34 31Total Seats 4,997 4,9259
NetworkRoutes launched in <strong>the</strong> financial yearOuagadougouN’DjamenaJeddah10
KQ Destination Growth11
Simulator CertificationKQ B737NG Simulator certified by UK Civil AviationAuthority and KCAA12
Historical Employees and Pilots Headcount13
Information Systems Amadeus Altea Reservation/Inventory/DepartureControl Systems :-Status Reservation & Inventory Module Completed inSep 2011 Departure Control System OngoingMar2013 Skyteam Systems:- SkyPriority Module Completed inDec 2011 Sky Billings Module Completed inJan 2012 Skyteam Lounge Access OngoingMar201314
Website enhancementsInformation Systems -ContinuedStatus Cargo /French Websites Completed Technical/Maintenance and Learning & development Ongoing M-Commerce System:- USSD service (<strong>the</strong> use of *737#) Feb12(USSD-Unstructured Supplementary Service Data) Mobile Web site A shorter more portable mobile version of KQ website Mar1215
Corporate Social ResponsibilityBroken down into 4 major categories Education - KShs 10.7m Water – KShs 2.5m Environment – KShs 49.05m Health – 13.14mTotal – KShs 75.39m16
EducationKQ donates desks to schools in Lilongwe Malawi17
HealthKQ boosts National famine relief kitty18
EnvironmentKWS conservation centre at Hell’s Gate Naivasha19
2011/12 Financial Results20
Operating Statistics2012 2011 Var Var %ASK's (mil) 13,875 12,854 1,021 7.9RPK's (mil) 9,943 8,896 1,047 11.8Cabin Factor % 71.7% 69.2% 2.5%B/Even C/F% 64.5% 54.0% (10.5%)Passengers ('000s) 3,644 3,137 508 16.2Yield per RPK incl YR(USc) 9.90 9.76 0.14 1.5Exchange Rate (KSh/US$) 88.58 79.69 (8.89) (11.2)RASK (Usc) 7.74 6.78 0.96 14.2CASK (USc) 6.38 5.27 (1.11) (21.1)KQ Cargo Tonnes 62,504 56,401 6,103 10.8Cargo Yield per KG (US$) 1.59 1.49 0.10 6.4Employees 4,834 4,355 (479) (11.0)OTP 60.3% 58.8% 1.5% 21
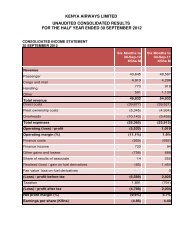
Consolidated Income StatementKShs Mil. 2012 2011 Var Var %Turnover 107,897 85,836 22,061 25.7Direct Operating Costs (77,217) (53,419) (23,798) (44.5)Fleet Ownership Costs (9,970) (9,622) (348) (3.6)Gross Profit 20,710 22,795 (2,085) (9.2)Overheads (19,404) (16,980) (2,424) (14.3)Operating Profit 1,306 5,815 (4,509 ) (77.5)Operating Margin % 1.2% 6.8% (5.6)Net Finance Revenue/(Cost ) (2,116) (953) (1,163) (122.0)Precision Air Profit 489 (188) 677 360.1Realised Gain/(Losses) on fuel derivatives 2,508 298 2,210 741.6Fair value gains/(loss) on fuel derivatives (41) 30 (71) (236.7)Profit Before Tax 2,146 5,002 (2,856) (57.1)Taxation (486) (1,464) 978 66.8Profit After Tax 1,660 3,538 (1,878) (53.1)Profit After Tax Margin % 1.5% 4.1% 2.6%22
Benchmarking on 2011/12 ResultsEK LH AF/KL SQ KQTurnover (USD mil) 16,972 38,414 32,571 12,070 1,218Operating Profit 494 1,033 (472) 1.5 15OP Margin% 2.85% 2.69% -0.30% 0.01% 1.2%Net Profit 409 (17) (948) 336 19Net Margin% 2.40% (0.05%) (3.76%) 2.78% 1.50%23
Statement of Financial PositionKShs Mil 2012 2011 Var Var %ASSETSAircraft 42,904 44,096 (1,192) (2.7)Properties, plant & equip 7,892 7,727 165 2.1Leasehold land & buidings 5 5 0 5.2Deferred expenditure 94 - 94 n/aAircraft deposits 4,364 2,797 1,567 56.0Investments in Ass co & o<strong>the</strong>rs 230 338 (108) (32.0)Total Non-Current Assets 55,489 54,963 526 1.0Inventories 2,683 1,907 776 40.7Trade receivables 7,914 9,197 (1,283) (14.0)O<strong>the</strong>r receivables 2,305 1,962 343 17.5Corporate tax recoverable 764 835 (71) (8.5)Fuel derivatives 1,437 2,594 (1,157) (44.6)Cash and Equivalents 6,840 7,254 (414) (5.7)Total Current Assets 21,943 23,749 (1,806) (7.6)Total Assets 77,432 78,712 (1,280) (1.6)24
Statement of Financial PositionKShs Mil 2012 2011 Var Var %EQUITY AND LIABILITIESCapital 2,308 2,308 - -Revenue Reserve 21,395 20,714 681 3.3Hedge Reserve (741) 68 (809) (1,189.7)Minority interests 61 53 8 15.1Total Capital & Reserves 23,023 23,143 (120) (0.5)Aircraft Loans 26,869 25,449 1,420 5.6Deferred Taxation 8,318 8,277 41 0.5Deferred Income 2,332 2,406 (74) (3.1)Finance Lease Obligation 1,222 1,436 (214) (14.9)Total Non-Current Liabilities 38,741 37,568 1,173 3.1Advance Sales Collections 6,628 9,010 (2,382) (26.4)Trade & O<strong>the</strong>r Creditors 9,040 8,991 49 0.5Total Current Liabilities 15,668 18,001 (2,333) (13.0)Total Equity and Liabilities 77,432 78,712 (1,280) (1.6)25
Statement of Cash FlowsYear to date 2012 2011 Var Var %KShs MilProfit before tax 2,146 5,002 (2,856) (57.1)Non operational items 5,662 6,876 (1,214) (17.7)Movt in working capital (2,169) (1,341) (828) 61.7Operating activities 5,639 10,537 (4,898) (46.5)Income taxes paid (164) (116) (48) 41.4Net Cash from Ops 5,475 10,421 (4,946) (47.5)Investing ActivitiesCapex Expenditure (3,584) (3,557) (27) 0.8Disposal proceeds 188 47 141 300.0Deposit refunds 318 - 318 >100.0Aircraft deposits (2,053) (287) (1,766) 615.3O<strong>the</strong>rs 250 172 78 45.3Net cash used in investing Activities (4,881) (3,625) (1,256) 34.6Financing ActivitiesDividends paid (693) (462) (231) 50.1Loans raised 5,207 - 5,207 >100.0Repayment of L.T loans & lease oblgs (4,181) (3,824) (357) 9.3Interest paid (1,341) (1,379) 38 (2.8)Net cash used in financing Activities (1,008) (5,665) 4,657 (82.2)Decrease in cash and cash equiv (414) 1,131 (1,545) (136.6)Cash & Cash equiv at beg 7,254 6,123 1,131 18.5Cash & Cash equiv at end 6,840 7,254 (414) (5.7)26
Fuel Hedging27
Historical Market trend price Curve)28
Hedged Fuel price Vs Market fwd. Price(Period-2011-2012)29
(Period-2011-2012)DividendProposed dividend at 0.25 per share = KShs 374m30
Rights Issue31
Rights Issue Offer StatisticsRights Issue Offer StatisticsSubscription Price KShs. 14/= per New ShareTotal Number of New Shares Offered 1,477,169,549Gross Proceeds to be raised (KShs.) KShs. 20,680,373,686/=Ratio of Entitlement: Sixteen (16) NewRatio of Entitlement:Shares for every Five (5) OrdinaryShares held as of <strong>the</strong> Record Date.Minimum subscription performance rate 70.00%32
Results of <strong>the</strong> Rights Issue OfferTotal number of new shares accepted under entitlement of existing shareholders 839,657,410Total value of shares accepted under entitlement of existing shareholders KShs. 11,755,203,740.00Total number of additional New Shares applied for by existing shareholders 42,023,480Total value of additional New Shares applied for by existing shareholders KShs. 588,328,720.00Total number of New Shares applied for under rump applications 0Total value of New Shares accepted under rump applications KShs. 0Total number of new shares accepted by new investors 11,212,061Total value of shares accepted by new investors KShs. 156,968,854.00Total number of additional New Shares applied for by new investors 141,960,600Total value of additional New Shares applied for by new investors KShs. 1,987,448,400.00Grand total number of New Shares applied for under Rights Issue 1,034,853,551Grand total value of New Shares applied for under Rights Issue KShs. 14,487,949,714.00Number of lapsed rights 442,315,998Total subscription performance rate 70.06%33
Final Scenario GOK at 100% and KLM at 73% entitlementExisting % Rights Issue % Total %GOK 106,171,561 23.00% 339,748,995 32.83% 445,920,556 29.80%O<strong>the</strong>r <strong>Kenya</strong>ns 183,712,579 39.80% 197,013,276 19.04% 380,725,855 25.44%Total <strong>Kenya</strong> 289,884,140 62.80% 536,762,271 51.87% 826,646,411 55.24%KLM 120,020,026 26.00% 280,000,000 27.06% 400,020,026 26.73%IFC 0 0.00% 143,000,000 13.82% 143,000,000 9.56%O<strong>the</strong>r Foreign 51,711,317 11.20% 75,091,280 7.26% 126,802,597 8.47%Total Foreign 171,731,343 37.20% 498,091,280 48.13% 669,822,623 44.76%Total KQ 461,615,483 100.00% 1,034,853,551 100.00% 1,496,469,034 100.00%Shares offered 1,477,169,549Percentage Subscription70.06%34
Final Scenario GOK at 100% and KLM at 73% entitlementExisting Rights Issue Total KSHS USD %GOK 106,171,561 339,748,995 445,920,556 4,756,485,930 57,500,000 29.80%O<strong>the</strong>r <strong>Kenya</strong>ns 183,712,579 197,013,276 380,725,855 2,758,185,864 33,343,037 25.44%Total <strong>Kenya</strong> 289,884,140 536,762,271 826,646,411 7,514,671,794 90,843,037 55.24%KLM 120,020,026 280,000,000 400,020,026 3,920,000,000 47,387,925 26.73%IFC 0 143,000,000 143,000,000 2,002,000,000 24,201,690 9.56%O<strong>the</strong>r Foreign 51,711,317 75,091,280 126,802,597 1,051,277,920 12,708,643 8.47%Total Foreign 171,731,343 498,091,280 669,822,623 6,973,277,920 84,298,258 44.76%Total KQ 461,615,483 1,034,853,551 1,496,469,034 14,487,949,714 175,141,295 100.00%Shares offered 1,477,169,549 Target 20,680,373,686 250,000,000Percentage Subscription70.06% Achieved 70.06% 70.06%35
Q & A36