A Method to Identify Contaminant Source Areas (PDF)
A Method to Identify Contaminant Source Areas (PDF)
A Method to Identify Contaminant Source Areas (PDF)

Create successful ePaper yourself
Turn your PDF publications into a flip-book with our unique Google optimized e-Paper software.
HSA Engineers & Scientists• TRADITIONAL ASSESSMENT• MAGS OVERVIEW• MAGS METHODOLOGY• THEORY• CASE STUDY• CONCLUSIONSOverview of Presentation
HSA Engineers & Scientists• TRADITIONAL ASSESSMENT• MAGS OVERVIEW• MAGS METHODOLOGY• THEORY• CASE STUDY• CONCLUSIONSOverview of Presentation
HSA Engineers & ScientistsScientistsTRADITIONAL SOIL ASSESSMENTASSESSMENT• Discrete Soil Sampling• Passive Soil Gas Sampling• Active Soil Gas Sampling• Short-comings– Sample Volume– Statistical SignificanceOverview of Presentatio n
HSA Engineers & ScientistsScientistsLimitations of Soil Sampling Sampling• Heterogeneity- over scales < inches–Heterogeneity can be less than inches (Abrio(Abriola, Feenstra)• Release pattern of chemicals can be complex– Location of the release is not known– <strong>Contaminant</strong> distribution is not continuous between samplinglocations– Release area must be on the order of the sampling interval fordetection• Release size must be on the order of the samplinginterval for detection• Small releases can ultimately result in GW impactsabove standardsOverview of Presentatio n
HSA Engineers & ScientistsScientistsDiscrete Soil Sampling• Five grams of soil per sample• For a 10′ x 10′ area (5 samples/ 5′ 5 deep), themass of soil would be ~56,000 pounds– Sampled mass of soil is ~0.0001% of the <strong>to</strong>tal <strong>to</strong>tal• For a 100′ x 100′ area (5 samples/ 5′ 5 deep)–Sampled mass of soil is ~0.000001% of the <strong>to</strong>tal• Small amount of soil is then relied upon <strong>to</strong>be statistically representative of the <strong>to</strong>talarea sampled• “Finding the needle in the haystack”
HSA Engineers & Scientists• TRADITIONAL ASSESSMENT• MAGS OVERVIEW• MAGS METHODOLOGY• THEORY• CASE STUDY• CONCLUSIONSOverview of Presentation
HSA Engineers & ScientistsScientistsModified Active Gas Sampling (MAGS) (MAGS)• Rapid detection <strong>to</strong>ol for Vadose VOC sources• Using a regenerative blower and a detec<strong>to</strong>r, , alarge volume of soil can be sampled using only afew points• MAGS lacks the resolution of traditional soilsampling methods, but the statistical representativeness is much greater greater• Site assessment & remedial assessmentremedial assessment– MAGS directly yields remedial design data
HSA Engineers & Scientists•Flow Throttling Device (valve)•Ancillary piping (2-inch PVC)•Moisture Separa<strong>to</strong>r•Toxic Vapor Analyzer•One-LiterTedlar bags•2.5-hp, 120/240VAC, 1Φ 1 regenerative blower•120/240VAC 30/15A 1Φ 1 electrical source•2-inch diameter, 0.01-slotted PVC C well screen•20/30 graded silica sand
HSA Engineers & ScientistsMAGS Results• Assuming a 25′ ROI, MAGS yields:– One sampling point for entire 10′ x 10′ plot– Five sampling points for entire 100 ′ x 100′ plot• MAGS at drycleaning facilities– Low-level impacts (30(<strong>to</strong> 100 μg/kg- PCE) resultingfrom soil vapor transport are detected over a broad area– These low-level level impacts are generally an indication ofa nearby, larger source– When the release occurred at the surface and groundwaterimpacts are present, an unsaturated zone source shouldbe expected
HSA Engineers & ScientistsPlanning• Select MAGS points based on typical release locations• A surface seal is needed <strong>to</strong> achieve the best ROI• Consider where the air will be flowing and avoid introducing “dead spots”–Avoid points near the edge of a the surface seal, because little air will flowfrom the direction opposite the edge• Hydraulic conductivity of the soil will influence the number ofMAGS points required– Typical ROIs for silty sand with a surface seal are 25 <strong>to</strong> 35 feet• On initial boring, install additional extraction/moni<strong>to</strong>ring points– Placing points perpendicularly, horizontal isotropy can be be estim ated• MAGS is inappropriate for sites with a depth <strong>to</strong> water of lessthan ~2.5 feet (~30 inches of water)
HSA Engineers & Scientists• TRADITIONAL ASSESSMENT• MAGS OVERVIEW• MAGS METHODOLOGY• THEORY• CASE STUDY• CONCLUSIONSOverview of Presentation
HSA Engineers & ScientistsScientistsMAGS <strong>Method</strong>ology<strong>Method</strong>ology• Temporary piezometers <strong>to</strong> extract soil vaporat a relatively high rate (up <strong>to</strong> 100 cubic feetper minute [cfm])– Soil impacts within the radius of influence– Piezometers focused in areas with his<strong>to</strong>ricalgroundwater impacts or operations– Constructed using a hand-augerauger– For sand or silty sand, a radius of influence of20 <strong>to</strong> 30 feetMAGS <strong>Method</strong>ologythodology
HSA Engineers & ScientistsScientistsMAGS <strong>Method</strong>ology<strong>Method</strong>ology• During extraction, the soil vapors will bedynamically analyzed using a TVA• Soil gas samples with elevated TVA resultsare collected and analyzed using a field gaschroma<strong>to</strong>graph• Confirma<strong>to</strong>ry analysis via a fixedlabora<strong>to</strong>ry, using one-liter Tedlar bags• This method provides a three-tieredtieredapproach <strong>to</strong> assessment of soil vapors anddefining soil impactsMAGS <strong>Method</strong>ologythodology
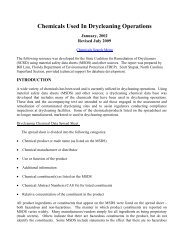
HSA Engineers & ScientistsMAGS SchematicMAGS <strong>Method</strong>ology
HSA Engineers & ScientistsScientistsMAGS Advantage• For a 10-foot by 10-foot area that is five feet deep– MAGS: one sampling point for complete coverage– For coverage of 1% of the area,• Discrete soil sampling requires 250,000 samples• Passive gas sampling requires 2,500 samples• Active gas sampling requires 1 sample• For a 100-foot by 100-foot area that is five feet deep deep– MAGS: Five Fsampling points for for complete coverage– For coverage of 1% of the area,• Discrete soil sampling requires 5,100,000 samples• Passive gas sampling requires 51,000 samples• Active gas sampling requires 32 samplesMAGS <strong>Method</strong>ologythodology
HSA Engineers & ScientistsData Collection• Airflow rates should be 10 <strong>to</strong> 50 cfm at 10 <strong>to</strong> 100” of water• Sampling time interval of approximately 15 minutes• Collect soil parameters (foc, n, ρb,θw, , and grain size) and VOCs• Air movement versus Energy movement• Estimate the required purge time <strong>to</strong> reach a new dynamicequilibrium with respect <strong>to</strong> airflow • Recommended distances for points are 10, 20, and 30 feet• Purge a minimum of one pore volume• Use semi-log plot of vacuum versus distance <strong>to</strong> determine theeffective ROI (a vacuum level of 0.1 inches of water or greater)at the end of MAGS sampling
HSA Engineers & ScientistsData Collection Collection• Record TVA (containing(a PID/FID) measurementswith time• Field GC and/or labora<strong>to</strong>ry samples gathered inTedlar bags based on TVA results• Use vacuum pumps for sampling or sample from the discharge side of the blower, without dilution air. • Collect 5 measurements per pore volume• Correlate TVA readings field GC and lab results• Based on experience, practically all of the detectedspecies are of the parent compound• Sequential use of MAGS points allows the location ofthe source by triangulation
HSA Engineers & Scientists• TRADITIONAL ASSESSMENT• MAGS OVERVIEW• MAGS METHODOLOGY• THEORY• CASE STUDY• CONCLUSIONSOverview of Presentation
HSA Engineers & ScientistsMAGS Theory• VOCs are transferred from pure, dissolved, andsorbed phases in<strong>to</strong> the air-filled porosity• Diffusion through air occurs until a pore connected <strong>to</strong> the moving air stream is encountered • Early in MAGS, vapor is at local steady state,and mass recovery is limited by airflow rate andnot boundary layer mass transfer• Mass diffusing through a water film will likelybe mass transfer limited, while pure and sorbed-phase mass is likely <strong>to</strong> be at equilibrium
Qm& =× C = Vp× CAHSA Engineers & ScientistsMAGS Theory• Mass Flow from Piezometer is Known KnownQm & = C VpCA× = ו Estimate of “Time <strong>to</strong> Pore Equilibrium” versus “Travel Time Through Pore” must be mademust be madetD=aπ2dDaV ( r)=Q2π r b nt p( r)=dV ( r)• If the time for air <strong>to</strong> move across the pore space is long ascompared <strong>to</strong> the time for mass <strong>to</strong> diffusive in<strong>to</strong> the pore space,the system will return <strong>to</strong> equilibriumTheory
Qm ShυScp×A10.585 3&HSA =1.17 × CRe=V ScEngineers C for roughly spherical particles& and nScientists~ 0.4 & Re > 10DC ABMAGS Theory• Reynolds number and Peclet number allowunderstanding of the nature of mass transferRe =VdυPe =• The Sherwood number allows the quantificationof mass transferVdDSh0.585 3= 1.17 Re Sc1forroughlysphericalparticlesandn~0.4 & Re> 10(for packed beds)Sc =υDC ABTheory
HSA Engineers & ScientistsData Interpretation• During the first pore volume, peaks indicatethe presence of a source at radius• A sustained detection > 0.5 mg/m 3 may indicate a source for shallow groundwatergroundwater• Pure phase or substantial adsorbed impacts arecharacterized by sustained mass flux• Mass from the dissolved phase, from vaportransport, or mass in low transmissivity zoneslikely have mass transport limitations, andhence respond through asymp<strong>to</strong>ticallydeclining concentrations
HSA Engineers & ScientistsPotential Curves
Q υmSc Sh =ADC AB10.585& HSA == 1.17 × C Re = V × ScEngineers C 3 for roughly spherical particles & and n Scientists~ 0.4 & Re > 10pMeaning of Results• A minimum mass can be calculated– Corresponds <strong>to</strong> mass that is felt by the system ascompared <strong>to</strong> the actual mass– This mass could be very small• Limitations– Must account for the effect of pressure change onHenry’s s Law constant– Some mass cannot be sensed by the system system– This mass is of less exposure consequenceconsequence– Other methods no better
HSA Engineers & Scientists• TRADITIONAL ASSESSMENT• MAGS OVERVIEW• MAGS METHODOLOGY• THEORY• CASE STUDY• CONCLUSIONSOverview of Presentation
HSA Engineers & ScientistsScientistsABC• Initial Assessment––• MAGS––• Results––ABCPCE identified in soil at a maximum mum concentration of 75 ug/kgGroundwater had extremely high concentrationsMAGS performed at 7 LocationsArea of significant impact identified ied and influent air concentrationstionsas high as 500 mg/m 3 near where soil samples were collectedSVE system designed <strong>to</strong> focus in area of impactSVE recovers more than 100 pounds of PCE Mass over 6 monthperiod and surficial groundwater concentrations are belowNADSCsCase StudiesCase StudiesCase Studies
HSA Engineers & ScientistsScientistsAeronautical ManufacturerManufacturer• Assessment– Small area of TCE impact in soil (Discrete Sampling)– Dual-phase remediation complete, groundwaterimpacts remained• MAGS– MAGS at six locations throughout site– MAGS results identify two separate soil source areaswithin the discrete soil sampling area• Results– Dual-phase system modified <strong>to</strong> address additionalsources, and groundwater concentrations are nowdecreasing (>100 lbs of mass recovered)Case StudiesCase StudiesCase Studies
HSA Engineers & ScientistsScientistsSally Beauty• Drycleaner site following operation ofGroundwater Recovery System– Groundwater Moni<strong>to</strong>ring indicates residual PCEimpacts <strong>to</strong> groundwater slightly above MCLs, whichwere sustained for almost a decade– Discrete soil analysis results are non-detect in unsaturated soils soils– MAGS locates significant PCE concentrationsbeneath building and mass estimates suggest that asmuch as 5 grams of PCE mass removed during the 5hour MAGS eventCase StudiesCase StudiesCase Studies
HSA Engineers & ScientistsScientistsCommon Approach Approach• Aggressive source remediation–Focus on mass removal or destruction• Biological polishing of residual impacts– Reductive dechlorination <strong>to</strong> ethene– Reductive dechlorination of parent, with oxidation ofbreakdown products• KEY - Sustaining biomass capable of remediatingresidual mass / flux until source is depleted– When <strong>to</strong> stimulate versus augment– Nutrients and trace elements!– Rebound once limiting parameter depleted
HSA Engineers & Scientists• AssessmentReasons for Failure– Failure <strong>to</strong> locate unsaturated zone mass• Unsaturated zone impacts missed due <strong>to</strong> discrete sampling– Saturated zone assessment limitations– Natural attenuation masks significant impacts• Transport limitations– Rebound from low transmissivity zones & organic layers (2 o )• Environment for Bioremediation (Optimization)– Inadequate bioavailable carbon, nutrients, trace nutrients, ormicroorganisms (biomass generation)– ORP not in proper range (TEA competition)– Ability <strong>to</strong> distribute amendment
HSA Engineers & ScientistsScientists1.2.3.4.Modified Active Gas SamplingSignificance of 5 grams in1,000 <strong>to</strong>ns of soil?Samples large radiusquickly in silty <strong>to</strong> sandysoilsAllows simultaneouscollection of remedialdesign informationLocation of source forsaturated zone
HSA Engineers & ScientistsCase Study: Drycleaner in Florida• Operated 10 years <strong>to</strong> mid-19901990’s• Assessment Results:– Releases out back door & near machine– Mostly breakdown products ~100 ug/L– MAGS located area of concern• K = 6 <strong>to</strong> 12 ft/d• Gradient averaged 0.001 ft/ft• Strip Mall precluded excavation• Plume extended 200 feetSilty SandOrganicsSilty Sandft510152025Limes<strong>to</strong>ne 30• Initially, DPE and BiospargeClaySPDC35
HSA Engineers & ScientistsAssessment ResultsMW-1 1 (1996)P/T/C/V40/110/81/
HSA Engineers & ScientistsScientistsGeochemical Data Data• Initial Biosparge system failed• DO < 1 mg/L, TOC = >20 mg/L• Low DO, No nitrate, No sulfide (sulfate presentat 50 <strong>to</strong> 100 mg/L), Ferric iron but not ferrousiron present• Redox was at the level of iron reduction• BOD
HSA Engineers & ScientistsRemedial Action• MAGS located unsaturated zone impacts• Dual-phaseused <strong>to</strong> remediate unsaturated andsaturated zone impacts (1 kg of PCE recoveredin six months)• Groundwater recovery and biospargesystem used for residual mass (1999-2002–8.2 kg recovered)• Lactate injection and bio-augmentation(2002-2004 2004 in source area)– Monthly lactate injections for 1.5 years– Quarterly lactate and nutrient injections for 2 years
HSA Engineers & ScientistsConcentration (uM)1001010.10.01Oct-95Total VOC versus Time at <strong>Source</strong> WellDPEJul-96Mar-97Nov-97Jul-98Mar-99Dec-99Aug-00Apr-01Dec-01Sep-02May-03Jan-04Sep-04May-05Time (days)Pumping &LactateLactate &Nutrients Moni<strong>to</strong>rDHEAdditionConversionFirst Lactate<strong>to</strong> PumpingAdditionWellConcentrations (uM)1001010.10.01Oct-95Total VOC versus Time Down-gradientJul-96Mar-97Nov-97Jul-98DPEMar-99Bio-SpargeBio-SpargeDec-99Aug-00Pumping &LactateApr-01Time (days)Dec-01Lactate &Nutrients Moni<strong>to</strong>rSep-02May-03Jan-04Sep-04May-05
HSA Engineers & Scientists DatePCETCEcDCEID tDCE VCMW-1 7/22/1996 40 110 81 15 < 1MW-1 7/16/1997 78 400 440 140 < 1MW-1 7/2/1998 12.2 166 580 113 0.78MW-1 DPE & 4/6/2000 350 28 21.3 < 1Biosparge MW-1 5/23/2000 610 100 69.1 < 1MW-1 6/20/2000 980 160 48.9 < 1MW-1 Pumping 8/10/2000 140 78 33.2 < 1& MW-1 Lactate8/31/2000 < 1 2.4 17.0 < 1MW-1 10/18/2000 120 170 62.0 < 1MW-1 12/14/2000 730 210 54.9 < 1MW-1 2/27/2001 250 440 49.9 < 1MW-1 5/18/2001 150 1,000 1,119 < 1MW-1 8/1/2001 210 130 124 < 1MW-1 11/16/2001 370 170 53.7 < 1MW-1 1/3/2002 180 250 65.2 8MW-1 Lactate,te, 5/31/2002 312 129 69.8 14Nutrients, MW-1 , DHE 12/ 12/2002 3.0 3.0 19.5 23MW-1 2/17/2003 < 1 < 1 < 1 3.3Moni<strong>to</strong>ring MW-1 7/2/2004 < 1 1.1 < 1 < 1 1.9MW-1 9/30/2004 < 1 < 1 < 1 < 1 < 1MW-1 12/15/2004 < 1 < 1 < 1 < 1 2.1
HSA Engineers & ScientistsID Date PCE TCE cDCE tDCE VCCW-1 DPE & 12/03/99 5.9 44.5 160 31.2 7.1CW-1 Biosparge 06/20/00 3,700 2,500 210 6.5 2.0CW-1 07/14/00 3,300 3,200 230 7.8 < 1CW-1 Pumping 08/31/00 < 1 230 520 99 13CW-1 & Lactate10/18/00 260 920 310 45 32CW-1 12/14/00 2.2 45 420 120 40CW-1 02/27/01 < 1 21 300 84 23CW-1 05/18/01 < 1 2.7 440 < 1 36CW-1 08/01/01 < 1 2.1 170 41 12CW-1 12/03/01 < 1 15 74 31 62CW-1 Lactate,02/01/02 2.2 21 50 22 99CW-1 Nutrients, DHE 05/31/02 < 1 3.9 130 21.3 90.2CW-1 10/01/02 < 1 4.7 35.9 12.5 21CW-1 12/12/02 < 1 7.0 57.7 43.9 51.6CW-1 02/17/03 < 1 10.3 76.2 46.6 40CW-1 06/27/03 1.9 1.9 7.1 8.3 18.4CW-1 09/18/03 < 1 40 79 8.1 23CW-1 11/25/03 2.2 6.2 25.1 2.4 22.3CW-1 03/23/04 < 1 1.2 23.8 7.0 30.3CW-1 Moni<strong>to</strong>ring 7/2/2004 < 1 2.0 8.1 12.4 16.5CW-1 9/30/2004 1.3 3.0 4.2 < 1 2.7CW-1 12/15/2004 < 1 < 1 < 1 < 1 < 1
HSA Engineers & ScientistsSummary8• Natural attenuation masked source in organic layer • MAGS allowed remediation of unsaturated zone impacts and location of saturated zone source source• Biosparge caused rebound (concentrations increased<strong>to</strong> a <strong>to</strong>tal equivalent PCE concentration of 7,800 ug/L)by disrupting NA biological processes• Pro<strong>to</strong>col developed <strong>to</strong> avoid these issues• Optimization of bio-stimulation/ bio-augmentation hasbeen successful• One year post-treatment,treatment, the source well contains 2.1ug/L VC
HSA Engineers & Scientists• TRADITIONAL ASSESSMENT• MAGS OVERVIEW• MAGS METHODOLOGY• THEORY• CASE STUDY• CONCLUSIONSOverview of Presentation
HSA Engineers & ScientistsConclusions• MAGS provides a statistically significant way <strong>to</strong>assess volatiles in soil• MAGS provides a powerful positive/negativeassessment technique and a rational means of“zeroing in” on sources• MAGS allows the collection of SVE design data– Radius of influence– Pressure versus flow rate– <strong>Contaminant</strong> mass loading• For surface releases, there is always a soilsource• MAGS trades resolution for significancesignificance– The resolution is sufficient for remediationremediation
ConclusionsHSA Engineers & ScientistsScientistsConclusions• Initial area-wide MAGS studies can savetime and money when assessing soils andcan be used effectively with discrete soilsampling <strong>to</strong> fulfill current regula<strong>to</strong>ryrequirements– <strong>Identify</strong> locations of unknown source areas – Provide initial information <strong>to</strong> develop (andlimit the size of) a discrete soil sampling plan
HSA Engineers & Scientists2008 AnnualMeetingModified Active Gas SamplingMAGSRichard Lewis, Ph.D., P.E.HSA Engineers & ScientistsA Member of the CRA Family of CompaniesOc<strong>to</strong>ber 21, 2008