AQR Color-Tec Method AQR Color-Tec Method - State Coalition for ...
AQR Color-Tec Method AQR Color-Tec Method - State Coalition for ...
AQR Color-Tec Method AQR Color-Tec Method - State Coalition for ...
- No tags were found...

Create successful ePaper yourself
Turn your PDF publications into a flip-book with our unique Google optimized e-Paper software.
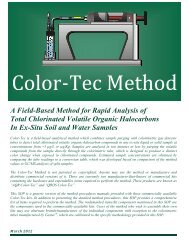
<strong>AQR</strong> <strong>Color</strong>-<strong>Tec</strong> <strong>Method</strong>Certified Training ProgramPart 1What is <strong>Color</strong>-<strong>Tec</strong>?<strong>Method</strong> Classification
Analytical Quality Levels1. The analytical method identifies thepresence/absence of a class of contaminants2. The analytical method identifies thepresence/absence of a particular contaminant3. The analytical method identifies thepresence/absence of a particular contaminant ator near regulatory clean-up levels(Portable Instruments & Test Kits)QualitativeData4. The analytical method reliably quantifies theconcentration of a particular contaminant with aknown analytical quantity to below regulatoryclean-up levelsQuantitativeData(CG/MS - Fixed and Mobile Laboratory)
<strong>AQR</strong> <strong>Color</strong>-<strong>Tec</strong> <strong>Method</strong> -ClassificationLevel 1Level 3<strong>Color</strong>imetric Reagent Test KitProvides Qualitative DataNon-Standard (Decision quality)Identifies the presence/absence of acontaminant class (Chlorinated VOHs)Detects concentrations at or nearregulatory clean-up levels of allcompounds in that contaminant classProvides Semi-Quantitative DataStatistical analysis of the <strong>Color</strong>-<strong>Tec</strong> data to comparisondata of a known analytical quality provides estimatedconcentrations and method confidence limits
Compounds Detected With <strong>AQR</strong> <strong>Color</strong>-<strong>Tec</strong>All Chlorinated Volatile Organic HalocarbonsChlorinated AlkenesCompoundEPA MCL (µg/L)Tetrachloroethene 5Trichloroethene 5Cis-1,2-DCE 70Trans-1,2-DCE 1001,1-DCE 7Vinyl Chloride 2Chlorinated AlkanesCompoundEPA MCL (µg/L)Carbon tetrachloride 5Dichloromethane 5(methylene chloride)1,1-DCA -1,2-DCE 51,1,1-TCA 200“Total Chlorinated Compounds”
Sampling Media Applicable to <strong>AQR</strong> <strong>Color</strong>-<strong>Tec</strong><strong>Color</strong>-<strong>Tec</strong> can be used to analyze any liquid orsolid mediaSolid MediaUnsaturated soilAquifer matrixSludge/SedimentPlant tissueLiquid MediaGroundwaterPore-waterWastewaterDrinking water
<strong>AQR</strong> <strong>Color</strong>-<strong>Tec</strong> <strong>Method</strong>Certified Training ProgramPart 2How Does <strong>Color</strong>-<strong>Tec</strong> Work?<strong>Method</strong> Description
<strong>AQR</strong> <strong>Color</strong>-<strong>Tec</strong> <strong>Method</strong>Purge and AnalysisAmbient air entersthrough carbon filterTygonTubing<strong>Color</strong>imetricTubeHand-Operated VacuumPump (100cc)PumpHandleCarbonFilterAir FlowPurgeNeedle(long)Headspace(~30%)WaterSampleAirBubbles40 ml VOAVialPre-filtered ambient air ispurged through the sample,stripping the volatilecompounds into the headspacePCE MoleculesPump Stand
<strong>AQR</strong> <strong>Color</strong>-<strong>Tec</strong> <strong>Method</strong>Purge and AnalysisAmbient air entersthrough carbon filterTygonTubing<strong>Color</strong>imetricTubeHand-Operated VacuumPump (100cc)PumpHandleCarbonFilterPurgeNeedle(long)Headspace(~30%)WaterSampleAirBubbles40 ml VOAVialPurged volatile compounds passthrough the headspace, needle,and tubing into the colorimetrictube where they react and causea distinct color changePCE MoleculesPump Stand
<strong>AQR</strong> <strong>Color</strong>-<strong>Tec</strong> <strong>Method</strong> Detection LimitsConfidence of <strong>AQR</strong> <strong>Color</strong>-<strong>Tec</strong> zero valuesStatistical comparison of the zero <strong>AQR</strong> <strong>Color</strong>-<strong>Tec</strong> valuesto split-sample CG/MS analytical resultsat Anderson’s Cleaners Site:Mean = 0.362 µg/LRange = 0 to 2.55 µg/LStandard Deviation = 0.736 µg/L95% UCL of the mean = 0.857 µg/L90 th Percentile Value = 1.626 µg/L95 th Percentile Value = 2.370 µg/LPercentile less than 2.0 µg/L = 93.4 %
<strong>AQR</strong> <strong>Color</strong>-<strong>Tec</strong> <strong>Method</strong>Certified Training ProgramPart 3How is <strong>Color</strong>-<strong>Tec</strong> Used?<strong>Method</strong> Applications
<strong>AQR</strong> <strong>Color</strong>-<strong>Tec</strong> <strong>Method</strong> ApplicationsGroundwater ProfilingGroundwater Matrix Profiling (Residual Zone Mapping)Soil Matrix ProfilingField GC/MS SupportSource Area IdentificationSoil Removal SupportLong-Term Groundwater Remediation MonitoringPhytoremediation MonitoringSediment Pore Water AssessmentSoil Gas Surveys (<strong>Color</strong>imetric Gas Detection)Long-Term Soil Vapor Extraction Remediation Monitoring(<strong>Color</strong>imetric Gas Detection)
Collaborative Data ApproachSource-Area IdentificationStand-Alone “DefinitiveAnalysis” ApproachCollaborative Data ApproachThe low per-sample costallows <strong>for</strong> moresampling points.The secondary sourcearea is located.The increased samplingcoverage reducessampling uncertainty.Definitive analysis provides highanalytical accuracy, but samplingquantity is often limited tocontrol costsThis often results in data gapsand overall sampling uncertaintyand overall low data quality.The <strong>AQR</strong> <strong>Color</strong>-<strong>Tec</strong> datais used to focus thedefinitive analysismethods onto criticalareas.Combining <strong>AQR</strong> <strong>Color</strong>-<strong>Tec</strong> and laboratorysampling increasesoverall data quality byproviding improvedsampling coverage withhigh analytical accuracy.
Cost ComparisonConventional vs. Collaborative Data ApproachStand-Alone “DefinitiveAnalysis” ApproachCollaborative Data Approach48 <strong>AQR</strong> <strong>Color</strong>-<strong>Tec</strong> Samples($25 each)24 Laboratory Samples($100 each)6 LaboratorySamples($100 each)Total Cost = $2,400Total Cost = $1,800
Plume DelineationUsing Vertical ProfilingVertical ProfilingCollection of discrete samples at multiple depths and locations todefine the lateral and vertical extent of a contaminant plumeUsed with in-fieldsample analysis,the real-time dataallows <strong>for</strong> immediatedecisions regardingsubsequentlocations
Remediation and Monitoring In-field confirmation ofcleanup objectives Segregation of soils <strong>for</strong> varioustreatment options Reduce long term monitoringcosts by substituting <strong>Color</strong>-<strong>Tec</strong>analysis <strong>for</strong> laboratory analysis<strong>for</strong> selected sampling events
<strong>AQR</strong> <strong>Color</strong>-<strong>Tec</strong> <strong>Method</strong>Certified Training ProgramPart 4<strong>Method</strong> Procedures
Heating Samples and TubesHeating samples increases contaminant volatilityto maximize purge efficiency, while heating tubesincreases tube sensitivity. Set up water bath Maintain temperature at 104 o F Heat sample tubes using a VOAas a water bath Heat sample vials <strong>for</strong> about oneminute be<strong>for</strong>e analyzing
Water Sample Preparation Fill two VOA vials to ~75%capacity with water sample Seal VOA vials tightly Heat sample vials and tubeHeadspaceWater
Soil Sample PreparationHeadspace Place ~30 gram soil sample in vial Add water to ~75% capacity invial Seal VOA vials tightly Shake to mix soil and water Heat Sample vials and tubeWaterSoil
Carbon FilterThe carbon filter to prevents positive interferencefrom potential contaminants in ambient airBreak both ends of a carbon filter tube.Connect a carbon filter luer assembly to thecarbon filter tube.Attach the carbon filter assembly to a purgeneedle by inserting the carbon filter assemblyluer fitting into the purge needle luer fitting.The carbon filter is re-used <strong>for</strong> multiple purgecycles.
<strong>AQR</strong> <strong>Color</strong>-<strong>Tec</strong> <strong>Method</strong>Assembly DiagramTygonTubing<strong>Color</strong>imetricTubeHand-OperatedVacuum PumpPumpHandleCarbonFilterPurgeNeedleExtraction NeedleAssemblyHeadspace(~30%)WaterSamplePump Stand
Sample Purging <strong>Method</strong>ologySamples are purged using 50cc, 100cc, or 200ccvolumes.Refer to Section 7 of the <strong>Color</strong>-<strong>Tec</strong> Manual 50cc Purge Volume – Always start with 100cc Purge Volume – Not always needed 200cc Purge Volume – Low-level samples only
Reading The TubesRefer to Section 8 of the <strong>AQR</strong> <strong>Color</strong>-<strong>Tec</strong>Manual Very Low Concentrations Low to Medium Concentrations High Concentrations Recording Tube Readings Purge Volume Correction Factors
<strong>AQR</strong> <strong>Color</strong>-<strong>Tec</strong> <strong>Method</strong>Certified Training ProgramPart 5QA/QC Procedures
QA/QC ProceduresRefer to Section 11 of the <strong>AQR</strong> <strong>Color</strong>-<strong>Tec</strong> Manual <strong>Method</strong> Per<strong>for</strong>mance andAnalytical Confidence Negative Interference(Xylenes/Toluene) Positive Interference(Ambient Air) Duplicate Sample TestingProcedure
<strong>AQR</strong> <strong>Color</strong>-<strong>Tec</strong> <strong>Method</strong>Certified Training ProgramPart 6Data Interpretation
Estimating Sample ConcentrationsRefer to Section 9 of the <strong>AQR</strong> <strong>Color</strong>-<strong>Tec</strong> Manual<strong>Color</strong>-<strong>Tec</strong> ReadingEstimated Concentration (µg/L)0 ND5000High-end on M-Tube >20,000
Estimating Sample Concentrations Comparison of <strong>Color</strong>-<strong>Tec</strong> to GC/MS using dryclean siteinvestigation data (540 split sample pairs) <strong>Color</strong>-<strong>Tec</strong> zero values (240 samples):22% (13 samples) = Detected by GC/MS (below MCLs)78% (53 samples) = Not Detected by GC/MS The highest GC/MS concentrations undetected by <strong>Color</strong>-<strong>Tec</strong>were:GC/MS Concentration PCE – 3.0 TCE – 1.16 Cis 1,2-DCE – 2.75 Vinyl chloride – 1.0<strong>Color</strong>-<strong>Tec</strong> Range (µg/L) Quantity ofReadingData Pairs(N)LowHigh0 ND 3 2400.1 1 5 120.2 2 34 310.5-0.7 2 111 611 8 234 392 18 180 173 15 400 214-15 30 3300 2925-100 290 28000 39200-300 8930 61920 13Total Quantity of Data Pairs 502
Estimating Sample Concentrations
<strong>AQR</strong> <strong>Color</strong>-<strong>Tec</strong> <strong>Method</strong>Certified Training ProgramQuestions?E-mail Perry Kelso atpkelso@aqrcolortec.com