Uterine artery Doppler at 11 + 0 to 13 + 6 weeks and 21 + 0 to 24 + 6 ...
Uterine artery Doppler at 11 + 0 to 13 + 6 weeks and 21 + 0 to 24 + 6 ...
Uterine artery Doppler at 11 + 0 to 13 + 6 weeks and 21 + 0 to 24 + 6 ...

Create successful ePaper yourself
Turn your PDF publications into a flip-book with our unique Google optimized e-Paper software.
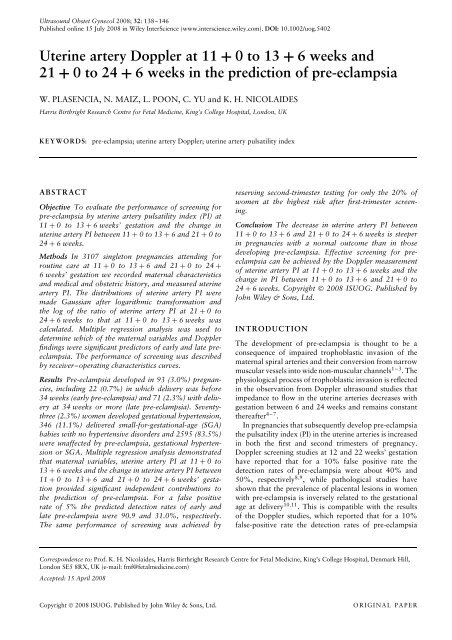
Ultrasound Obstet Gynecol 2008; 32: <strong>13</strong>8–146Published online 15 July 2008 in Wiley InterScience (www.interscience.wiley.com). DOI: 10.1002/uog.5402<strong>Uterine</strong> <strong>artery</strong> <strong>Doppler</strong> <strong>at</strong> <strong>11</strong> + 0<strong>to</strong><strong>13</strong>+ 6 <strong>weeks</strong> <strong>and</strong><strong>21</strong> + 0<strong>to</strong><strong>24</strong>+ 6 <strong>weeks</strong> in the prediction of pre-eclampsiaW. PLASENCIA, N. MAIZ, L. POON, C. YU <strong>and</strong> K. H. NICOLAIDESHarris Birthright Research Centre for Fetal Medicine, King’s College Hospital, London, UKKEYWORDS:pre-eclampsia; uterine <strong>artery</strong> <strong>Doppler</strong>; uterine <strong>artery</strong> puls<strong>at</strong>ility indexABSTRACTObjective To evalu<strong>at</strong>e the performance of screening forpre-eclampsia by uterine <strong>artery</strong> puls<strong>at</strong>ility index (PI) <strong>at</strong><strong>11</strong> + 0 <strong>to</strong> <strong>13</strong>+ 6 <strong>weeks</strong>’ gest<strong>at</strong>ion <strong>and</strong> the change inuterine <strong>artery</strong> PI between <strong>11</strong> + 0<strong>to</strong><strong>13</strong>+ 6 <strong>and</strong> <strong>21</strong> + 0<strong>to</strong><strong>24</strong> + 6 <strong>weeks</strong>.Methods In 3107 single<strong>to</strong>n pregnancies <strong>at</strong>tending forroutine care <strong>at</strong> <strong>11</strong> + 0 <strong>to</strong> <strong>13</strong>+ 6 <strong>and</strong> <strong>21</strong> + 0 <strong>to</strong> <strong>24</strong>+6 <strong>weeks</strong>’ gest<strong>at</strong>ion we recorded m<strong>at</strong>ernal characteristics<strong>and</strong> medical <strong>and</strong> obstetric his<strong>to</strong>ry, <strong>and</strong> measured uterine<strong>artery</strong> PI. The distributions of uterine <strong>artery</strong> PI weremade Gaussian after logarithmic transform<strong>at</strong>ion <strong>and</strong>the log of the r<strong>at</strong>io of uterine <strong>artery</strong> PI <strong>at</strong> <strong>21</strong> + 0 <strong>to</strong><strong>24</strong> + 6 <strong>weeks</strong> <strong>to</strong> th<strong>at</strong> <strong>at</strong> <strong>11</strong>+ 0 <strong>to</strong> <strong>13</strong>+ 6 <strong>weeks</strong> wascalcul<strong>at</strong>ed. Multiple regression analysis was used <strong>to</strong>determine which of the m<strong>at</strong>ernal variables <strong>and</strong> <strong>Doppler</strong>findings were significant predic<strong>to</strong>rs of early <strong>and</strong> l<strong>at</strong>e preeclampsia.The performance of screening was describedby receiver–oper<strong>at</strong>ing characteristics curves.Results Pre-eclampsia developed in 93 (3.0%) pregnancies,including 22 (0.7%) in which delivery was before34 <strong>weeks</strong> (early pre-eclampsia) <strong>and</strong> 71 (2.3%) with delivery<strong>at</strong> 34 <strong>weeks</strong> or more (l<strong>at</strong>e pre-eclampsia). Seventythree(2.3%) women developed gest<strong>at</strong>ional hypertension,346 (<strong>11</strong>.1%) delivered small-for-gest<strong>at</strong>ional-age (SGA)babies with no hypertensive disorders <strong>and</strong> 2595 (83.5%)were unaffected by pre-eclampsia, gest<strong>at</strong>ional hypertensionor SGA. Multiple regression analysis demonstr<strong>at</strong>edth<strong>at</strong> m<strong>at</strong>ernal variables, uterine <strong>artery</strong> PI <strong>at</strong> <strong>11</strong> + 0<strong>to</strong><strong>13</strong> + 6 <strong>weeks</strong> <strong>and</strong> the change in uterine <strong>artery</strong> PI between<strong>11</strong> + 0 <strong>to</strong> <strong>13</strong>+ 6 <strong>and</strong> <strong>21</strong> + 0 <strong>to</strong> <strong>24</strong>+ 6 <strong>weeks</strong>’ gest<strong>at</strong>ionprovided significant independent contributions <strong>to</strong>the prediction of pre-eclampsia. For a false positiver<strong>at</strong>e of 5% the predicted detection r<strong>at</strong>es of early <strong>and</strong>l<strong>at</strong>e pre-eclampsia were 90.9 <strong>and</strong> 31.0%, respectively.The same performance of screening was achieved byreserving second-trimester testing for only the 20% ofwomen <strong>at</strong> the highest risk after first-trimester screening.Conclusion The decrease in uterine <strong>artery</strong> PI between<strong>11</strong> + 0<strong>to</strong><strong>13</strong>+ 6 <strong>and</strong> <strong>21</strong> + 0<strong>to</strong><strong>24</strong>+ 6 <strong>weeks</strong> is steeperin pregnancies with a normal outcome than in thosedeveloping pre-eclampsia. Effective screening for preeclampsiacan be achieved by the <strong>Doppler</strong> measuremen<strong>to</strong>f uterine <strong>artery</strong> PI <strong>at</strong> <strong>11</strong> + 0<strong>to</strong><strong>13</strong>+ 6 <strong>weeks</strong> <strong>and</strong> thechange in PI between <strong>11</strong> + 0<strong>to</strong><strong>13</strong>+ 6 <strong>and</strong> <strong>21</strong> + 0<strong>to</strong><strong>24</strong> + 6 <strong>weeks</strong>. Copyright © 2008 ISUOG. Published byJohn Wiley & Sons, Ltd.INTRODUCTIONThe development of pre-eclampsia is thought <strong>to</strong> be aconsequence of impaired trophoblastic invasion of them<strong>at</strong>ernal spiral arteries <strong>and</strong> their conversion from narrowmuscular vessels in<strong>to</strong> wide non-muscular channels 1–3 .Thephysiological process of trophoblastic invasion is reflectedin the observ<strong>at</strong>ion from <strong>Doppler</strong> ultrasound studies th<strong>at</strong>impedance <strong>to</strong> flow in the uterine arteries decreases withgest<strong>at</strong>ion between 6 <strong>and</strong> <strong>24</strong> <strong>weeks</strong> <strong>and</strong> remains constantthereafter 4–7 .In pregnancies th<strong>at</strong> subsequently develop pre-eclampsi<strong>at</strong>he puls<strong>at</strong>ility index (PI) in the uterine arteries is increasedin both the first <strong>and</strong> second trimesters of pregnancy.<strong>Doppler</strong> screening studies <strong>at</strong> 12 <strong>and</strong> 22 <strong>weeks</strong>’ gest<strong>at</strong>ionhave reported th<strong>at</strong> for a 10% false positive r<strong>at</strong>e thedetection r<strong>at</strong>es of pre-eclampsia were about 40% <strong>and</strong>50%, respectively 8,9 , while p<strong>at</strong>hological studies haveshown th<strong>at</strong> the prevalence of placental lesions in womenwith pre-eclampsia is inversely rel<strong>at</strong>ed <strong>to</strong> the gest<strong>at</strong>ionalage <strong>at</strong> delivery 10,<strong>11</strong> . This is comp<strong>at</strong>ible with the resultsof the <strong>Doppler</strong> studies, which reported th<strong>at</strong> for a 10%false-positive r<strong>at</strong>e the detection r<strong>at</strong>es of pre-eclampsiaCorrespondence <strong>to</strong>: Prof. K. H. Nicolaides, Harris Birthright Research Centre for Fetal Medicine, King’s College Hospital, Denmark Hill,London SE5 8RX, UK (e-mail: fmf@fetalmedicine.com)Accepted: 15 April 2008Copyright © 2008 ISUOG. Published by John Wiley & Sons, Ltd.ORIGINAL PAPER
<strong>Uterine</strong> <strong>artery</strong> <strong>Doppler</strong> <strong>and</strong> pre-eclampsia <strong>13</strong>9requiring delivery before 34 <strong>weeks</strong> are about 80% <strong>and</strong>85% for assessment of the uterine arteries <strong>at</strong> 12 <strong>and</strong>22 <strong>weeks</strong>, respectively 8,9 .In a previous study of normal pregnancies we reported asignificant associ<strong>at</strong>ion in impedance <strong>to</strong> flow in the uterinearteries between the first <strong>and</strong> second trimesters 4 . Theaim of this screening study was <strong>to</strong> investig<strong>at</strong>e whetherthe r<strong>at</strong>e of decrease in PI between 12 <strong>and</strong> 22 <strong>weeks</strong>’gest<strong>at</strong>ion is steeper in pregnancies with a normal outcomethan in those developing pre-eclampsia, <strong>and</strong> if so whetherthis measurement could improve the prediction of preeclampsiaprovided by a single early assessment of theuterine arteries.PATIENTS AND METHODSThis was a prospective screening study for pre-eclampsiain single<strong>to</strong>n pregnancies by uterine <strong>artery</strong> <strong>Doppler</strong>ultrasonography <strong>at</strong> <strong>11</strong> + 0<strong>to</strong><strong>13</strong>+ 6 <strong>weeks</strong> <strong>and</strong> <strong>at</strong> <strong>21</strong> + 0<strong>to</strong> <strong>24</strong> + 6 <strong>weeks</strong>. Written informed consent was obtainedfrom the women agreeing <strong>to</strong> particip<strong>at</strong>e in the study,which was approved by the hospital ethics committee. Inour hospital women with single<strong>to</strong>n pregnancies <strong>at</strong>tendingfor routine anten<strong>at</strong>al care are offered one ultrasoundexamin<strong>at</strong>ion <strong>at</strong> <strong>11</strong> + 0 <strong>to</strong> <strong>13</strong>+ 6 <strong>weeks</strong>’ gest<strong>at</strong>ion <strong>and</strong>another <strong>at</strong> <strong>21</strong> + 0 <strong>to</strong> <strong>24</strong>+ 6 <strong>weeks</strong>. Gest<strong>at</strong>ional age isdetermined from the menstrual his<strong>to</strong>ry <strong>and</strong> confirmed bythe measurement of fetal crown–rump length (CRL) <strong>at</strong>the first-trimester scan.The women were asked <strong>to</strong> complete a questionnaire onm<strong>at</strong>ernal age, ethnic origin (Caucasian, Afro-Caribbean,Indian or Pakistani or Bangladeshi, Chinese or Japanese<strong>and</strong> mixed), cigarette smoking during pregnancy (yesor no), alcohol intake during pregnancy (yes or no),drug abuse during pregnancy (cannabis, cocaine, otheror none), medical his<strong>to</strong>ry (including chronic hypertension,diabetes mellitus, antiphospholipid syndrome,thrombophilia, human immunodeficiency virus infection,<strong>and</strong> sickle cell disease), medic<strong>at</strong>ion (including antihypertensive,antidepressant, anti-epileptic, anti-inflamm<strong>at</strong>ory,antiretroviral, antithyroid, aspirin, beta-mimetic, insulin,lithium, steroids <strong>and</strong> thyroxine), parity (nulliparous if nodelivery beyond 23 <strong>weeks</strong>, or parous), obstetric his<strong>to</strong>ry(including previous pregnancy with pre-eclampsia) <strong>and</strong>family his<strong>to</strong>ry of pre-eclampsia (mother). The m<strong>at</strong>ernalweight <strong>and</strong> height were measured <strong>and</strong> the body massindex (BMI) was calcul<strong>at</strong>ed in kg/m 2 .At <strong>11</strong> + 0<strong>to</strong><strong>13</strong>+ 6 <strong>weeks</strong> transabdominal ultrasoundexamin<strong>at</strong>ion was carried out for measurement of fetalCRL <strong>and</strong> nuchal translucency thickness, diagnosis of anymajor fetal defects <strong>and</strong> measurement of uterine <strong>artery</strong> PI.For the <strong>Doppler</strong> studies a sagittal section of the uterus wasobtained <strong>and</strong> the cervical canal <strong>and</strong> internal cervical oswere identified. Subsequently, the transducer was gentlytilted from side <strong>to</strong> side <strong>and</strong> color-flow mapping wasused <strong>to</strong> identify each uterine <strong>artery</strong> along the side ofthe cervix <strong>and</strong> uterus <strong>at</strong> the level of the internal os 12 .Pulsed wave <strong>Doppler</strong> was used with the sampling g<strong>at</strong>e set<strong>at</strong> 2 mm <strong>to</strong> cover the whole vessel <strong>and</strong> care was taken<strong>to</strong> ensure th<strong>at</strong> the angle of inson<strong>at</strong>ion was less than50 ◦ . When three similar consecutive waveforms wereobtained the PI was measured <strong>and</strong> the mean PI of theleft <strong>and</strong> right arteries was calcul<strong>at</strong>ed. Similarly, pulsed<strong>Doppler</strong> was used <strong>to</strong> measure the mean PI <strong>at</strong> <strong>21</strong> + 0<strong>to</strong><strong>24</strong> + 6 <strong>weeks</strong>. However, <strong>at</strong> this scan transvaginal, r<strong>at</strong>herthan transabdominal, sonography was used because <strong>at</strong> thesame time we measured cervical length for the assessmen<strong>to</strong>f the risk of prem<strong>at</strong>ure delivery. All <strong>Doppler</strong> studieswere carried out by sonographers who had receivedthe Certific<strong>at</strong>e of Competence in <strong>Doppler</strong> of the FetalMedicine Found<strong>at</strong>ion (www.fetalmedicine.com).The ultrasound findings <strong>and</strong> p<strong>at</strong>ient characteristics,including demographic d<strong>at</strong>a <strong>and</strong> obstetric <strong>and</strong> medicalhis<strong>to</strong>ry, were entered in<strong>to</strong> a computer d<strong>at</strong>abase. D<strong>at</strong>aon pregnancy outcome were collected from the hospitalm<strong>at</strong>ernity records or their general medical practitioners.The obstetric records of all p<strong>at</strong>ients with pre-existingor pregnancy-associ<strong>at</strong>ed hypertension were examined <strong>to</strong>determine if the condition was chronic hypertension,pre-eclampsia or gest<strong>at</strong>ional hypertension. Similarly, forquality control we examined the records of 500 r<strong>and</strong>omlyselected cases without pregnancy-associ<strong>at</strong>ed hypertension.Outcome measuresThe outcome measures were pre-eclampsia, gest<strong>at</strong>ionalhypertension <strong>and</strong> small-for-gest<strong>at</strong>ional-age (SGA) babies.In pre-eclampsia <strong>and</strong> gest<strong>at</strong>ional hypertension we includedall cases with SGA, but in SGA we excluded caseswith pre-eclampsia or gest<strong>at</strong>ional hypertension. Thegroup of pre-eclampsia included those with pre-eclampsiasuperimposed on chronic hypertension.The definitions of pre-eclampsia <strong>and</strong> gest<strong>at</strong>ionalhypertension were those of the Intern<strong>at</strong>ional Society forthe Study of Hypertension in Pregnancy <strong>13</strong> . Gest<strong>at</strong>ionalhypertension is defined as dias<strong>to</strong>lic blood pressure≥ 90 mmHg on <strong>at</strong> least two occasions 4 h apartdeveloping after 20 <strong>weeks</strong> of gest<strong>at</strong>ion in previouslynormotensive women in the absence of significantproteinuria. Pre-eclampsia is defined as gest<strong>at</strong>ionalhypertension with proteinuria of 300 mg or more in<strong>24</strong> h or two readings of <strong>at</strong> least ++ on dipstick analysisof midstream or c<strong>at</strong>heter urine specimens if no <strong>24</strong>-hcollection is available. Chronic hypertension is defined as ahis<strong>to</strong>ry of hypertension before conception or the presenceof hypertension <strong>at</strong> the booking visit before 20 <strong>weeks</strong> ofgest<strong>at</strong>ion in the absence of trophoblastic disease, <strong>and</strong> preeclampsiasuperimposed on chronic hypertension requiresthe development of significant proteinuria (as definedabove) after 20 <strong>weeks</strong> of gest<strong>at</strong>ion in women with knownchronic hypertension <strong>13</strong> .For all the babies the birth weight was converted in<strong>to</strong> apercentile after correction for gest<strong>at</strong>ional age <strong>at</strong> delivery<strong>and</strong> sex of the newborn, m<strong>at</strong>ernal ethnic origin, weight,height <strong>and</strong> parity 14 . The newborn was considered <strong>to</strong> beSGA if the birth weight was less than the 10 th percentile.Copyright © 2008 ISUOG. Published by John Wiley & Sons, Ltd. Ultrasound Obstet Gynecol 2008; 32: <strong>13</strong>8–146.
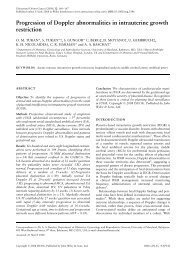
140 Plasencia et al.St<strong>at</strong>istical analysisThe following seven steps were taken:1) The women were subdivided in<strong>to</strong> five groupsdepending on pregnancy outcome: early pre-eclampsia;l<strong>at</strong>e pre-eclampsia; gest<strong>at</strong>ional hypertension; SGA; <strong>and</strong>unaffected by pre-eclampsia, gest<strong>at</strong>ional hypertension,or SGA. The ANOVA test (with the Bonferronipost-hoc test) <strong>and</strong> the chi-square test were used<strong>to</strong> compare the demographic characteristics of theunaffected group with each group with pregnancycomplic<strong>at</strong>ions.2) The distributions of uterine <strong>artery</strong> PI were madeGaussian after logarithmic transform<strong>at</strong>ion <strong>and</strong> thenormality of the distributions was confirmed by theKolmogorov–Smirnov test.3) Linear regression analysis was used <strong>to</strong> adjust theuterine <strong>artery</strong> PI <strong>to</strong> gest<strong>at</strong>ional age.4) The distribution of log uterine <strong>artery</strong> PI, expressed asmultiples of the median (MoM) were determined ineach of the outcome groups <strong>and</strong> ‘box-<strong>and</strong>-whisker’plots were constructed.5) The log r<strong>at</strong>io of uterine <strong>artery</strong> PI MoMs <strong>at</strong> <strong>21</strong> + 0<strong>to</strong><strong>24</strong> + 6<strong>weeks</strong><strong>to</strong>PIMoMs<strong>at</strong><strong>11</strong>+ 0<strong>to</strong><strong>13</strong>+ 6 <strong>weeks</strong>was calcul<strong>at</strong>ed <strong>and</strong> box-<strong>and</strong>-whisker plots wereconstructed for each outcome group.6) Backward stepwise multiple regression analysis wasused <strong>to</strong> determine which of the fac<strong>to</strong>rs amongthe m<strong>at</strong>ernal characteristics, medical <strong>and</strong> obstetrichis<strong>to</strong>ry (Table 1) <strong>and</strong> <strong>Doppler</strong> findings were significantpredic<strong>to</strong>rs of early <strong>and</strong> l<strong>at</strong>e pre-eclampsia.7) The performance of screening was described by areceiver–oper<strong>at</strong>ing characteristics (ROC) curve.The st<strong>at</strong>istical software package SPSS 12.0 (SPSS Inc.,Chicago, IL, USA) was used for all d<strong>at</strong>a analysis.RESULTSStudy popul<strong>at</strong>ionFirst- <strong>and</strong> second-trimester <strong>Doppler</strong> screening was carriedout in 3330 consecutive single<strong>to</strong>n pregnancies <strong>at</strong> mediangest<strong>at</strong>ions of 12 <strong>and</strong> 23 <strong>weeks</strong>. We excluded 187 (5.6%)because they had missing outcome d<strong>at</strong>a (n = 155), therewas a major fetal defect (n = 14), or the pregnanciesresulted in miscarriage or fetal de<strong>at</strong>h (n = 18). In addition,there were 36 (1.1%) pregnancies in which there was <strong>at</strong>least one episode of hypertension but on the basis of theavailable d<strong>at</strong>a it was not possible <strong>to</strong> determine whetherthe diagnosis was pre-eclampsia, gest<strong>at</strong>ional hypertensionor neither, so these cases were also excluded from furtheranalysis.In the remaining 3107 cases there were 93 (3.0%)who developed pre-eclampsia, including 22 (0.7%)in which delivery was before 34 <strong>weeks</strong> (early preeclampsia)<strong>and</strong> 71 (2.3%) with delivery <strong>at</strong> 34 <strong>weeks</strong>or l<strong>at</strong>er (l<strong>at</strong>e pre-eclampsia), 73 (2.3%) who developedgest<strong>at</strong>ional hypertension, 346 (<strong>11</strong>.1%) who delivered SGAnewborns but did not develop pre-eclampsia or gest<strong>at</strong>ionalhypertension <strong>and</strong> 2595 (83.5%) who were unaffectedby pre-eclampsia, gest<strong>at</strong>ional hypertension or SGA. Thecharacteristics of the five outcome groups are summarizedin Table 1. In the quality-control assessment of the 500cases with reported normal outcome there was one caseof gest<strong>at</strong>ional hypertension.Log uterine <strong>artery</strong> PIAt <strong>11</strong> + 0<strong>to</strong><strong>13</strong>+ 6 <strong>weeks</strong> the mean log uterine <strong>artery</strong>PI decreased significantly with gest<strong>at</strong>ion (log uterine<strong>artery</strong> PI = 0.438 − (0.003 × gest<strong>at</strong>ional age in days),R 2 = 0.06, P < 0.0001). Similarly, <strong>at</strong> <strong>21</strong> + 0 <strong>to</strong> <strong>24</strong>+6 <strong>weeks</strong> the mean log uterine <strong>artery</strong> PI decreased significantlywith gest<strong>at</strong>ion (log uterine <strong>artery</strong> PI = 0.268 −(0.002 × gest<strong>at</strong>ional age in days), R 2 = 0.02, P = 0.007).In each p<strong>at</strong>ient the observed log uterine <strong>artery</strong> PIwas expressed as a multiple of the expected medianfor gest<strong>at</strong>ion. The median (interquartile range) loguterine <strong>artery</strong> PI <strong>at</strong> <strong>11</strong> + 0 <strong>to</strong> <strong>13</strong>+ 6 <strong>weeks</strong> was−0.004 (−0.082 <strong>to</strong> 0.081) MoM in the unaffectedgroup, 0.175 (0.155 <strong>to</strong> 0.227) MoM in the early preeclampsiagroup, 0.051 (−0.040 <strong>to</strong> 0.153) MoM inthe l<strong>at</strong>e pre-eclampsia group, 0.014 (−0.090 <strong>to</strong> 0.079)MoM in the gest<strong>at</strong>ional hypertension group <strong>and</strong> 0.029(−0.058 <strong>to</strong> 0.1<strong>24</strong>) MoM in the SGA group (Figure 1).Therefore, compared <strong>to</strong> the unaffected group, the meanlog uterine <strong>artery</strong> PI was significantly higher in theearly pre-eclampsia group (P < 0.001), in the l<strong>at</strong>e preeclampsiagroup (P = 0.040) <strong>and</strong> in the SGA group(P < 0.001), but not in the gest<strong>at</strong>ional hypertension group(P = 0.779).The median (interquartile range) log uterine <strong>artery</strong> PI<strong>at</strong> <strong>21</strong> + 0<strong>to</strong><strong>24</strong>+ 6 <strong>weeks</strong> was −0.008 (−0.079 <strong>to</strong> 0.059)MoM in the unaffected group, 0.253 (0.165 <strong>to</strong> 0.351)MoM in the early pre-eclampsia group, 0.068 (−0.052<strong>to</strong> 0.172) MoM in the l<strong>at</strong>e pre-eclampsia group, 0.003(−0.048 <strong>to</strong> 0.059) MoM in the gest<strong>at</strong>ional hypertensiongroup <strong>and</strong> 0.036 (−0.041 <strong>to</strong> 0.<strong>11</strong>0) MoM in the SGAgroup (Figure 1). Therefore, compared <strong>to</strong> the unaffectedgroup the mean log uterine <strong>artery</strong> PI was significantlyhigher in the early pre-eclampsia group (P < 0.001), in thel<strong>at</strong>e pre-eclampsia group (P < 0.001), in the gest<strong>at</strong>ionalhypertension group (P = 0.037) <strong>and</strong> in the SGA group(P < 0.001).Log r<strong>at</strong>io of uterine <strong>artery</strong> PI <strong>at</strong> <strong>21</strong> + 0<strong>to</strong><strong>24</strong>+ 6 <strong>weeks</strong><strong>to</strong> PI <strong>at</strong> <strong>11</strong> + 0<strong>to</strong><strong>13</strong>+ 6 <strong>weeks</strong>In each p<strong>at</strong>ient the log r<strong>at</strong>io was calcul<strong>at</strong>ed:log r<strong>at</strong>io (uterine <strong>artery</strong> PI <strong>at</strong> <strong>21</strong> + 0<strong>to</strong><strong>24</strong>+ 6 <strong>weeks</strong> inMoMs/uterine <strong>artery</strong> PI <strong>at</strong> <strong>11</strong> + 0 <strong>to</strong> <strong>13</strong>+ 6<strong>weeks</strong>in MoMs) = log uterine <strong>artery</strong> PI <strong>at</strong> <strong>21</strong> + 0 <strong>to</strong><strong>24</strong> + 6 <strong>weeks</strong> in MoMs − log uterine <strong>artery</strong> PI <strong>at</strong><strong>11</strong> + 0<strong>to</strong><strong>13</strong>+ 6<strong>weeks</strong>inMoMs.The median (interquartile range) log r<strong>at</strong>io of uterine<strong>artery</strong> PI was −0.006 (−0.080 <strong>to</strong> 0.071) MoM in theCopyright © 2008 ISUOG. Published by John Wiley & Sons, Ltd. Ultrasound Obstet Gynecol 2008; 32: <strong>13</strong>8–146.
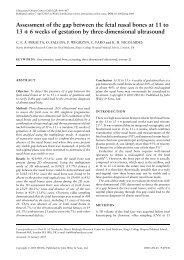
<strong>Uterine</strong> <strong>artery</strong> <strong>Doppler</strong> <strong>and</strong> pre-eclampsia 141Table 1 M<strong>at</strong>ernal characteristics <strong>and</strong> medical <strong>and</strong> obstetric his<strong>to</strong>ry in the unaffected, early pre-eclampsia, l<strong>at</strong>e pre-eclampsia, gest<strong>at</strong>ionalhypertension <strong>and</strong> small-for-gest<strong>at</strong>ional-age groupsCharacteristicUnaffected(n = 2595)Earlypre-eclampsia(n = 22)L<strong>at</strong>epre-eclampsia(n = 71)Gest<strong>at</strong>ionalhypertension(n = 73)Small-forgest<strong>at</strong>ionalage(n = 346)M<strong>at</strong>ernal age (years) 31.1 (16.2–49.6) 29.1 (17.6–39.7) 31.1 (18.8–41.9) 32.8 (17.3–46.4) 30.8 (16.0–46.0)Body mass index (kg/m 2 ) 25.6 (15.8–59.2) 27.1 (18.7–38.1) 28.8 (19.2–46.4)* 28.4 (20.4–53.9)* 26.1 (15.8–45.8)Crown–rump length (mm) 63.8 (45.0–84.0) 67.3 (52.0–84.0) 63.5 (46.0–81.4) 63.3 (50.0–84.0) 62.5 (45.6–84.0)*EthnicityCaucasian 1441 (55.5) 6 (27.3)* <strong>24</strong> (33.8)* 48 (65.8) 174 (50.3)Afro-Caribbean 856 (33.0) 15 (68.2)* 39 (54.9)* <strong>21</strong> (28.8) 143 (41.3)*Indian or Pakistani 142 (5.5) — 2 (2.8) — 8 (2.3)*Chinese or Japanese 41 (1.6) — 2 (2.8) 1 (1.4) 3 (0.9)Mixed <strong>11</strong>5 (4.4) 1 (4.5) 4 (5.6) 3 (4.1) 18 (5.2)ParityNulliparous 1266 (48.8) 12 (54.5) 44 (62.0)* 43 (58.9) 182 (52.6)Parous/no previous pre-eclampsia 1263 (48.7) 5 (22.7)* 16 (22.5)* 23 (31.5)* 159 (46.0)Parous/previous pre-eclampsia 66 (2.5) 5 (22.7)* <strong>11</strong> (15.5)* 7 (9.6)* 5 (1.4)Cigarette smoker 183 (7.1) — 5 (7.0) 5 (6.8) 50 (14.5)*Alcohol drinker 26 (1.0) — 1 (1.4) 1 (1.4) 3 (0.9)Drug abuser 12 (0.5) — — 1 (1.4) 3 (0.9)Family his<strong>to</strong>ry of pre-eclampsia (mother) 87 (3.4) 3 (<strong>13</strong>.6)* 9 (12.7)* 8 (<strong>11</strong>.0)* 18 (5.2)ConceptionSpontaneous <strong>24</strong>87 (95.8) 18 (81.8)* 67 (94.4) 71 (97.3) 322 (93.1)*Ovul<strong>at</strong>ion drugs 77 (3.0) 4 (18.2)* 3 (4.2) — 17 (4.9)In-vitro fertiliz<strong>at</strong>ion 31 (1.2) — 1 (1.4) 2 (2.7) 7 (2.0)Medical his<strong>to</strong>ryNone 2533 (97.6) 19 (86.4)* 68 (95.8) 72 (98.6) 329 (95.1)*Chronic hypertension 23 (0.9) 3 (<strong>13</strong>.6)* 3 (4.2)* — 8 (2.3)*Diabetes mellitus <strong>13</strong> (0.5) — — 1 (1.4) 1 (0.3)Antiphospholipid syndrome 2 (0.1) — — — 1 (0.3)Thrombophilia 14 (0.5) — — — 3 (0.9)Sickle cell disease 5 (0.2) — — — 2 (0.6)Human immunodeficiency viral 5 (0.2) — — — 2 (0.6)infectionMedic<strong>at</strong>ion during pregnancyNone <strong>24</strong><strong>24</strong> (93.4) 19 (86.4) 65 (91.5) 65 (89.0) 306 (88.4)*Antihypertensive 18 (0.7) 2 (9.1)* 1 (1.4) — 7 (2.0)*Insulin 12 (0.5) — — 1 (1.4) 2 (0.6)Steroid 3 (0.1) 1 (4.5)* — — —β-mimetic 32 (1.2) — 3 (4.2) 1 (1.4) 7 (2.0)Combined asthma medic<strong>at</strong>ion 25 (1.0) — 1 (1.4) 2 (2.7) 9 (2.6)*Thyroxine 28 (1.1) — — 2 (2.7) 3 (0.9)Aspirin 25 (1.0) — — 1 (1.4) 7 (2.0)Antithyroid 2 (0.1) — — — —Anti-epileptic 7 (0.3) — — 1 (1.4) —Lithium 3 (0.1) — — — —Antidepressant 12 (0.5) — 1 (1.4) — 3 (0.9)Antiretroviral 3 (0.1) — — — 2 (0.6)Anti-inflamm<strong>at</strong>ory 1 (0.0) — — — —Values are mean (range) or n (%). *St<strong>at</strong>istically significant differences between uncomplic<strong>at</strong>ed pregnancies <strong>and</strong> the disease groups.unaffected group, 0.082 (0.018 <strong>to</strong> 0.171) MoM in theearly pre-eclampsia group, −0.005 (−0.059 <strong>to</strong> 0.104)MoM in the l<strong>at</strong>e pre-eclampsia group, 0.0<strong>13</strong> (−0.045<strong>to</strong> 0.089) MoM in the gest<strong>at</strong>ional hypertension group<strong>and</strong> 0.0<strong>11</strong> (−0.053 <strong>to</strong> 0.090) MoM in the SGA group(Figure 2). Therefore, compared <strong>to</strong> the unaffected group,the mean log r<strong>at</strong>io of uterine <strong>artery</strong> PI was significantlyhigher in the early pre-eclampsia group (P < 0.001), in thel<strong>at</strong>e pre-eclampsia group (P = 0.0<strong>24</strong>), in the gest<strong>at</strong>ionalhypertension group (P = 0.039) <strong>and</strong> in the SGA group(P = 0.001).Prediction of pre-eclampsiaThe risk of developing pre-eclampsia is calcul<strong>at</strong>ed fromthe formula: risk = odds/(1 + odds), where odds = e Y<strong>and</strong> Y is derived from the multiple regression analysisof m<strong>at</strong>ernal characteristics, medical <strong>and</strong> obstetric his<strong>to</strong>ry<strong>and</strong> uterine <strong>artery</strong> PI <strong>at</strong> <strong>11</strong> + 0<strong>to</strong><strong>13</strong>+ 6 <strong>weeks</strong>:Early pre-eclampsia: Y =−6.546 + (3.769 if the p<strong>at</strong>ienthad chronic hypertension, 0 if she did not) + (15.692×uterine <strong>artery</strong> PI (log MoM)); R 2 = 0.254, P < 0.001.L<strong>at</strong>e pre-eclampsia: Y=−6.140+(0.082 × BMI) + 0.8<strong>13</strong>if the p<strong>at</strong>ient is Afro-Caribbean + (0 if nulliparous,Copyright © 2008 ISUOG. Published by John Wiley & Sons, Ltd. Ultrasound Obstet Gynecol 2008; 32: <strong>13</strong>8–146.
142 Plasencia et al.(a)0.6(b)0.6<strong>Uterine</strong> <strong>artery</strong> PI <strong>at</strong> <strong>11</strong> + 0 <strong>to</strong> <strong>13</strong> + 6 <strong>weeks</strong> (log MoM)0.40.20.0−0.2−0.4<strong>Uterine</strong> <strong>artery</strong> PI <strong>at</strong> <strong>21</strong> + 0 <strong>to</strong> <strong>24</strong> + 6 <strong>weeks</strong> (log MoM)0.40.20.0−0.2−0.4−0.6−0.6UnaffectedEarlyPEL<strong>at</strong>ePEGHSGAUnaffectedEarlyPEL<strong>at</strong>ePEGHSGAFigure 1 Box-<strong>and</strong>-whisker plots (median, 25 th <strong>and</strong> 75 th centiles <strong>and</strong> range) of log multiples of the median (MoM) uterine <strong>artery</strong> puls<strong>at</strong>ilityindex (PI) in the unaffected pregnancies <strong>and</strong> in those complic<strong>at</strong>ed by early <strong>and</strong> l<strong>at</strong>e pre-eclampsia (PE), gest<strong>at</strong>ional hypertension (GH) <strong>and</strong>delivery of small-for-gest<strong>at</strong>ional-age (SGA) newborns, <strong>at</strong> <strong>11</strong> + 0 <strong>to</strong> <strong>13</strong> + 6 <strong>weeks</strong>’ gest<strong>at</strong>ion (a) <strong>and</strong> <strong>at</strong> <strong>21</strong> + 0 <strong>to</strong> <strong>24</strong> + 6 <strong>weeks</strong> (b).Log r<strong>at</strong>io uterine <strong>artery</strong> PI0.40.20.0−0.2−0.4UnaffectedEarlyPEL<strong>at</strong>ePEGHSGAFigure 2 Box-<strong>and</strong>-whisker plots (median, 25 th <strong>and</strong> 75 th centiles <strong>and</strong>range) of log r<strong>at</strong>io of uterine <strong>artery</strong> puls<strong>at</strong>ility index (PI) <strong>at</strong> <strong>21</strong> + 0<strong>to</strong> <strong>24</strong> + 6 <strong>weeks</strong> <strong>to</strong> PI <strong>at</strong> <strong>11</strong> + 0 <strong>to</strong> <strong>13</strong> + 6 <strong>weeks</strong> in the unaffectedpregnancies <strong>and</strong> in those complic<strong>at</strong>ed by early <strong>and</strong> l<strong>at</strong>epre-eclampsia (PE), gest<strong>at</strong>ional hypertension (GH) <strong>and</strong> delivery ofsmall-for-gest<strong>at</strong>ional-age (SGA) newborns.−1.234 if parous with no previous his<strong>to</strong>ry of preeclampsia,+ 0.922 if parous with a previous his<strong>to</strong>ryof pre-eclampsia) + 1.049 if p<strong>at</strong>ient’s mother had preeclampsia+ (2.198 × uterine <strong>artery</strong> PI (log MoM));R 2 = 0.123, P < 0.001.Multiple regression analysis demonstr<strong>at</strong>ed th<strong>at</strong> the r<strong>at</strong>ioof uterine <strong>artery</strong> PI <strong>at</strong> <strong>21</strong> + 0 <strong>to</strong> <strong>24</strong>+ 6 <strong>weeks</strong> <strong>to</strong> thePI <strong>at</strong> <strong>11</strong> + 0<strong>to</strong><strong>13</strong>+ 6 <strong>weeks</strong> improved significantly theprediction of pre-eclampsia:Early pre-eclampsia: Y =−7.753 − (1.328 if parouswithout a previous his<strong>to</strong>ry of pre-eclampsia <strong>and</strong> 0if nulliparous or parous with a previous his<strong>to</strong>ry ofpre-eclampsia) + (3.633 if the p<strong>at</strong>ient had chronichypertension, 0 if she did not) + (<strong>24</strong>.644 × uterine<strong>artery</strong> PI <strong>at</strong> <strong>11</strong> + 0<strong>to</strong><strong>13</strong>+ 6 <strong>weeks</strong> (log MoM)) +(<strong>21</strong>.068 × log r<strong>at</strong>io uterine <strong>artery</strong> PI); R 2 = 0.540,P < 0.001.L<strong>at</strong>e pre-eclampsia: Y =−5.952 + (0.07 × BMI) + 0.792if the p<strong>at</strong>ient is Afro-Caribbean + (0 if nulliparous,−1.<strong>24</strong>5 if parous with no previous his<strong>to</strong>ry of preeclampsia,+ 0.827 if parous with a previous his<strong>to</strong>ryof pre-eclampsia) + 1.0 if p<strong>at</strong>ient’s mother had preeclampsia+ (4.504 × uterine <strong>artery</strong> PI (log MoM))+ (4.410 × log r<strong>at</strong>io uterine <strong>artery</strong> PI); R 2 = 0.142,P < 0.001.Examples of the calcul<strong>at</strong>ion of p<strong>at</strong>ient-specific riskIn a nulliparous Caucasian woman with a BMI of20 kg/m 2 , without chronic hypertension <strong>and</strong> no familyhis<strong>to</strong>ry of pre-eclampsia, <strong>at</strong> 12 + 6 <strong>weeks</strong> the mean uterine<strong>artery</strong> PI is 2.4.<strong>Uterine</strong> <strong>artery</strong> PI MoMs (12 + 6 <strong>weeks</strong>):• log observed uterine <strong>artery</strong> PI = 0.380Copyright © 2008 ISUOG. Published by John Wiley & Sons, Ltd. Ultrasound Obstet Gynecol 2008; 32: <strong>13</strong>8–146.
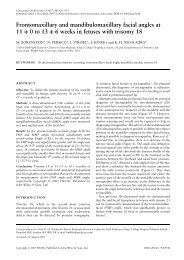
144 Plasencia et al.Table 2 Performance of screening for early <strong>and</strong> l<strong>at</strong>e pre-eclampsia, by uterine <strong>artery</strong> puls<strong>at</strong>ility index (PI) <strong>at</strong> <strong>11</strong> + 0 <strong>to</strong> <strong>13</strong> + 6 <strong>weeks</strong> alone,combined with m<strong>at</strong>ernal fac<strong>to</strong>rs, <strong>and</strong> with the r<strong>at</strong>io of uterine <strong>artery</strong> PI between <strong>11</strong> + 0 <strong>and</strong> <strong>13</strong> + 6 <strong>weeks</strong> <strong>and</strong> between <strong>21</strong> + 0 <strong>and</strong><strong>24</strong> + 6 <strong>weeks</strong>Performance of screening test Early pre-eclampsia L<strong>at</strong>e pre-eclampsiaArea under receiver–oper<strong>at</strong>ing characteristics curve (mean (95% CI))<strong>Uterine</strong> <strong>artery</strong> PI <strong>at</strong> <strong>11</strong> + 0 <strong>to</strong> <strong>13</strong> + 6 <strong>weeks</strong> 0.872 (0.781–0.962) 0.590 (0.5<strong>13</strong>–0.668)<strong>Uterine</strong> <strong>artery</strong> PI <strong>at</strong> <strong>11</strong> + 0 <strong>to</strong> <strong>13</strong> + 6 <strong>weeks</strong> <strong>and</strong> his<strong>to</strong>ry 0.931 (0.904–0.958) 0.779 (0.726–0.832)Combined screening including r<strong>at</strong>io 0.983 (0.972–0.993) 0.783 (0.729–0.837)Detection r<strong>at</strong>e for 5% false-positive r<strong>at</strong>e (% (95% CI))<strong>Uterine</strong> <strong>artery</strong> PI <strong>at</strong> <strong>11</strong> + 0 <strong>to</strong> <strong>13</strong> + 6 <strong>weeks</strong> 45.5 (<strong>24</strong>.4–67.8) 15.5 (8.0–26.0)<strong>Uterine</strong> <strong>artery</strong> PI <strong>at</strong> <strong>11</strong> + 0 <strong>to</strong> <strong>13</strong> + 6 <strong>weeks</strong> <strong>and</strong> his<strong>to</strong>ry 45.5 (<strong>24</strong>.4–67.8) 31.0 (20.5–43.1)Combined screening including r<strong>at</strong>io 90.9 (70.8–98.6) 31.0 (20.5–43.1)Detection r<strong>at</strong>e for 10% false-positive r<strong>at</strong>e (% (95% CI))<strong>Uterine</strong> <strong>artery</strong> PI <strong>at</strong> <strong>11</strong> + 0 <strong>to</strong> <strong>13</strong> + 6 <strong>weeks</strong> 77.3 (54.6–92.1) 26.8 (16.9–38.6)<strong>Uterine</strong> <strong>artery</strong> PI <strong>at</strong> <strong>11</strong> + 0 <strong>to</strong> <strong>13</strong> + 6 <strong>weeks</strong> <strong>and</strong> his<strong>to</strong>ry 77.3 (54.6–92.1) 42.3 (30.6–54.6)Combined screening including r<strong>at</strong>io 100 (84.4–100) 46.5 (34.5–58.7)(a) 100908070(b) 100908070Detection r<strong>at</strong>e (%)605040Detection r<strong>at</strong>e (%)605040303020201010000 10 20 30 40 50 60 70 80 90 100 0 10 20 30 40 50 60 70 80 90 100False-positive r<strong>at</strong>e (%)False-positive r<strong>at</strong>e (%)Figure 3 Detection <strong>and</strong> false-positive r<strong>at</strong>es in screening for early (a) <strong>and</strong> l<strong>at</strong>e (b) pre-eclampsia by uterine <strong>artery</strong> puls<strong>at</strong>ility index (PI) <strong>at</strong><strong>11</strong> + 0 <strong>to</strong> <strong>13</strong> + 6 <strong>weeks</strong> ( ......), m<strong>at</strong>ernal fac<strong>to</strong>rs <strong>and</strong> uterine <strong>artery</strong> PI <strong>at</strong> <strong>11</strong> + 0 <strong>to</strong> <strong>13</strong> + 6 <strong>weeks</strong> (- - - - ), <strong>and</strong> m<strong>at</strong>ernal fac<strong>to</strong>rs, uterine<strong>artery</strong> PI <strong>at</strong> <strong>11</strong> + 0 <strong>to</strong> <strong>13</strong> + 6 <strong>weeks</strong> <strong>and</strong> the r<strong>at</strong>io of uterine <strong>artery</strong> PI <strong>at</strong> <strong>21</strong> + 0 <strong>to</strong> <strong>24</strong> + 6 <strong>weeks</strong> <strong>to</strong> the PI <strong>at</strong> <strong>11</strong> + 0 <strong>to</strong> <strong>13</strong> + 6 <strong>weeks</strong> ( ).Table 3 Detection r<strong>at</strong>e of second-trimester <strong>Doppler</strong> ultrasound in those cases with risk above the cut-off after first-trimester assessment withhis<strong>to</strong>ry <strong>and</strong> uterine <strong>artery</strong> <strong>Doppler</strong>Detection r<strong>at</strong>e (95% CI)Early pre-eclampsiaL<strong>at</strong>e pre-eclampsiaCut-off False-positive r<strong>at</strong>e 5% False-positive r<strong>at</strong>e 10% False-positive r<strong>at</strong>e 5% False-positive r<strong>at</strong>e 10%95 th centile 68.2 (45.1–86.1) 90.9 (70.8–98.6) 26.8 (16.9–38.6) 40.8 (29.3–53.2)90 th centile 86.4 (65.1–96.9) 86.4 (65.1–96.9) 29.6 (19.3–41.6) 40.8 (29.3–53.2)85 th centile 86.4 (65.1–96.9) 90.9 (70.8–98.6) 29.6 (19.3–41.6) 42.3 (30.6–54.6)80 th centile 90.9 (70.8–98.6) 95.5 (77.1–99.2) 29.6 (19.3–41.6) 43.7 (31.9–56.0)50 th centile 90.9 (70.8–98.6) 100 (84.4–100) 31.0 (20.5–43.1) 46.5 (34.5–58.7)All 90.9 (70.8–98.6) 100 (84.4–100) 31.0 (20.5–43.1) 46.5 (34.5–58.7)Copyright © 2008 ISUOG. Published by John Wiley & Sons, Ltd. Ultrasound Obstet Gynecol 2008; 32: <strong>13</strong>8–146.
146 Plasencia et al.9. Yu CK, Smith GCS, Papageorghiou AT, Cacho AM, NicolaidesKH. An integr<strong>at</strong>ed model for the prediction of preeclampsiausing m<strong>at</strong>ernal fac<strong>to</strong>rs <strong>and</strong> uterine <strong>artery</strong> <strong>Doppler</strong>velocimetry in unselected low-risk women. Am J Obstet Gynecol2005; 193: 429–436.10. Moldenhauer JS, Stanek J, Warshak C, Khoury J, Sibai B. Thefrequency <strong>and</strong> severity of placental findings in women with preeclampsiaare gest<strong>at</strong>ional age dependent. Am J Obstet Gynecol2003; 189: <strong>11</strong>73–<strong>11</strong>77.<strong>11</strong>. Egbor M, Ansari T, Morris N, Green CJ, Sibbons PD. Morphometricplacental villous <strong>and</strong> vascular abnormalities in early<strong>and</strong>l<strong>at</strong>e-onset pre-eclampsia with <strong>and</strong> without fetal growthrestriction. BJOG 2006; <strong>11</strong>3: 580–589.12. Martin AM, Bindra R, Curcio P, Cicero S, Nicolaides KH.Screening for pre-eclampsia <strong>and</strong> fetal growth restriction byuterine <strong>artery</strong> <strong>Doppler</strong> <strong>at</strong> <strong>11</strong>–14 <strong>weeks</strong> of gest<strong>at</strong>ion. UltrasoundObstet Gynecol 2001; 18: 583–586.<strong>13</strong>. Davey DA, MacGillivray I. The classific<strong>at</strong>ion <strong>and</strong> definition ofthe hypertensive disorders of pregnancy. Am J Obstet Gynecol1988; 158: 892–898.14. Gardosi J, Francis A. Software program for the calcul<strong>at</strong>ion ofcus<strong>to</strong>mized birth weight percentiles. Version 6.2, 2000–2007;Published on http://www.gest<strong>at</strong>ion.net [Accessed 14 March2007].15. Gomez O, Figueras F, Martinez JM, del Rio M, Palacio M,Eixarch E, Puer<strong>to</strong> B, Coll O, Cararach V, Vanrell JA. Sequentialchanges in uterine <strong>artery</strong> blood flow p<strong>at</strong>tern between the first<strong>and</strong> second trimesters of gest<strong>at</strong>ion in rel<strong>at</strong>ion <strong>to</strong> pregnancyoutcome. Ultrasound Obstet Gynecol 2006; 28: 802–808.16. Carbillon L, Uzan M, Largilliere C, Perrot N, Tigaizin A,Paries J, Pharizien I, Uzan S. Prospective evalu<strong>at</strong>ion of uterine<strong>artery</strong> flow velocity waveforms <strong>at</strong> 12–14 <strong>and</strong> 22–<strong>24</strong> <strong>weeks</strong> ofgest<strong>at</strong>ion in rel<strong>at</strong>ion <strong>to</strong> pregnancy outcome <strong>and</strong> birth weight.Fetal Diagn Ther 2004; 19: 381–384.17. von Dadelszen P, Magee LA, Roberts JM. Subclassific<strong>at</strong>ion ofpre-eclampsia. Hypertens Pregnancy 2003; 22: 143–148.18. Witlin GA, Saade GR, M<strong>at</strong>tar FM, Sibai BM. Predic<strong>to</strong>rs ofneon<strong>at</strong>al outcome in women with severe preeclampsia oreclampsia between <strong>24</strong> <strong>and</strong> 33 <strong>weeks</strong>’ gest<strong>at</strong>ion. Am J ObstetGynecol 2000; 182: 607–6<strong>11</strong>.19. Irgens HU, Reisaeter L, Irgens LM, Lie RT. Long term mortalityof mothers <strong>and</strong> f<strong>at</strong>hers after pre-eclampsia: popul<strong>at</strong>ion basedcohort study. BMJ 2001; 323: 12<strong>13</strong>–1<strong>21</strong>7.20. Anten<strong>at</strong>al care: Routine care for the healthy pregnant woman.Clinical Guideline. N<strong>at</strong>ional Collabor<strong>at</strong>ing Centre for Women’s<strong>and</strong> Children’s Health. Commissioned by the N<strong>at</strong>ional Institutefor Clinical Excellence. Oc<strong>to</strong>ber 2003.<strong>21</strong>. Villar J, Abdel-Aleem H, Merialdi M, M<strong>at</strong>hai M, AliMM, Zavaleta N, Purwar M, Hofmeyr J, Nguyen TN,Campódonico L, L<strong>and</strong>oulsi S, Carroli G, Lindheimer M; WorldHealth Organiz<strong>at</strong>ion Calcium Supplement<strong>at</strong>ion for the Preventionof Preeclampsia Trial Group. World Health Organiz<strong>at</strong>ionr<strong>and</strong>omized trial of calcium supplement<strong>at</strong>ion among low calciumintake pregnant women. Am J Obstet Gynecol 2006; 194:639–649.22. Rumbold AR, Crowther CA, Haslam RR, Dekker GA, RobinsonJS; ACTS Study Group. Vitamins C <strong>and</strong> E <strong>and</strong> the risks ofpreeclampsia <strong>and</strong> perin<strong>at</strong>al complic<strong>at</strong>ions. NEnglJMed2006;354: 1796–1806.23. Pos<strong>to</strong>n L, Briley AL, Seed PT, Kelly FJ, Shennan AH. Vitaminsin Pre-eclampsia (VIP) Trial Consortium. Lancet 2006; 367:<strong>11</strong>45–<strong>11</strong>54.<strong>24</strong>. Askie LM, Duley L, Henderson-Smart DJ, Stewart LA on behalfof the PARIS Collabor<strong>at</strong>ive Group. Antipl<strong>at</strong>elet agents forprevention of pre-eclampsia: a meta-analysis of individualp<strong>at</strong>ient d<strong>at</strong>a. Lancet 2007; 369: 1791–1798.Copyright © 2008 ISUOG. Published by John Wiley & Sons, Ltd. Ultrasound Obstet Gynecol 2008; 32: <strong>13</strong>8–146.