Jerry Norquist - League of American Bicyclists
Jerry Norquist - League of American Bicyclists
Jerry Norquist - League of American Bicyclists

Create successful ePaper yourself
Turn your PDF publications into a flip-book with our unique Google optimized e-Paper software.
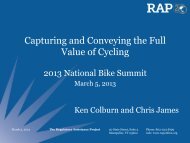
Economic ImpactPilot Study<strong>Jerry</strong> <strong>Norquist</strong> Board Member NBTDA Cycle Oregon
Overview ! Background ! Who is the consumer? ! Ride par7cipa7on ! Travel ! Economic Impact ! Why is this importance? ! What comes next? ! Q&A
Survey Design Collabora7ve Effort • 11 ride directors • Same survey for all rides • July -‐ October 2013 • 11 rides • 3,039 responses
Rider Demographics 63% Male 37% Female 70% Age 45-‐64 (Avg. Age 53.7) 75% HHI $100,000+ (Avg. HHI $129,015) 33% Have Children In Household Spend, on average 11.4% <strong>of</strong> their discre7onary income on bicycling
Geographic Pr<strong>of</strong>ile US Average – 27.4% Japanese Average – 3.9%
Bicycling Pr<strong>of</strong>ile • 91% Ride 2+ 7mes/week • 86% Own 2+ bicycles – 2.8 personal bicycles (avg.) • Reasons for riding – 95% Fitness – 93% Fun – 76% Organized cycling events – 70% Social ac7vity
Mo7va7ons for spending more 7me riding your bicycle • Safer roads (67%) • Wider/beBer maintained shoulders (64%) • More bike lanes (59%) • More free 7me (56%) • More designated bike routes (46%) • More considerate drivers (44%) • More bike trails (44%) • More places to ride (39%)
Purchase Pr<strong>of</strong>ile Overall median spending on event or ride specific purchases is 11% higher than normal! 575 550 525 $554500 $499475 450 Last 12 Months For Event/Ride
80%Par7cipated as part <strong>of</strong> a larger group
Economic Impact Direct Impact Indirect Impact plus “Ripple” effect
Direct Impact Addi7onal Ride Spending ! Cycling-‐related purchases ! Bicycle shipping expenses ! Travel expenses ! Personal expenditures at ride ! Group support expenditures at ride
Economic Impact* Event-‐related purchasesBicycle shipping expensesTravel to/from eventPersonal spending at eventSupport spending at eventGrand Total 14,582,547.36 510,064.10 9,321,762.22 6,110,698.67 2,070,526.35 $32,595,598.70 Direct financial impact from the 11 rides surveyed!
Why Is This Important? Accurate Economic data not previously available from NBTDA members Data helps influence good public policy. Magnitude <strong>of</strong> impact much larger than previously believed.
Bicycling is Big Business!
Next Steps NBTDA goal 50% or higher par7cipa7on rate among members Work with <strong>League</strong> <strong>of</strong> <strong>American</strong> <strong>Bicyclists</strong> to conduct future surveys
Economic Benefits 6.1 million <strong>American</strong> jobs $646 billion outdoor recrea7on spending $39.9 billion federal tax revenue $39.7 billion state & local tax revenue
Overlooked Economic Giant Annual Consumer Spending in Billions Bureau <strong>of</strong> Economic Analysis, Personal Consump7on Expenditures by type <strong>of</strong> product, based on available 2010 data
Outdoor Recrea7on Employs America Jobs Comparison By Industry
The outdoor recrea7on economy grew approximately 5 percent annually between 2005 and 2011 – this during an economic recession when many sectors contracted.
Outdoor Recrea7on Strengthens Local Communi7es The outdoor recrea7on economy generates $80 billion in Na7onal, State and local tax revenues each year.
Outdoor Recrea7on Economy Direct & Total Impact by Ac7vity Outdoor Recrea7on Par7cipants Annualy Spend:
Thank You<strong>Jerry</strong> <strong>Norquist</strong> jerry@cycleoregon.com