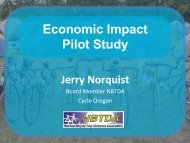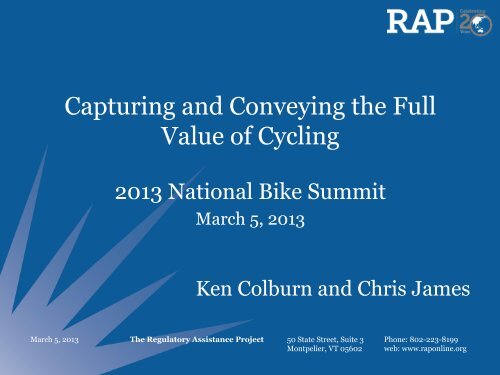
Ken Colburn, Symbiotic Strategies LLC
Ken Colburn, Symbiotic Strategies LLC
Ken Colburn, Symbiotic Strategies LLC

You also want an ePaper? Increase the reach of your titles
YUMPU automatically turns print PDFs into web optimized ePapers that Google loves.
Disclaimers…• Billing disclaimer:- Not about health- Affiliation wrong- No “latest study”…• But hopefully a useful unifying framework for you• Kudos to co-author, Chris James- He’d do twice as good a job – 4k vs. 2K• Also greetings from another colleague Jim Lazar2
Introductions• The Regulatory Assistance Project (RAP) is a global,non-profit team of energy experts, mostly veteranregulators, advising current regulators on long-termeconomic and environmental sustainability.(www.raponline.org)• <strong>Ken</strong> <strong>Colburn</strong> is a Senior Associate at RAP; hepreviously directed the air quality division at theNew Hampshire Department of EnvironmentalServices. He is an LCI and rides ~2,000 mpy.• Chris James is a Principal at RAP; he previously ledConnecticut’s climate and energy efforts at thestate’s Department of Environmental Protection.He rides over 4,000 mpy all over the world.3
Energy and Transportation“Demand Curves” Are SimilarLittle time at very high, very expensive, peakdemand levels. Isn’t there a better way?4
• Energy efficiency is the answer.• What was the question?5
A “Layer Cake” of Energy Efficiency (EE) Benefits$200 $180 $160 $140 $120 $100 $80 $60 $40 $20 $0 Vermont Energy Efficiency Savings Value Updated Externality and NEB Values (2010, $/MWh) Risk DTQ NEB Other Fuel O&M Other Resources ExternaliBes Avoided Reserves Line Losses DistribuBon Capacity Transmission Capacity Avoided Capacity Avoided Energy Most analyses of EE areincomplete:• Some look only atavoided energy costs.• Many include productioncapacity costs, but nottransmission ordistribution capacity orline losses.• Few include otherresource savings (water,gas, oil).• Very few quantity“externalities”(non-energy benefits.)6
Build a Bike/Walk “Layer Cake”!• Just as LAB was soliciting proposals in late2012, Darren Flusche and Todd Litmanwere (unbeknownst to us) developing theirbest works yet.• Our “layers” draw heavily upon theiranalyses7
• What:Layer 1: Vehicle Cost Savings- Purchase, lease, interest, depreciation- Gasoline, oil, tire wear, repairs- Registration, insurance- Other• How Much:- 56.5¢/mile: IRS cost/mile (2013)8
Capturing and Conveying the Full Value of Cycling Benefits in $/mile Ridden $1.60 $1.40 $1.20 $1.00 $0.80 $0.60 $0.40 Vehicle Cost Savings, 56.5¢ $0.20 $0.00 9
• What:Layer 2: User Benefits- Convenience, comfort, safety, accessibility,mobility, exercise, and enjoyment- Higher property values• +1 Walkscore point = +$700-$3,000• +1’ closer to trail = +$7.05• Indy:
Capturing and Conveying the Full Value of Cycling Benefits in $/mile Ridden $1.60 $1.40 $1.20 $1.00 $0.80 $0.60 $0.40 $0.20 User Benefits, 25¢ Vehicle Cost Savings, 56.5¢ $0.00 11
Layer 3: Physical Fitness & Health• What:- Longevity, morbidity, quality of life• Heart disease, stroke, hypertension, cancer,diabetes, cancer• Depression/stress, dementia- Accident risk• How Much:- 20¢/mile• (New Zealand puts health+congestion at $1.92!)12
Capturing and Conveying the Full Value of Cycling Benefits in $/mile Ridden $1.60 $1.40 $1.20 $1.00 $0.80 $0.60 $0.40 $0.20 Physical Fitness & Health, 20¢ User Benefits, 25¢ Vehicle Cost Savings, 56.5¢ $0.00 13
Layer 4: Air, Water & Noise Pollution• What:- Auto production and use pollutes- Fine particles, ozone, toxics/carcinogens, globalwarming pollution- Impacts vary locally, regionally, globally, but nearhighwayselevates exposure markedly• How Much:- 10¢/mile (<strong>Colburn</strong> & James)• Litman (2012) – 4.4¢ (1¢-10¢ range) but excludes particles,toxics, and global warming pollutants.14
Capturing and Conveying the Full Value of Cycling Benefits in $/mile Ridden $1.60 $1.40 $1.20 $1.00 $0.80 $0.60 $0.40 $0.20 Air, water, noise polluUon, 10¢ Physical Fitness & Health, 20¢ User Benefits, 25¢ Vehicle Cost Savings, 56.5¢ $0.00 15
• What:Layer 5: Option Value & Equity- Value people place on having an optionavailable that they don’t now use (e.g.,lifeboats)- Provide equitable share of resources tonon-drivers and basic mobility to lessadvantagedpeople• How Much:- 7¢/mile16
Capturing and Conveying the Full Value of Cycling Benefits in $/mile Ridden $1.60 $1.40 $1.20 $1.00 $0.80 $0.60 $0.40 $0.20 $0.00 OpUon Value and Equity, 7¢ Air, water, noise polluUon, 10¢ Physical Fitness & Health, 20¢ User Benefits, 25¢ Vehicle Cost Savings, 56.5¢ 17
• What:Layer 6: Reduced Congestion- Increased travel time, vehicle operatingcosts, stress and pollution emissions- Comparable to electricity load durationcurve: Small reductions at peak make a bigdifference• How Much:- 6¢/mile; range 1¢-20¢/mile, but 10¢-35¢per urban-peak-mile18
Capturing and Conveying the Full Value of Cycling Benefits in $/mile Ridden $1.60 $1.40 $1.20 $1.00 $0.80 $0.60 $0.40 $0.20 $0.00 Reduced CongesUon, 6¢ OpUon Value and Equity, 7¢ Air, water, noise polluUon, 10¢ Physical Fitness & Health, 20¢ User Benefits, 25¢ Vehicle Cost Savings, 56.5¢ 19
• What:Layer 7: Land Use Impacts- Reduce sprawl impacts; less need for landfor highway and parking facilities- Create more accessible, compact, mixed,infill development (smart growth)- Provide community and otherenvironmental benefits• How Much:- 5.3¢/mile; likely low20
Capturing and Conveying the Full Value of Cycling Benefits in $/mile Ridden $1.60 $1.40 $1.20 $1.00 $0.80 $0.60 $0.40 $0.20 $0.00 Land Use Impacts, 5.3¢ Reduced CongesUon, 6¢ OpUon Value and Equity, 7¢ Air, water, noise polluUon, 10¢ Physical Fitness & Health, 20¢ User Benefits, 25¢ Vehicle Cost Savings, 56.5¢ 21
• What:Layer 8: Reduced Parking- Urban parking spaces cost $5,000-$50,000($500-$3,000/year)- 3+ spaces/vehicle, rural & suburbanhighest (where parking is provided)• How Much:- 5¢/mile; range $1-$4/trip; assume $1/tripand 20 mile trip22
Capturing and Conveying the Full Value of Cycling Benefits in $/mile Ridden $1.60 $1.40 $1.20 $1.00 $0.80 $0.60 $0.40 $0.20 $0.00 Parking, 5¢ Land Use Impacts, 5.3¢ Reduced CongesUon, 6¢ OpUon Value and Equity, 7¢ Air, water, noise polluUon, 10¢ Physical Fitness & Health, 20¢ User Benefits, 25¢ Vehicle Cost Savings, 56.5¢ 23
• What:Layer 9: Roadway Cost Savings- Roadways cost ~$700/person/year in US,paid through taxes and fees- Cycling and walking need less road space,impose far less wear, and so cost much lessper mile of travel• How Much:- 4.2¢/mile; range 3¢-5¢/mile24
Capturing and Conveying the Full Value of Cycling Benefits in $/mile Ridden $1.60 $1.40 $1.20 $1.00 $0.80 $0.60 $0.40 $0.20 $0.00 Roadway Cost Savings, 4.2¢ Parking, 5¢ Land Use Impacts, 5.3¢ Reduced CongesUon, 6¢ OpUon Value and Equity, 7¢ Air, water, noise polluUon, 10¢ Physical Fitness & Health, 20¢ User Benefits, 25¢ Vehicle Cost Savings, 56.5¢ 25
• What:Layer 10: Traffic Safety- Crashes are among the largest of “external”transportation costs (~2¢-12¢ per vehiclemile)- Cycling/walking reduces crash costsbecause risks are lower and distances less• How Much:- 4¢/mile; range 3¢-5¢/mile26
Capturing and Conveying the Full Value of Cycling Benefits in $/mile Ridden $1.60 $1.40 $1.20 $1.00 $0.80 $0.60 $0.40 $0.20 $0.00 Traffic Safety, 4¢ Roadway Cost Savings, 4.2¢ Parking, 5¢ Land Use Impacts, 5.3¢ Reduced CongesUon, 6¢ OpUon Value and Equity, 7¢ Air, water, noise polluUon, 10¢ Physical Fitness & Health, 20¢ User Benefits, 25¢ Vehicle Cost Savings, 56.5¢ 27
• What:Layer 11: Energy Conservation- Vehicle production and use consumes muchenergy, imposing high external costs(economic and national security impacts,foreign oil dependence, environmental andhealth damages)- Each 1% mode shift can reduce fuel use 2-4%• How Much:- 3¢/mile; range 1¢-4¢/mile28
Capturing and Conveying the Full Value of Cycling Benefits in $/mile Ridden $1.60 $1.40 $1.20 $1.00 $0.80 $0.60 $0.40 $0.20 $0.00 Energy ConservaUon, 3¢ Traffic Safety, 4¢ Roadway Cost Savings, 4.2¢ Parking, 5¢ Land Use Impacts, 5.3¢ Reduced CongesUon, 6¢ OpUon Value and Equity, 7¢ Air, water, noise polluUon, 10¢ Physical Fitness & Health, 20¢ User Benefits, 25¢ Vehicle Cost Savings, 56.5¢ 29
• What:Layer 12: Reduced Barriers- Travel delays, access restrictions, & costs dueto “road improvement” projects- Impose direct and indirect costs on cycling/walking; causing shift to vehicles- Example: No sidewalks/bike lanes to schools• How Much:- 1¢/mile; range 0.5¢-1.5¢/mile30
Capturing and Conveying the Full Value of Cycling Benefits in $/mile Ridden $1.60 $1.40 $1.20 $1.00 $0.80 $0.60 $0.40 $0.20 $0.00 Reduced Barrier Effect, 1¢ Energy ConservaUon, 3¢ Traffic Safety, 4¢ Roadway Cost Savings, 4.2¢ Parking, 5¢ Land Use Impacts, 5.3¢ Reduced CongesUon, 6¢ OpUon Value and Equity, 7¢ Air, water, noise polluUon, 10¢ Physical Fitness & Health, 20¢ User Benefits, 25¢ Vehicle Cost Savings, 56.5¢ 31
• What:Layer 13: Economic Development -Transport Efficiency- Reduced costs to commuters, businesses andgovernments also reduce production costs,increasing economic productivity andcompetitiveness.• How Much:- Difficult-to-Quantify (DTQ)- Placeholder: 1¢/mile32
Layer 13: Economic Development -Transport Efficiency• Examples (1):- New 4-lane urban highways: $40-$80 millionper mile (higher in sensitive areas)- MAP-21’s entire 2013 TransportationAlternatives budget: $809 million- By contrast, new urban bike lanes:
Layer 13: Economic Development -Transport Efficiency• Examples (2):- Cincinnati is as costly as “expensive Chicago”!- “Expensive Boston” is less so than Tampa!34
Capturing and Conveying the Full Value of Cycling Benefits in $/mile Ridden DTQ-‐ED: Transport Efficiency, 1¢ $1.60 $1.40 $1.20 $1.00 $0.80 $0.60 $0.40 $0.20 $0.00 Reduced Barrier Effect, 1¢ Energy ConservaUon, 3¢ Traffic Safety, 4¢ Roadway Cost Savings, 4.2¢ Parking, 5¢ Land Use Impacts, 5.3¢ Reduced CongesUon, 6¢ OpUon Value and Equity, 7¢ Air, water, noise polluUon, 10¢ Physical Fitness & Health, 20¢ User Benefits, 25¢ Vehicle Cost Savings, 56.5¢ DTQ-ED = Difficult-to-Quantify Economic Development35
Layer 14: Economic Development- Labor Productivity• What:- Improved access to education and jobsincreases the quality and quantity of the laborpool, reducing business costs and increasingproductivity and competitiveness.- Also increases labor productivity by enhancingworker fitness.• How Much:- Placeholder: 1¢/mile36
Layer 14: Economic Development- Labor Productivity• Examples:- IPMBA: Arrest rates rose ~24% when bicycleswere introduced into patrol areas; then felland crime stabilized, due to the bike deterrent• Stealth: a bike cop sees more – and is seen less –than a police cruiser- Vancouver parking enforcement 30-100%more productive on bikes; officers easilynavigate congested areas and don’t waste timesearching for parking spaces37
Capturing and Conveying the Full Value of Cycling Benefits in $/mile Ridden $1.60 $1.40 $1.20 $1.00 $0.80 $0.60 $0.40 $0.20 $0.00 DTQ-‐ED: Labor ProducUvity, 1¢ DTQ-‐ED: Transport Efficiency, 1¢ Reduced Barrier Effect, 1¢ Energy ConservaUon, 3¢ Traffic Safety, 4¢ Roadway Cost Savings, 4.2¢ Parking, 5¢ Land Use Impacts, 5.3¢ Reduced CongesUon, 6¢ OpUon Value and Equity, 7¢ Air, water, noise polluUon, 10¢ Physical Fitness & Health, 20¢ User Benefits, 25¢ Vehicle Cost Savings, 56.5¢ 38
• What:Layer 15: Economic Development- Land Use Efficiency- More accessible and compact land usepatterns provide accessibility benefits,creating agglomeration efficiencies andresource cost savings.• e.g., Density; cluster development• How Much:- Placeholder: 1¢/mile39
Capturing and Conveying the Full Value of Cycling Benefits in $/mile Ridden $1.60 $1.40 $1.20 $1.00 $0.80 $0.60 $0.40 $0.20 $0.00 DTQ-‐ED: Land Use Efficiency, 1¢ DTQ-‐ED: Labor ProducUvity, 1¢ DTQ-‐ED: Transport Efficiency, 1¢ Reduced Barrier Effect, 1¢ Energy ConservaUon, 3¢ Traffic Safety, 4¢ Roadway Cost Savings, 4.2¢ Parking, 5¢ Land Use Impacts, 5.3¢ Reduced CongesUon, 6¢ OpUon Value and Equity, 7¢ Air, water, noise polluUon, 10¢ Physical Fitness & Health, 20¢ User Benefits, 25¢ Vehicle Cost Savings, 56.5¢ 40
• What:Layer 16: Economic Development- Consumer Spending- Consumer spending changes (especially lesson vehicles and fuel), which can affectregional economic activity:• More money circulating in local economy• Less money is exported from the region/nation• How Much:- Placeholder: 1¢/mile41
Layer 16: Economic Development- Consumer Spending• Examples:- Autos and oil are major industries, but:• Much is imported;• Capital intensive with relatively little labor input;Economic activity increases as spendingshifts to other goods- NH: ~$6-7 billion/year for energy (all forms);~2/3 ($4.5 billion) leaves the Stateimmediately, mostly for petroleum42
Capturing and Conveying the Full Value of Cycling Benefits in $/mile Ridden $1.60 $1.40 $1.20 $1.00 $0.80 $0.60 $0.40 $0.20 $0.00 DTQ-‐ED: Consumer Expenditures, 1¢ DTQ-‐ED: Land Use Efficiency, 1¢ DTQ-‐ED: Labor ProducBvity, 1¢ DTQ-‐ED: Transport Efficiency, 1¢ Reduced Barrier Effect, 1¢ Energy ConservaBon, 3¢ Traffic Safety, 4¢ Roadway Cost Savings, 4.2¢ Parking, 5¢ Land Use Impacts, 5.3¢ Reduced CongesBon, 6¢ OpBon Value and Equity, 7¢ Air, water, noise polluBon, 10¢ Physical Fitness & Health, 20¢ User Benefits, 25¢ Vehicle Cost Savings, 56.5¢ 43
• What:Layer 17: Economic Development- Specific Industries- Certain industries benefit greatly includingbike shops, tourism, retail activity, andconstruction/real estate development thathighlights livability.- NCDOT $60m; Portland $90m; Boulder$52m economic activity annually• How Much:- Placeholder: 1¢/mile44
• Examples:Layer 17: Economic Development- Specific Industries- Bike shops & tourism sure,but construction & realestate?- More money in pocket =>greater home ownership• Top reason for mortgagedisapproval: Car paymentstoo high• Probability of mortgageforeclosure increases asvehicle ownership levels rise45
$1.60 $1.40 $1.20 $1.00 $0.80 $0.60 $0.40 $0.20 $0.00 Capturing and Conveying the Full Value of Cycling Benefits in $/mile Ridden DTQ-‐ED: Specific Industries, 1¢ DTQ-‐ED: Consumer Expenditures, 1¢ DTQ-‐ED: Land Use Efficiency, 1¢ DTQ-‐ED: Labor ProducUvity, 1¢ DTQ-‐ED: Transport Efficiency, 1¢ Reduced Barrier Effect, 1¢ Energy ConservaUon, 3¢ Traffic Safety, 4¢ Roadway Cost Savings, 4.2¢ Parking, 5¢ Land Use Impacts, 5.3¢ Reduced CongesUon, 6¢ OpUon Value and Equity, 7¢ Air, water, noise polluUon, 10¢ Physical Fitness & Health, 20¢ User Benefits, 25¢ Vehicle Cost Savings, 56.5¢ 46
Cumulative Layer Cake• Total : $1.52/mile benefits (conservative, yet nearly 3xIRS $-per-mile figure)• Build your own “Layer Cake”!• Caveats:- Overlaps; risk of double-counting- Who pays/who benefits questions- Difficult-to-quantify does not mean unimportant47
• Litman (2012):Jobs, Jobs, Jobs…- “Reducing vehicle and fuel spending tends to supporteconomic development. Because non-motorized facilityconstruction is relatively labor intensive [and local], ittends to create more employment and regional businessactivity than other capital projects.”• Garrett-Peltier (2010):- Direct, indirect, and induced employment created ininfrastructure design, construction, and materials:- Cycling: 11.4 jobs per $1 million- Roadway: 7.8 jobs per $1 million48
It’s Happened in Energy (RPS & EERS),Now It’s Happening in Transportation:GDP & VMT are “Decoupling”Off ~15%and justgettingstarted?Question forMembers ofCongress:“This ishappening;are yougoing tolead, follow,or just getrun over?”49
Close with Some Stories…• Epiphanies yesterday: Bruce Katz was talkingabout me/us (Roberta Flack – “with his song”)- Real Estate decisions:• 2008 Durango closing anecdote: Jeans, Ride, & LTE• 2012 Bar Harbor: 1 mi. to Park Loop Road (top 10); wifegiggles on the carriage trails- And my generation isn’t the “leading edge”;• Two kids, 30 and 27, “crowning achievement: both can drive astick”, but today, neither owns a car• Bicycling is the answer!What was the question?50
About RAPThe Regulatory Assistance Project (RAP) is a global, non-profit team of experts thatfocuses on the long-term economic and environmental sustainability of the powerand natural gas sectors. RAP has deep expertise in regulatory and market policiesthat:§ Promote economic efficiency§ Protect the environment§ Ensure system reliability§ Allocate system benefits fairly among all consumersLearn more about RAP at www.raponline.org<strong>Ken</strong> <strong>Colburn</strong> kcolburn@raponline.org (617) 784-6975Chris James cjames@raponline.org (617) 861-7684
• Analogue to debits & credits: A “doubleswing”in magnitude occurs when modeshift changes.52