Genentech Error Proofs Its Batch Records.pdf - Juran Institute
Genentech Error Proofs Its Batch Records.pdf - Juran Institute
Genentech Error Proofs Its Batch Records.pdf - Juran Institute

Create successful ePaper yourself
Turn your PDF publications into a flip-book with our unique Google optimized e-Paper software.
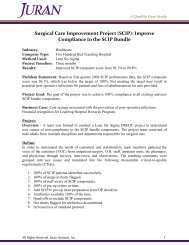
DOCUMENTATIONDOCUMENTATIONtions mean they have to be controlled.A decision by <strong>Genentech</strong>’s senior managementto error proof such documentation resulted in theachievement of sustainable breakthrough improvementsthrough the focused deployment of SixSigma and lean project teams.LaunchThe error proofing project was chartered inSeptember 2003 by the good manufacturing practicescore team at <strong>Genentech</strong>. The objective of theproject was to reduce the inspection risk associatedwith document errors and lost tickets. This objectivewas expressed as the following dual goal:• Goal one—Reduce the rate of documenterrors recorded in the discrepancy managementsystem by 50% relative to the first andsecond quarter 2003 baseline by September2004. Maintain the document error rate withinthis new zone of control: less than five documenterrors per 100 tickets (main batch recorddocuments) for three months or more.• Goal two—Reduce the overall volume of masterticket errors by 50% relative to the first andsecond quarter 2003 baseline.Six error proofing teams were chartered in October2003 to investigate the drivers for this pattern of errorand variability. Consultants working with the teamsasked them to use one or more of the followingindustry standard methodologies:• DMAIC (define, measure, analyze, improve andcontrol), which is intended to analyze and diagnosethe root causes of the problem, developand implement remedies and hold the gains—as Joseph <strong>Juran</strong> would put it—to achieve breakthroughresults that are sustainable.FIGURE 1Document <strong>Error</strong> Rate20.0018.00Discrepancies per 100 ticketsJan. 2003 to Feb. 2005 with change in processUCL = 18.1116.00Number of discrepancies14.0012.0010.008.00Mean = 9.87Process change:reduced variationand mean6.00UCL = 5.244.002.00Mean = 3.74LCL = 2.25LCL = 1.640.00Jan.Feb.MarchAprilMayJuneJulyAug.Sept.Oct.Nov.Dec.Jan.Feb.MarchAprilMayJuneJulyAug.Sep.Oct.Nov.Dec.Jan.Feb.<strong>Error</strong>s/100 ticketsEvent codes e1.1, e1.2 and e1.3 per 100 tickets stamped complete in production operations management system per month, January 2003 through November 2004.UCL = upper control limit. LCL = lower control limit.26 IJULY 2005 Iwww.asq.org
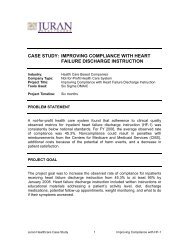
FIGURE 2Master Ticket <strong>Error</strong>s Per Month1009080706050Average: 49master ticketerrors403020Average: 10master ticketerrors100Feb.MarchAprilMayJuneJulyAug.Sept.Oct.Nov.Dec.Jan.Feb.MarchAprilMayJuneJulyAug.Sept.Oct.Nov.Dec.Jan.Feb.MarchAprilMayJuneJuly2002 20032004• DMADV (define, measure, analyze, designand verify), which is intended to guide a teamin the development and deployment of a newsystem or process that will prove capable ofreliably meeting the prioritized needs of customers—internaland external, as appropriate.• Lean/value stream mapping (VSM): a leanmanufacturing technique designed to achieveerror free operations through cycle time compressionand simplification. This approach ischaracterized by a team’s decomposing aprocess through VSM, followed by quickanalyses and brainstorming and rapid implementationof improvements.The wave one teams were chartered so theirimplementations would begin in March 2004 anddeliver measurable document error rate reductionsby June 2004.The six projects were:1. Timely feedback using DMAIC.2. Change to volume and timing using DMAIC.3. VSM in growth hormone and recovery operationsusing lean/VSM.4. Document rule clarification using DMAIC.5. Document development using DMADV.6. Document complexity using DMADV.Breakthrough ResultsAnd New Control ZoneAs illustrated in Figure 1, the teams achievedthe first goal in May of 2004, and document errorshave been held within the new zone of controlever since.The teams achieved the second goal almostimmediately, and the incidence of master ticketerrors has not returned to first and second quarter2003 levels since the project began (see Figure 2).Heightened awareness, improved visibility andcontrol over the document development processwere recently formalized into an improved managementsystem through the efforts of the documentdevelopment team.QUALITY PROGRESS IJULY 2005 I 27
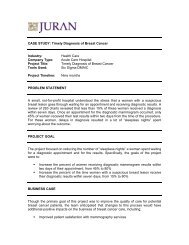
DOCUMENTATIONKey FindingsThe key findings and their associatedimplementations include the following:•More timely feedback.•Better timing of changes.•Reduced change volume.•Different ink color.•Centralized equipment log locationand other rapid improvements.•Reduction of documentation ruleconfusion.•Central coordination for documentchanges and other actions todecrease word processing errors.• Less complex documents.• Improvements to other factors.More timely feedback. Based oninterviews across all shifts, the projectteam concluded the timing and utilityof feedback provided varied acrossproduction teams. In particular, theproject team found a mechanism fortimely feedback was present only incertain instances.The team set out to correlate thepresence or absence of timely feedbackto document error rates. Table 2shows the correlation.Teams with timely feedback performed50% better than those withincomplete or delayed feedback (seeFigure 3).As predicted by the team, the documenterror rate took its first significantshift toward a new zone of control inApril 2004, immediately after the timelyfeedback mechanisms were introduced.Better timing of changes. The changevolume and timing project team—workingon a DMAIC project—set out toinvestigate the relationship betweendocument effective and release dateswith regard to errors per document.By correlating the interval betweenrelease and effective dates to the documenterrors recorded per execution ofthe ticket, the team was able to show10FIGURE 39876543210TABLE 2Master Ticket <strong>Error</strong>s Per MonthAverage for poor performers(groups without timely feedback)Chi-Square Test Showing CorrelationBetween Timely Feedback and Document<strong>Error</strong> RatesExpected counts are printed below observed counts.Chi-square contributions are printed below expected counts.< One weekFeedback S 0 Feedback S Total1 25 19 4420.20 23.801.138 0.9672 20 34 5424.80 29.200.928 0.788Total 45 53 98Chi-square = 3.820; delayed feedback = 1; P-value = 0.051.There is a statistical relationship of dependence between the lack of feedbackand the groups identified as high and low performers (on document errors).Feedback S = timely feedback provided (< one week).0 Feedback S = no timely feedback or feedback provided.Close the gapCombined groups50%Average for high performers(groups with timely feedback)28 IJULY 2005 Iwww.asq.org
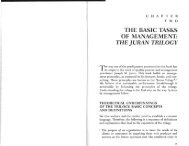
FIGURE 4Count discrepancies per weekthe documents madeeffective within three daysof their release dates carrieda disproportionatenumber of error discrepancies(see Figure 4).Because 45.7% of ticketshad less than two daysbetween release and effectivedates, these documentsrepresented a significantdriver of document errorson the floor. As the teaminvestigated further, theyconfirmed one- to threedayintervals did not permitmeaningful documenttraining to take placeacross shifts.Currently, the centralizeddocument managementfunction created inresponse to recommendationsfrom this team (andthe document developmentand complexityteams) uses the release toeffective date interval as aleading indicator of documenterror generation. We can expect the documenterror rate to remain low as long as we enforcethe minimum interval.Reduced change volume. Another driver of documenterrors confirmed by the change volume andtiming team was the number of times a documentgets changed in a year. More than 1,440 ticketchanges were initiated by <strong>Genentech</strong>’s South SanFrancisco (SSF) manufacturing facility—the company’smain operation—in 2003. By comparing thediscrepancy rates recorded for documents changedmore than three times in a year to those changedless often, the team confirmed frequent revisionsdrove errors (see Table 3 and Figure 5, p. 30).The team proposed enforcement of a mechanismto pull documents with more than three changesper year, coupled with a system to make revisionsmore visible. The team remained convinced thesemeasures would yield further document errorreduction benefits.706050403020100-10-201Relationship of Time Between ReleaseAnd Effective Dates and DiscrepanciesFitted line plotCount discrepancies per week = 50.57 – 5.229 averagetime between release and effective dates234Average time between release and effectivedates for documents and discrepancies56Different ink color. The lean/VSM team ingrowth hormone recovery operations generated alist of error proofing implementation ideas duringits rapid improvement phase. One of the ideas withevident universal utility grew out of an analysis ofthe factors that contribute to omission errors.The team noted when entries were made in blackink on batch records, forms and logs printed inblack ink, it could be hard to see where an entry thatwas required might be missing. The team proposedswitching to blue ink in an attempt to enhance thecontrast between entries made and printed text.After the details were negotiated with SSF qualityassurance and compliance, the necessary SOPchanges were made to permit the use of blue inkwithout requiring it. A memo was circulatedexplaining the rationale for the change and askingmanagers to enforce the consistent use of blue ink.The blue ink initiative was implemented inMarch 2004, just as the omission error rate droppedbelow five for the first time. Manufacturing online78Regression95% confidence interval95% prediction intervalS 13.1169R-square 30.7%R-square (adjusted) 28.2%QUALITY PROGRESS IJULY 2005 I 29
DOCUMENTATIONTABLE 3Kruskall-Wallis TestChangefrequency N Median Average rank Z0.08 215 0.1268 188.4 -3.060.17 127 0.1429 208.0 0.290.25 45 0.1875 243.8 2.300.33 20 0.5227 269.0 2.460.42 2 0.6483 317.0 1.330.58 1 0.6800 344.0 1.17Overall 410 205.5H = 18.09 Degrees of freedom = 5 P = 0.003H = 18.28 Degrees of freedom = 5 P = 0.003 (adjusted for ties)H is the Kruskall-Wallis statistic.P is the p-value of the statistical test.Test shows significant differences in median document errors across differentdocument change frequencies.Note: For more information on the Kruskall-Wallis Test, go towww.ticalc.org/archives/files/fileinfo/98/9837.html.<strong>Error</strong> rateFIGURE 5432100.08Change Frequency and <strong>Error</strong> Correlation0.17Boxplot of error rate vs. change frequency0.250.330.42auditor data collected in July and August 2004 suggestomissions are detected twice as often now that blue inkis in routine use (see Figure 6).Centralized equipment log location and other rapidimprovements. Another successfully implementedrapid improvement idea started when the growth hormonerecovery lean/VSM team looked at the centralizationof equipment use logs.Using a survey tool and spaghetti maps, the teamtested the hypothesis that having equipment uselogs scattered throughout the work area increasedtechnician wear and tear and, incidentally, the riskof document errors.After centralizing the logs in one location, 95%of the survey respondents agreed the system wasmuch easier to use (less travel, less time, less difficulty).Document error rates in the area continuedto drop after the logs were centralized.Rapid improvement efforts to identify singlepoints of contact, provide walkie talkies and structurecommunications for clarity, directness andsimplicity have all contributed to a reduction inthe impact of uncontrolled communications withemployees on the floor.Documentation rule confusion. Interviews withoperators who executed tickets confirmed a highdegree of confusion around the rules for cross outs,ruling out sections as not applicable, entering timecorrectly and other fine points of batch record creation.This confusion was identified as a potentiallysignificant driver of documentation errors.Many of the errors that resulted from confusionwere crossed out and then corrected during onlinereview without generating a discrepancy. However,such cross outs could still raise questions during anFDA audit because they reflect theoperator’s struggle to create the batchrecord correctly the first time.The team systematically cataloguedthe points of confusion (sub-Y’s) andthen completed a cause and effectanalysis for each to identify the drivers—f(X’s). Examples of these validatedsources of confusion (provenX’s) include:•Documents use ambiguous language(for example, “approximately”),which causes confusionabout document rules, leading todocument errors.• Some documents include informationabout alert limits only;others include informationabout alert limits and actionlimits. This inconsistency causes0.5830 IJULY 2005 Iwww.asq.org
TABLE 4Correlation Results, Complexity Score and <strong>Error</strong> RateCombined Fermentation Recoveryp R p R p RComplexity score 0.000 0.673 0.000 0.859 0.018 0.338Total data entries 0.000 0.632 0.000 0.829 0.093 0.242Total pages 0.000 0.618 0.000 0.925 0.006 0.385SOP/standard record (SR) references 0.000 0.617 0.000 0.748 0.001 0.457Operator steps 0.000 0.611 0.000 0.868 0.010 0.366Form numbers to refer 0.000 0.600 0.000 0.773 0.018 0.336Total SOPs/SRs 0.000 0.584 0.000 0.699 0.005 0.399Other G-code 0.000 0.575 0.000 0.713 0.007 0.380Verifier steps 0.000 0.491 0.000 0.877 0.016 0.343Labeling steps 0.000 0.442 0.000 0.838 0.021 0.328Calculations 0.000 0.395 0.019 0.466 0.134 0.217Attachments 0.032 0.249 0.000 0.738 0.210 0.182Verifi er/operator 0.470 -0.085 0.748 -0.068 0.832 0.031confusion about document rules, whichleads to document errors.•Documentation rules keep changing, whichcauses confusion about document rules, leadingto document errors.•Operators are trained by different trainers andFIGURE 6Document errors caught302520151050Jan.Observed Increase in DocumentReview EffeciencyFeb. March April May JuneTrend line.Number of document errors caught during review prior tosubmission to quality assurance for a final check.content is not consistent, which causes confusionabout document rules, leading to documenterrors.• Justification behind the rules (criteria for therules) is not communicated, which causes confusionabout document rules, leading to documenterrors.These validated causes of confusionwere converted to customerneeds and used as the basis fordesigning a clear, central SOP fordocumentation and the associatedtraining. These necessary toolswere made effective and providedto operators in May 2004—just asthe document error rate droppedbelow five per 100 tickets for thefirst time.Central coordination for documentchanges and other actions todecrease word processing errors.The document development andchange process team (a DMADVteam) defined its problem statementaround the inability of thecurrent process to reliably produceaccurate/error free documentsQUALITY PROGRESS IJULY 2005 I 31
DOCUMENTATIONwithin customer defined timelines.Data from the first and second quarters of 2003were analyzed by the team to identify master ticketerrors and map them to process steps when theerror could have originated or been caught (individualerrors were often mapped to multiple locations).This analysis identified the document developmentstage of the process—including technical writingand subject matter expert redline steps—as the mostsignificant generator of ticket errors (see Figure 7).A VSM of the process was created and used toshow only four of the 54 steps were value adding,two were nonvalue adding and the remaining 48were all classified as “needed but nonvalueadding.”A failure mode effects analysis of the processranked the various identified failure modes, androot causes were assigned to the most severe ones.The top 10 risk priority number scores could beassigned to three root causes: communicationgaps, business process inadequacies and resourcelimitations.The team designed an improved process usingDMADV methodology to address the identifiedissues and converted three root causes to customerneeds. The improved process—which features acentralized coordinator, automated step references,resource management tools and developmentchecklists—was piloted in the fall of 2004.Compared to the baseline data, the campaignpreparation effort delivered accurate documentsin accordance with defined timelines.Less complex documents. The problem statementdevised by the document complexity team (aDMADV project) emphasized the link betweendocument errors and instructions to manufacturingand quality assurance staff that were often overlycomplicated or inconsistent.The team interviewed customers (documentusers) across functions and prioritized their identifiedneeds. A Pareto chart of these findings is providedin Figure 8. The three needs identified mostoften were fewer pieces of paper, no conflictinginstructions and fewer data entries.FIGURE 7Pareto Chart of Performance Gaps140120100806040200SubjectmatterexpertredlinecreationTechwritingParalleldocumentapprovalDocumentownerreviewWordprocessingTecheditorreviewTecheditingQuality Sequentialassurance approvalchangemanagement<strong>Error</strong>s, n = 482SumFirst and second quarter 2003 data show combined origin and “miss” steps where error could have been caught.32 IJULY 2005 Iwww.asq.org
DOCUMENTATIONFIGURE 91614Omission Rate by Type Relationship to <strong>Error</strong> Proofing ImplementationsDocument error rates: e1.1 and e1.2Biochemshutdown12Blue inkImplemented1086Accountabilityfeedback420SOP revisionMay June July Aug Sept. Oct. Nov. Dec. Jan. Feb. March April May JuneInformation omitted/incorrect entryOperator and/or verifier omissionteam members are not overbooked.•Active and engaged sponsorship is key, especiallyduring initial scope of work definitionand chartering.•Management must resist the impulse to directteams to a solution prematurely while providingclear boundaries to the scope of the inquiryand timing of the project.• Care should be taken to prepare for trainingevents so logistical issues, absent sponsorsand confusion about project goals do not distractparticipants.In addition to these success factors, this efforttaught our management one truly fundamental lesson:Put your best people on the problem, makethe investment to provide them with world-classtools and support, and they will deliver lastingresults.ROBERT BOTTOME is director, packaging operations,for <strong>Genentech</strong> Inc., South San Francisco, CA. He earneda bachelor’s degree in zoology from the University ofCalifornia, Berkeley.RICHARD C.H. CHUA is executive vice president and SixSigma lean practice leader with the <strong>Juran</strong> <strong>Institute</strong> Inc.,Southbury, CT. He earned a bachelor’s degree in industrialengineering from Purdue University and a doctoratein business administration from the University ofMinnesota. Chua is a member of ASQ.PleasecommentIf you would like to comment on this article,please post your remarks on the Quality ProgressDiscussion Board at www.asq.org, or e-mailthem to editor@asq.org.34 IJULY 2005 Iwww.asq.org