assessment of soil erosion using usle model and gis for integrated ...
assessment of soil erosion using usle model and gis for integrated ...
assessment of soil erosion using usle model and gis for integrated ...

Create successful ePaper yourself
Turn your PDF publications into a flip-book with our unique Google optimized e-Paper software.
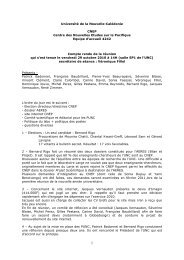
under the GIS s<strong>of</strong>tware. The LS factor ranges from 0 to 104 with an average <strong>of</strong> 6.4 (Fig. 6).Half <strong>of</strong> the values are under 5 <strong>and</strong> correspond mostly to plain zones. The high values (superiorto 20) correspond to the crests <strong>of</strong> the mountains, more sensible to <strong>erosion</strong>. But it representsonly 7% <strong>of</strong> the area.Fig.6: Spatial distribution <strong>of</strong> LS FactorIII.4/ Cover management: C-factorThe C-factor measures the effects <strong>of</strong> all interrelated cover <strong>and</strong> management variables (Renardet al., 1997). C factor is measured as the ratio <strong>of</strong> <strong>soil</strong> loss from l<strong>and</strong> cropped under specificconditions to the corresponding loss from tilled l<strong>and</strong> under continuous fallow conditions. Bydefinition, C equals 1 under st<strong>and</strong>ard fallow conditions. As surface cover is added to the <strong>soil</strong>,the C factor value approaches zero. A C factor <strong>of</strong> 0.15 means that 15% <strong>of</strong> the amount <strong>of</strong><strong>erosion</strong> will occur compared to continuous fallow conditions (Kesley <strong>and</strong> Johnson, 2003).The C factor was derived <strong>using</strong> remote sensing techniques. Thus, the l<strong>and</strong> cover layer wasimplemented from the results <strong>of</strong> the supervised classification method (produced by DTSI)based on a SPOT 3 satellite image taken in 1996 with a 20 meters resolution (Fig. 7). Thesedata seem old but the l<strong>and</strong> cover has not really changed these ten last years because the humanpressure is low in this region. The plain is covered by an extensive grass <strong>and</strong> dry niaoulissavannah over low hills <strong>and</strong> flat areas. Large areas <strong>of</strong> ultramafic rocks correspond tomountainous areas with vivid red lateritic <strong>soil</strong>s covered by an endemic vegetation bush <strong>and</strong><strong>for</strong>ests <strong>of</strong> unique plants species. Along the coastal zone mangroves are present. Thedetermination <strong>of</strong> factor C depends on the coverage <strong>of</strong> the <strong>soil</strong> surface by vegetation. Frombibliographic data, we assign a coefficient C between 0 <strong>and</strong> 1 <strong>for</strong> each type <strong>of</strong> vegetation onthe study area. (Table 3). The distribution <strong>of</strong> factor C is quite heterogeneous (Fig. 8). Bare<strong>soil</strong>s most erodible, are mainly located on the coast <strong>and</strong> the mountains degraded by miningactivity. The areas <strong>of</strong> dense vegetation located mainly in the hills <strong>of</strong> the “Central Chain areless susceptible to <strong>erosion</strong>.Table 3: L<strong>and</strong> cover types <strong>and</strong> C-FactorVegetation typeC FactorForest 0.001Savanna 0.04Mining scrubl<strong>and</strong> 0.25Swamp 0.28Brush 0.72Bare l<strong>and</strong> 17